Matching workforce to workload at TNT business counters
Master thesis:
Title: Collection, the starting point:
Matching workforce to workload at TNT Business Counters
Host organisation TNT N.V.
Research period: January 2009 – February 2010
Author:
Name: Eljo K. Haspels
Student number: 0050504
University: Twente University
Master’s degree program: Industrial Engineering and Management
Track: Production and Logistics
Contact: [email protected]
Supervisor Committee:
Supervisors University of Twente:
Dr. Ir. Leo van der Wegen
Lecturer at the School of Management and Governance
Dr. Ir. Gerhard Post
Lecturer at the Department of Applied Mathematics
Supervisors TNT |Post : Frans de wit
Manager Collection Netherlands
Marc Warmerdam
The final step in a students’ journey towards becoming a Master of Science is the completion of a master project. Reaching this final destination is of course important and provides a good starting point for the next step in life. But ‘success is a journey, not a destination’1. My journey as a student started almost 8 years ago. It has since provided me many great experiences, enabled me to meet many interesting people and lead me to many places around the world. I want to thank all friends, family, colleagues and teachers who (unknowingly) helped me to arrive where I am now.
This research and report represent my final step. It has to be said that this report has shown itself to be a great hurdle just in front of the finish line. But it has also been this hurdle which has probably taught me the most. Overcoming difficulties and personal disappointments in this process by actively asking support has been a great lesson. I want to thank the following persons for their part in pulling me back on track, helping me to focus, and being a listening ear when needed: Martijn, Robbert, Rutger, Juul, Matthijs, Max, Dianne, Noortje and Juerd. Moreover, I want to thank my supervisors Leo, Frans, Marc and Gerhard for their insights, patience, trust and the leeway they gave me to find my own way. Due to their support, the pleasant cooperation, and the help of many employees at TNT (especially Loek, Astrid, Lisa, Harry, Stella, Dico, Caroline, and Asti) I have enjoyed this project and hope to have contributed.
Finally, I want to particularly thank my parents. They have supported me with advice, trust and love throughout my life.
As always, when looking back, you realize you could have done your project differently, better, and faster, no exception here. But with this project finished, and with the lessons learned, I am looking forward to the new challenges ahead with enthusiasm and confidence: success is a journey, not a destination.
Eljo Haspels
1
This thesis describes a master graduation research into the problem of matching workforce to workload at TNT business counters. A TNT business counter is a facility where, every night, mail is collected, prepared and sent on to a sorting centre. Team managers at these collection facilities try, on a daily basis, to make sure the process is finished in time.
The strategy of TNT Mail Netherlands currently aims at cost reduction and the creation of a more flexible cost structure at all departments. To achieve these goals within the collection department, a reorganisation called DPM-C was started at business counters. This change process includes the implementation of standardized best practice processes and improvement of process steering. The first evaluations show that cost reduction is achieved, but team managers indicate they have no clear understanding on how to organize the required amount of workforce needed on an evening. Therefore, management at collection asked for a research into the daily process of matching workforce to workload.
In this thesis we address this operational workforce management problem. The amount of required workforce depends on two uncertain factors: “mail volume” and “productivity”. To estimate the magnitude of these uncertainties at two process (intake and preparation), we analyse data within existing databases at TNT and interview experts.
The mail volumes for the intake and preparation process fluctuate daily and can be approximated by a normal distribution function. We quantify the fluctuation by measuring the coefficient of variation, which is on average 0.1 and 0.2 for the intake and preparation process, respectively. For the productivity we conclude that, although norms exist for each process, the actual achieved productivity also fluctuates significantly.
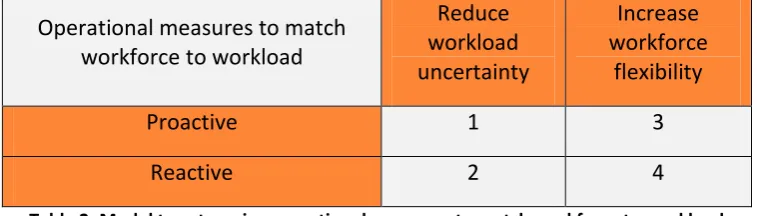
We discuss two ways to improve performance on matching workforce to workload: (1) taking actions to reduce the workload uncertainty, and (2) improving workforce flexibility to cope with the existing workload uncertainty.
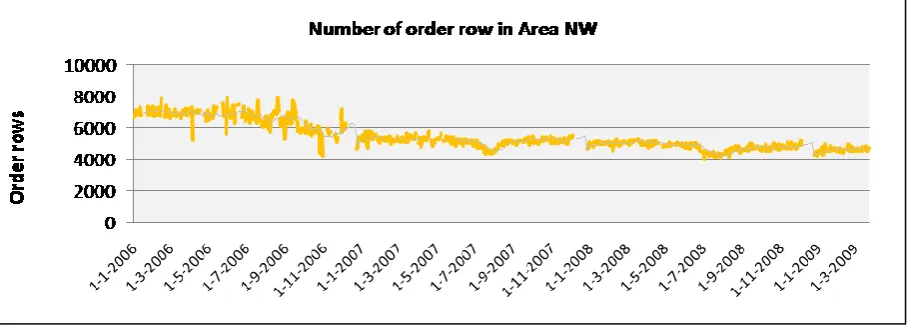
It appears that the correlation between consecutive days and weekdays is very moderate, therefore no reliable predictions on workload is possible based on these variables. Our data shows nonetheless that fluctuations in mail volume may be reduced if the mail volume of different business counters is integrated. We therefore recommend continuing the current research into centralization of business counters, especially as larger facilities also make the creation of flexibility easier
methods currently used by team managers, shows us that almost all methods are present within collection to some extent. We can distinguish methods used in case too many and too few employees are present at the work floor.
Dit rapport beschrijft een onderzoek ter afronding van de Master Industrial Engineering and Management, aan de Universiteit Twente. Het afstudeeronderzoek richt zich op de vraag hoe, binnen het bedrijfsonderdeel business balie van TNT N.V., de hoeveelheid ingezet personeel beter kan worden afgestemd op het werk dat op een avond voor handen is.
Business balies zijn locaties in Nederland waar ’s avonds post wordt verzameld, geregistreerd en opgezet alvorens het naar een sorteercentrum wordt afgevoerd. Voor de realisatie van dit proces zijn medewerkers actief op verschillende processen, aangestuurd door een teamcoach. De teamcoach is verantwoordelijk voor het inzetten van personeel en heeft tot doel het proces op tijd af te ronden.
De huidige strategie van TNT Post Nederland richt zich op het reduceren van kosten en het flexibeler maken van de kostenstructuur. Om dit te realiseren binnen de afdeling collectie is een reorganisatie gestart genaamd DPM-C. Deze reorganisatie heeft tot doel een gestandaardiseerd “best practice” proces te implementeren op alle business balies en de aansturing van het proces te verbeteren. De eerste evaluaties laten zien dat kosten reductie wordt behaald maar dat het onduidelijk is voor teamcoaches hoe zij het aantal medewerkers moeten afstemmen op de hoeveelheid werk op een avond. Om deze reden heeft het management van collectie gevraagd om een onderzoek te starten naar de dag-tot-dag planning van het aantal in te zetten medewerkers.
Het aantal in te zetten medewerkers op een business balie is afhankelijk van de hoeveelheid post en de productiviteit. Uit analyse volgt dat de hoeveelheid post die op een avond moet worden verwerkt fluctueert en kan worden benaderd met een normale verdeling. Op het aanname- en opzetproces is er gemiddeld een variantie coëfficiënt van 0,1 respectievelijk 0,2. Dit betekent dat in 30 procent van de dagen de hoeveelheid post meer dan 10 respectievelijk 20 procent van het gemiddelde afwijkt. Voor de productiviteit geldt dat alleen voor het aannameproces kan worden gemeten hoe groot deze fluctuatie is, maar uit interviews en observaties blijkt dat ook voor het opzetproces de productiviteit onzeker is. Gegeven de aanwezigheid van deze onzekerheden, onderscheiden wij in dit onderzoek twee manieren om de hoeveelheid in te zetten personeel beter af te stemmen op de hoeveelheid werk. (1) Er kunnen methoden zijn om onzekerheid te reduceren en (2) er kunnen methoden zijn om beter om te gaan met de bestaande onzekerheid.
problematisch en met de huidige data onmogelijk. We kunnen wel concluderen dat, gebaseerd op evaluaties van DPM-C, de creatie van prestatie terugkoppeling en verhoogd toezicht op de werkvloer een positief effect hebben op de reductie van productiviteitsfluctuaties.
Dit onderzoek toont dat het, gegeven de beschikbare informatie, niet mogelijk is onzekerheden op operationeel niveau te reduceren. Oplossingen moeten daarom gezocht worden in het verbeteren van de omgang met de bestaande onzekerheid.
Omgaan met onzekerheid van het aantal in te zetten mensen wordt aangeduid met arbeidsflexibiliteit. Wij constateren dat alle operationele methoden van arbeidsflexibiliteit besproken in dit onderzoek op enig manier worden toegepast binnen business balies. Situaties met te veel dan wel te weinig ingeroosterde medewerkers vragen logischerwijs een andere aanpak.
Wanneer er te weinig mensen zijn ingeroosterd wordt flexibiliteit gecreëerd door: het inzetten van mensen die op andere taken waren geroosterd, het organiseren van extra personeel op korte termijn, en het aanwezige personeel laten werken in meeruren. Op avonden dat er te veel personeel op een proces is ingeroosterd, wordt arbeidsflexibiliteit voornamelijk gecreëerd door: het vragen om vrijwillig verlof opname, het schuiven van personeel naar andere processen of het laten uitvoeren van niet tijdsafhankelijke werkzaamheden zoals onder andere de vakmanschaptoets.
In beide gevallen geldt dat het moment dat bekend wordt of er te veel of te weinig personeel aanwezig is, op zijn vroegst tijdens het proces is. Methoden kunnen dus alleen effectief zijn als ze aan het eind van het proces toepasbaar zijn.
Wij concluderen dat het reduceren van de onzekerheid over het aantal benodigde arbeidskrachten moeilijk is op operationeel niveau. Wij concluderen ook dat er verschillende methoden worden toegepast voor omvang met de aanwezige onzekerheid. Omdat de toepasbaarheid van deze methode afhankelijk is van veel lokale en unieke opstandigheden adviseren wij bevordering van kennisuitwisseling tussen teamcoaches van concreet toepasbare methoden. Tevens adviseren wij dat teamcoaches specifiek worden getraind in het creëren van verantwoordelijkheid- en groepsgevoel daar dit essentieel is voor het toepassen van de verschillende methoden.
1.
Introduction ... 1
1.1 The company TNT ... 1
1.2 The mail process ... 2
2.
Problem identification ... 4
2.1 Research motive ... 4
2.2 Problem definition and approach ... 6
2.3 Research Scope ... 9
2.4 Thesis outline ... 10
3.
Collection at TNT... 12
3.1 The organisational context ... 12
3.2 The collection process ... 15
3.3 Collection in the mail chain ... 19
3.4 Current workforce management ... 20
4.
Managing capacity under uncertainty ... 23
4.1 Planning and control in perspective ... 23
4.2 Flexibility Framework ... 30
4.3 Operational workforce capacity management ... 32
4.4 Application outlook ... 34
5.
Reducing workload uncertainty ... 36
5.1 Factors causing uncertainty ... 36
5.2 Data to assess the current fluctuations ... 42
5.3 Current fluctuations ... 44
6.
Increasing workforce flexibility ... 59
6.1 Workforce flexibility ... 59
6.2 Proactive measures to increase workforce flexibility ... 60
6.3 Reactive measures to increase workload flexibility ... 61
6.4 Required conditions ... 64
6.5 Outlook for implementation ... 66
7.
Conclusions and recommendations ... 67
7.1 Conclusions... 67
7.2 Recommendations ... 69
Reference list ... 73
FIGURE 1:OVERVIEW GENERAL MAIL PROCESS ... 3
FIGURE 2:APPROACH ON FLEXIBLE USE OF EMPLOYEES;TNO[52] ... 9
FIGURE 3:ORGANISATIONAL STRUCTURE OF COLLECTION ...14
FIGURE 4:COLLECTION PROCESS OVERVIEW ...15
FIGURE 5:PLANNING AND CONTROL REFERENCE ARCHITECTURE,ZIJM [29] ...24
FIGURE 6:PLANNING AND CONTROL FRAMEWORK;HANS ET AL [13] ...24
FIGURE 7:CONCEPTUAL FLEXIBILITY FRAMEWORK,GERWIN [12] ...31
FIGURE 8:FACTORS OF UNCERTAINTY ...37
FIGURE 9:PLOT OF THE SUM OF ALL ORDER ROWS AT BUSINESS COUNTERS IN AREA NW ...45
FIGURE 10:PLOT OF THE NUMBER OF ORDER ROWS AT A SMALL BUSINESS COUNTER ...45
FIGURE 11:PLOT OF THE NUMBER OF ORDER ROWS AT A LARGE BUSINESS COUNTER ...46
FIGURE 12:NUMBER OF ORDER ROWS AT TWO BUSINESS COUNTERS IN A HISTOGRAM PLOT ...47
FIGURE 13:NUMBER OF ORDER ROWS AT TWO BUSINESS COUNTERS IN Q-Q PLOT ...47
FIGURE 14:NUMBER OF GREY ROLL CONTAINERS AT PREPARATION PROCESS AT BUSINESS COUNTER ...48
FIGURE 15:NUMBER OF ROLL CONTAINERS IN Q-Q PLOT ...48
FIGURE 16:PRODUCTIVITY AT INTAKE PROCESS AT AVERAGE BUSINESS COUNTER ...50
FIGURE 17:CORRELATION PLOT OF MAIL VOLUME AT INTAKE PROCESS AT BCALMERE 2008 ...53
FIGURE 18:VISUALIZATION OF THE MANAGEMENT PROBLEM WHEN MATCHING WORKFORCE TO WORKLOAD ...60
FIGURE 19:COST OF FORECASTING VERSUS COST OF INACCURACY SILVER ET ALL [6] ...88
FIGURE 20:FORECASTING FRAMEWORK SILVER ET ALL [4] ...88
List of Tables
TABLE 1:READING GUIDE ...10TABLE 2:MODEL TO CATEGORIZE OPERATIONAL MEASURES TO MATCH WORKFORCE TO WORKLOAD ...33
TABLE 3:VOLUME FLUCTUATION AT THE INTAKE PROCESS AT BUSINESS COUNTERS IN AREA NW ...46
TABLE 4:VOLUME FLUCTUATION AT THE PREPARATION PROCESS AT BUSINESS COUNTERS IN AREA NW ...49
TABLE 5: PRODUCTIVITY AT INTAKE PROCESS ...50
TABLE 6:CORRELATION COEFFICIENT OF MAIL VOLUME AT INTAKE PROCESS ...53
Abbreviation / Acronym
Dutch English
BC Business Balie Business Counter
DPM-C Dynamisch Prestatie Model Collectie Dynamic Performance Model Collection Evra Elektronische Vrachtbrief Electronic cargo bill
KPI Essentiële Prestatie Indicator Key Performance Indicator MAD Met aanvullende dienst With extra service
N.V. Naamloos vennootschap public limited liability company PTT Posterijen, Telegrafie en Telefonie -
ScB Sorteercentrum Brieven Sorting Centre Mail ScP Sorteercentrum Pakketten Sorting Centre Parcels SLA Service kwaliteit afspraak Service level agreement NIMP Nieuw initiatief masterplan New Initiative Master Plans
TOT Toeslag onregelmatige werktijd Extra payment for irregular work hours
Non trivial translation
Dutch English
Aangetekende post Registered mail Afvoer lijdraad Discharge instruction Bakkenkar Bin carrier
Business balie Business counter
Inzetplanning Workforce capacity planning
Los Laad plaats (LoLa) Unload-Load-Dock Postbezorger Delivery operative Postbode Postal employee Rolcontainer Rolling container
1. Introduction
This report describes a Master graduation research into the process of matching workforce to workload at TNT business counters during the process of “collection”. Before we elaborate on this subject, we use this first chapter to introduce the reader to the company TNT and the general mail process.
1.1 The company TNT
TNT N.V. is a company that provides delivery solutions to organisations and consumers around the world. In the global transportation and distribution market, TNT participates with two divisions: Express and Mail. Together these divisions serve over 200 countries, employ some 163,000 people and TNT N.V. reports a yearly revenue of €11,152 million. [44]
The division Mail provides mail services to businesses and consumers. It is organised in four separate business units: Mail Netherlands, Spring, Cendris and European Mail Network, each focused on a different part of the mail services market. (More details on the organisational structure can be found in Appendix 1). We focus in this research on the business unit Mail Netherlands.
Mail services comprise the collection, sorting, transport and delivery of letters, direct mail, printed matter and parcels. On average, TNT Mail Netherlands processes and delivers around 16 million mail pieces per day. To perform the required collection and delivery activities at around 7 million different locations, TNT Mail Netherlands employs over 50,000 people. This makes it the biggest private employer in The Netherlands [30].
The history of TNT Mail Netherlands dates back to 1799. During this time TNT (named PTT) started as a state owned company responsible for all Dutch mail and telegraph services. During the following 211 years many radical changes to the mail process have taken place, for example the introduction of stamps, start of postal codes usage, and development of machines for the sorting process. All these changes had a major impact on the mail process and thus the company. One of the biggest changes to the organisation itself took place in 1989. That year TNT was privatised and thus no longer government owned. The history of government ownership still impacts the corporate culture today [31].
On the first of April 2009 the liberalisation of the total Dutch postal market was effectuated; a development in line with the trend of privatisation in Europe. For TNT this means that their special legal position on the Dutch market – being the only company allowed to deliver mail under 50 grams – no longer applies. With the disappearance of this monopoly, competitors are entering the market.
The increasing competition, decreasing total mail volume, ongoing reorganisations and changes of the corporate culture challenges both the TNT organisation as a whole and all its employees individually.
1.2 The mail process
Getting mail from businesses and consumers to the correct location within 24 hours is a day and night process. Within TNT this process is organized in three sequential steps: Collection, Sorting and Delivery. To get acquainted with the general mail process we briefly describe each step in this process chain.
1.2.1 Collection
Every evening, mail is collected at 58 different locations throughout the Netherlands called “business counters”. Mail arrives here through mailboxes rides, collection rides and customers themselves bringing the mail to these collection locations.
At the business counter the arriving mail is invoiced if necessary and prepared for the sorting process. This preparation includes separating mail into specific containers and placing it in the right position. The different containers are for example dedicated to: small mail, large mail and parcels.
At fixed times during the evening these containers are sent on to a sorting centre by truck.
1.2.2 Sorting
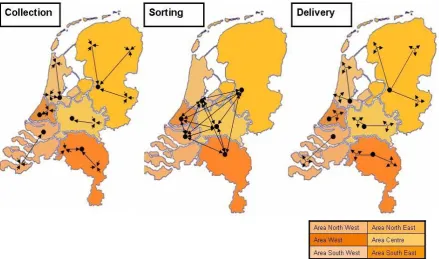
All mail from the business counters located in an area (regions defined by TNT, see Figure 1) is received at one of the sorting centres; located in Amsterdam, Zwolle, Nieuwegein, The Hague, Den Bosch and Rotterdam. During the evening the sorting process is started.
The sorting process consists of two sequential sorting stages. In the first stage all mail is sorted by area, based on the first part of the postal code. During the night this roughly sorted mail is exchanged between the sorting centres. After all mail is exchanged each sorting centre is left with mail directed to locations within its own area. This mail enters the second sorting stage.
In this second stage the mail is sorted by specific regional code, making it possible to send the mail to the delivery preparation locations present in each area. Delivery preparation locations are facilities (403 in total) located throughout the Netherlands were mail is prepared for the final delivery step.
1.2.3 Delivery
house-number-sorting machine with advertisement, mail which was too large for the machine and printed matters. Also special mail like condolence cards and registered mail is added (which arrive at the delivery preparation location by a different process). This combined mail is bundled by a rubber band and put in delivery bags. These bags now hold all mail which needs to be delivered in the right order of delivery location.
At this moment the mail is ready for distribution on foot, by bike, by car or even by boat. The delivery operatives deliver the mail into mailboxes which every business or household in the Netherlands has.
[image:17.595.80.520.317.576.2]A schematic overview of the three sub processes is given in Figure 1 and more details can be found in Appendix 2.
Figure 1: Overview General Mail Process
2. Problem identification
To identify the specific problem we want to address in this thesis, we discuss our research motive in section 2.1. Based on this motivation we introduce the problem statement in section 2.2. To divide this problem into manageable parts, we present four underlying investigative questions. For each of these questions we discuss our approach on how we intent to answer it. In the last two sections of this chapter, 2.3 and 2.4, we outline the scope of this research and provide an overview on how the remainder of this report is structured.
2.1 Research motive
The market of mail services is changing fundamentally [34; 44; 51]. The ongoing digitalisation of society, by for example internet banking, e-mail and digital invoicing, causes the total volume of the mail market to decrease. Especially in the Netherlands, where internet availability is high and usage extensive, mail volume decrease is predicted to be significant, around 6% per year [44]. The decrease in total market volume as well as the arrival of competitors, due to the liberalisation of mail services in the Netherlands, has a negative impact on mail volumes processed by TNT Mail Netherlands.
Decreasing mail volumes impose a challenge to the TNT Mail organisation as revenues are related to the processed volume. To counter the volume decrease new products are developed to achieve competitive advantages, and TNT is entering new and emerging markets for growth [30; 32; 44]. Still, it remains clear that cost reduction is inevitable for TNT Mail Netherlands to cope with the current volume developments. The strategy of TNT Mail Netherlands therefore aims at structural cost reduction in all processes and the creation of a more flexible cost structure to let cost develop in accordance with income (see appendix 3). The business unit Mail Netherlands is organized in two divisions; Production and Commerce. Commerce is responsible for marketing and sales of mail (related) products, production is responsible for the physical processing of mail. Moreover, the division Production is organized into different departments, amongst others, one for each mail process step: collection, sorting and delivery (see appendix 1). Each of these departments has its own budget and targets with regard to costs reduction and flexibility of the cost structure. Our research is focused on the department collection.
be postponed by lower management. For them, any budget saved “extra” this year will be deducted from the budget next year, making it more difficult to achieve the targets then. With TNT’s focus on flexibility of the cost structure, budget control is no longer appropriate. Furthermore a research was initiated in 2007 on workforce efficiency at business counters. The resulting confidential internal report [37] indicates that efficiency increase can be expected with improvement of process management (see appendix 10).
For these reasons, management at collection indicated business counters as an interesting place to look for possible cost reductions and improvements in flexibility of the cost structure. Therefore, in 2007, a reorganisation was started at business counters called “Dynamic Performance Model Collection” (DPM-C). The goal of this reorganisation was to:
1. Ensure all business counters work physically in the same ”best practice” manner.
2. Develop process management instead of the current budget management to ensure all business counters perform as good as possible with respect to traffic dependent cost in this new standardized situation.
The first step of this reorganisation focuses on standardization of how the work floor is organised. The procedures at all business counters are standardized by prescribing in detail which tasks should be performed, how they should be performed and which tools may be used. Although some standard operations procedures were already available before the introduction of DPM-C, variations between locations still existed. This was mainly caused by difference of interpretation or deliberate reshaping of the process to fit personal preferences and local circumstances. The first part of DPM-C thus re-writes all procedures to a best-practice situation and then makes sure it is implemented at all locations. This implementation is done under supervision of Business Counter Change managers to insure no local variations arise.
needed on a specific evening. Although this is mentioned in the DPM-C documents as something that should be developed, for now, team managers have the difficult task to schedule workforce on experience and gut feeling. And even if these predictions of required workforce would be available, an overview of how a team manager has to act on this information is lacking. The evaluations show the task of adjusting the workforce is far from trivial for team managers due to fixed work time arrangements, collective labour agreements and other restrictions [39; 40; 41]. Therefore management at collection has asked to perform a research into this subject.
2.2 Problem definition and approach
In this section we introduce the problem statement and discuss our approach to solve it.
2.2.1 Problem statement
As described in the research motive, management at TNT Collection wants to increase insights on how team managers can improve the match of workforce to workload at business counters on a day-to-day level. Based on the above stated inducement for this research, we formulate the following problem statement:
How could the day-to-day process of matching workforce to workload be improved at TNT business counters?
To solve the stated problem we unravel it into separate easier-to-answer questions in the next section, the so-called investigative questions [1]. These questions are formulated such that we can answer them separately and combine the answers to find a solution for the stated problem. For each question we also describe a detailed approach on how we intend to answer it. This results in a step by step plan to execute the research.
2.2.2 Investigative questions and approach
We start our research process by acquiring a general overview of TNT Mail Netherlands. In our view it is essential for a successful business research to be aware of the general organisational goals, processes and corporate culture. We acquire this understanding by interviewing employees at the head office, the area offices and on the work floor. Also desk research on general TNT documents (for example the year report and employee introduction documents) and observations in all the major processes increase our understanding of the context of this research. Against this background, we focus specifically on the collection department. To find an answer to the stated problem, it is important that we thoroughly understand the collection process at business counters. Therefore we formulate the first investigative question as:
1. How is collection organized within TNT?
To acquire this knowledge, we study internal reports and schematic representations concerning the collection organisation and processes. Next we interview senior collection support employees and work floor management (team managers and collection-region managers) to confirm whether the descriptions in the documents are a valid representation of the process in reality. Also insights in processes not fully documented (for example the workforce planning process) result from these interviews. Chapter 3 presents an overview of the collected information.
With a sound understanding of the current situation we proceed by gaining insight on how to match workforce to workload. We do so by answering the question:
2. How can workforce be matched to workload according to literature?
Matching capacity to demand is discussed widely in literature and comprises many subjects and levels of detail. To clearly position this research within this wide area, we conduct a literature study to provide a positioning framework on planning and control. Within this framework we zoom in on the subject of resource capacity planning on operational level as this is the research area concerned with daily matching capacity to demand. In literature, resource capacity planning and control (also known as resource capacity management) describes the process of avoiding idle capacity with the goal of attending to demand in time and in the most efficient way [7]. Resource capacity management at business counters mainly consists of workforce capacity management as employees are basically the only resource used in the process. Therefore the most efficient way of matching workforce to demand depends logically on the balance between overstaffing (wasting resources) and understaffing (influencing quality) effects [19].
Workforce capacity management would not be difficult in a fully certain and non variable environment. Unfortunately the real world has inevitable environmental uncertainty. Coping with this uncertainty is addressed by the subject of flexibility. A theoretical view on the relation between environmental uncertainty and the possibilities of operational workforce flexibility provides the basis for this research. We study specific literature on the subjects within the framework, to create a comprehensive understanding. Chapter 4 will depict our findings.
We use the structure found in literature to focus on the specific situation at TNT by answering the question:
3. What is the workforce flexibility requirement at TNT business counters?
a. Which factors create uncertainty?
b. How big is the fluctuation of these factors?
c. Can the uncertainty of the factors be reduced and how?
we determine the influential factors and model their relation to workload uncertainty. Then we determine the availability of data sources. For data sources that are available, we will investigate the fluctuation and uncertainty of the specific factors. Comparison of this data driven information with expert knowledge (team managers and managers), will indicate whether we can assume the results to be valid and credible.
When the uncertainty of different factors is known, we investigate how to reduce or eliminate these influences with measures on operational level. We do not intend to uncover all possibilities, and will focus on the possibility to forecast day-to-day demand, as this is a specific interest of collection management.
We know in advance that by definition not all uncertainty in workforce requirement can be eliminated. Therefore the last part of this research covers the following question.
4. How can a team manager create workforce flexibility at TNT business counters to cope with workload uncertainty?
The last step in this research, presented in chapter 6, addresses the problem of how to cope with the inevitable remaining uncertainty in the required amount of workforce. Team managers need a clear overview of tools and measures available to cope with this uncertainty. Creating and using workforce flexibility yields the way in which team managers can achieve their performance goals.
As this is no exact science, we use expert interviews to uncover best practices currently used within TNT. We do not have time and resources to interview all team managers, thus we select the team managers suggested by Area collection managers. In problem centred interviews [28] we uncover which workforce flexibility methods found in literature, are currently used by team managers to cope with too many or too few employees present during the process.
Answering all the investigative questions separately and combining the answers, results in a sound answer to the problem statement. We present this answer in the concluding chapter 7. This answer provides insight in matching workforce to workload at business counters and an overview of applicable measures for team managers to create flexibility.
The approach our research takes on solving the research problem correlates with the first two steps in the “approach on flexible use of employees” suggested by TNO [52] (Figure 2). Their approach also shows the steps ‘determining the difference’, ‘implementation plan’, ‘implementation’ and ‘evaluation’ are needed. We agree that these steps should be performed but as they concern actions for specific facilities, these steps are outside the scope of this research. Implementation is thus not part of this research.
Figure 2: Approach on Flexible Use of Employees; TNO [52]
2.3 Research Scope
This research is concerned with workforce capacity management at business counters. To confine this research to its topic and prevent broadening the research at every step, some assumptions are made and boundaries defined.
The question whether the standardized work procedures, tools and work floor layout, as prescribed by DMP-C, are optimal or best practice is not part of this research. We will consider the prescribed standard situation as fixed. Improvement suggestions for specific situations might exist but adjustments to the standard situation are part of other projects. Another topic which falls outside the scope of this research is determining the work time norms for specific tasks. As the accuracy levels of these norms are questioned by management and employees we are aware of the uncertainty in the correctness of the norm. Still we will not undertake action to adjust them. Currently other studies into this subject are preformed within TNT.
During the start of the DPM-C implementation all rides at a business counter are rescheduled to improve the planning. The routing of these vehicles is planned in a combined effort of collection team managers and transport advisors. Expert knowledge and the software package Win-route are used to create schedules that do not violate: pickup time windows, driver and car restriction and take into account maximum capacity and time of return. These restrictions make it a complex process. A trade off has to be made between efficiency of rides and the desire to have mail at the business counter as early as possible to give a team manager more time for processing. Although the outcome of this process effects the available processing time and thus the planning process, improvement of this process is outside the scope of this research.
Although the process at business counters consists of several different process steps we will focus our data analysis on two specific steps: intake and preparation. These two processes account for some 74 % of workforce usage [37]. The other processes account for the remaining 26%, but as they are more difficult to study (due to data absence and greater variation between facilities) as well because of their limited size, we leave them outside our research scope.
With the scope defined we present the thesis outline in the next section.
2.4 Thesis outline
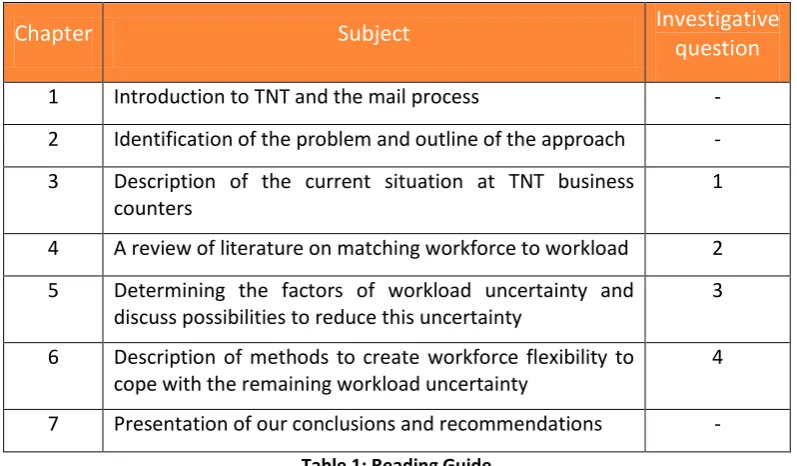
The structure of this thesis is based on the step by step plan presented in the research approach where each investigative question is answered in a different chapter. A structured overview of this thesis is presented in Table 1.
Chapter Subject Investigative
question
1 Introduction to TNT and the mail process -
2 Identification of the problem and outline of the approach -
3 Description of the current situation at TNT business counters
1
4 A review of literature on matching workforce to workload 2
5 Determining the factors of workload uncertainty and discuss possibilities to reduce this uncertainty
3
6 Description of methods to create workforce flexibility to cope with the remaining workload uncertainty
4
[image:24.595.99.498.456.689.2]7 Presentation of our conclusions and recommendations -
Table 1: Reading Guide
importance to this research, in detail. Chapter 5 addresses the third investigative question aimed at workload uncertainty. In this chapter we discuss the workforce uncertainty based on the variability of different factors. Furthermore methods to reduce this uncertainty are presented. The last investigative question about the different possibilities to create workforce flexibility is addressed in chapter 6. Chapter 7 is used to present the conclusions of this research and provides recommendations for future research.
With the problem statement, research approach, research scope and thesis outline discussed in this chapter we proceed to chapter 3.
Chapter summary:
3. Collection at TNT
As indicated in the research approach, we are in need of a thorough understanding of collection at TNT. We therefore begin this chapter by addressing the organisational context of collection in section 3.1. In section 3.2, we zoom in on the collection process taking place at business counters, and discuss each sub process in detail. To further comprehend the context of collection we describe its relation to other processes within TNT in section 3.3. In the last section of this chapter we discuss the current process of matching workforce to workload, as this gives us an overview of the current situation we want to improve.
3.1 The organisational context
To create insight in the organisational context of the collection department we provide a brief historical perspective, followed by an overview of collection’s function and structure.
3.1.1 Historical perspective on collection
Up until a reorganisation called NewCo in 2006, collection of mail was organised within the department delivery. Due to the limited size of the collection process (in terms of expenses and personnel) in comparison to the delivery process, not much attention was paid to efficiency and improvement opportunities. Also, the fact that collection is the first step in the sequential mail process, led to a common perception that trying to achieve cost reduction at collection could negatively influence the performance of the other steps in the mail chain. Possibilities to achieve savings were therefore not often considered.
The reorganisation NewCo in 2006 changed this situation by the creation of a specific department for collection, separated from delivery. This new collection department had its own function, organisation and goals [38]. Cost savings and increase efficiency became specific targets for collection management and thus received increased attention.
3.1.2 The function of Collection
The department collection fulfils two important functions within the mail process, namely: Order to Cash (O2C)
Collect to Deliver (C2D)
The second function of collection is Collect to Deliver. Collect to Deliver comprises the function to get the mail from customers via the business counter to the sorting centre in “the right condition”, at “the right time” and in “the right way”.
“The right condition” indicates the need to prepare mail according to a specific discharge instruction. A sorting machines can only handle specific mail sizes and only when made available in specific TNT containers. Mail from customers thus needs to be pre-processed by employees at collection to let the mail comply with these specific instructions. “The right time” indicates the need to retrieve mail from the customer within the time windows agreed on by contract as well as making sure the mail arrives at the sorting centre on time. Finally, “The right way” involves amongst others: a respectful and cooperative attitude towards stakeholders, a professional TNT look of employees and equipment, and safe and environmentally responsible behaviour. Working in “the right way” is stimulated by different projects in line with the TNT Mail wide Customer Focus project.
The specific way in which collection fulfils its functions is of course subjected to change. When the collection department was created, the function was based on the collection processes at that time. But during the reorganisation in 2006 it was already suggested that research into fundamental changes in the process could yield interesting cost reductions. Projects (for example Greenfield [46]), have since then been started to explore fundamental changes to the collection process. Suggestions like the centralisation of business counters and collection in bins are explored in more detail at this moment and could change collection in the upcoming years. Even bigger changes like automation of the preparation process and invoicing by the sorting machine are mentioned as possible future developments to change the function of collection fundamentally within TNT. But as these developments towards a new situation are still uncertain at TNT, we consider the current situation and function of collection in this thesis.
3.1.3 Organisational strategy
The strategy directing collection is logically related to the strategy of the business unit Production and TNT Mail Netherlands as a whole. TNT Mail Netherlands has used the value disciplines of Treacy and Wiersema to focus their strategy on operational excellence and customer intimacy (See appendix 3).
Based on these principles, the business unit Production formulated their strategy as:
Retain current margins and profit in the Dutch market by: creating a flexible cost structure to cope with volume decrease and providing new services with which customers can achieve cost reduction [43].
3.1.4 Organizational Structure of collection
In Appendix 1, a description of the organisational structure of TNT as a whole can be found as well as details on the position of collection within this structure. In this section we will discuss the internal structure of the department collection.
Collection is, in line with Mail Netherlands, organised around the principle: centralized governance, decentralized execution. This means that policies are developed at the head office and execution of these policies is organised per area.
The department collection comprises employees at 58 Business counters, 250 business points (located across the Netherlands) and staff at the six area offices and head office. Drivers performing collection rides are also part of the collection organisation. In total this adds up to more than 4500 persons (the majority part-time employed).
Between 10 and 100 people work at a business counter. Employees at these facilities perform tasks like: intake, preparation or internal transport (see section 3.2). Each business counter is managed by 1 or 2 team managers. Team managers are responsible for the organisation at their business counter. Their tasks include scheduling of personnel, problem solving during the process and work hour registration. They are responsible for realizing the targets on cost and quality with all employees at their location [42].
Different business counters located near each other form a collection region. Each collection region has a collection region manager being the direct supervisor of all the team managers in that region. 18 of such collection regions exist.
Collection Area Manager
Team Manager
Employee Collection Manager
Collection Region Manager Collection Area
Manager
Collection Region Manager
Collection Region Manager
Team Manager Team Manager
Employee Employee
[image:28.595.155.441.435.699.2]Collection Area Manager
All collection regions in one area fall under the responsibility of the area manager collection. There are 6 area managers collection, one for each area, and they have a support staff at the area office. Finally there is one general collection manager at the head office, supported by senior collection advisors. An overview is given in Figure 3 and a detailed overview of the specific tasks for each function can be found in TNT documentation [42].
With the organisational context and structure in mind we focus next on the specific collection process steps which take place at the business counters.
3.2 The collection process
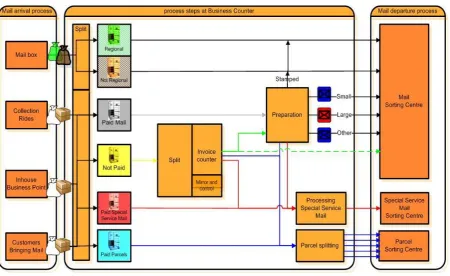
[image:29.595.75.526.325.601.2]In this section we describe in detail the process steps executed at a business counter to get the mail from the customer to the sorting centre. We start by a description of the four ways in which mail can be collected and arrive at the business counters. Next we present in detail the process steps: split, registration and preparation. An overview of the processes is given in Figure 4.
Figure 4: Collection Process Overview
3.2.1 Mail arrival process
Mailboxes are probably the most widely known channel through which TNT collects mail. Somewhat surprising to most people is that only about 8 percent of all mail is collected through mailboxes. TNT has approximately 20,000 orange mailboxes scattered across The Netherlands. All mailboxes are emptied every day (mostly) between 17:00 and 19.00 hours, depending on their position on the pickup list. When a mailbox is emptied the mail is collected in one of two bags: region mail (green bag) and outside regional mail (brown bag); corresponding with the two intake holes of a mailbox. The bags are closed, labelled and brought to the business counter. Drivers who deliver the collected mail from mailboxes are obliged to separate the bags into two roll containers: the roll container for ‘mailbox regional mail’ (white/green) and the roll container for ‘mailbox other regions mail’ (white/brown). The colour between the brackets indicates the colour of the label on the rolling container. The second way in which mail arrives at business counters is through collection rides by TNT employees or subcontractors. These collection rides are dedicated planned rides to collect mail at customers or TNT service points (for example postal offices or TNT concept stores or business points). Collection rides have time windows in which they have to collect mail at a specific location. Mail collected during these collection rides at almost 15.000 different location in the Netherlands can contain pre paid mail, unpaid mail, parcels (paid and not paid) and special service mail (paid and not paid). Drivers returning from a collection ride are obliged to separate the mail they collected into 4 different roll containers: Paid Special services (red), Paid Parcels (blue), Other Paid mail (grey) and Not paid mail (yellow).
A third way in which mail arrives at business counters is by customers bringing mail themselves. As this is almost exclusively done by customers with large amounts of mail and contracts about preannouncements and special delivery agreements, this normally only occurs at a business counter located at the sorting centre. Furthermore the special delivery requirements result in the fact that no additional processing steps are required aside from invoicing by weighing and possibly cross docking into new containers.
The last way in which mail can arrive at business counters is via the in-house business point. This is processed in the same way as mail from collection rides; thus separated into 4 different containers at the load-unload dock.
When mail has arrived at the business counter‘s load-unload dock and is placed in one of the six containers discussed, the next step is started.
3.2.2 Mail processing steps
The process steps taking place within the business counters are discussed next.
3.2.2.1
Stream splitting
accounting system prescribing process clarity). This is very important and strictly implemented because containers with unpaid mail should never be mistaken for paid mail and processed accordingly, as this would result in failure of the function Order to Cash and thus loss of income.
The white/green and white/brown labelled containers, containing “regional” and “other regions” mailbox mail respectively , do not need processing at the business counters. This mail will be handled by a machine at the sorting centre called ‘SOSMA’. Therefore the only handling at the business counter is to aggregate the labelled bags in roll containers and position those on the load-dock to be picked up by a truck transporting them to the sorting centre.
All the blue labelled containers, containing paid parcels, are transported to the parcel preparation area, which is most of the time positioned directly next to or on the load dock. Here the parcels are split into 6 different roll containers according to the specific discharge instruction of the Sorting Centre Parcel (ScP).
All the red labelled containers, containing paid special services mail, are transported to the secure special services room where each mail piece is registered. All special services mail is put into a sealed roll container and sent to a secure sorting centre located in Arnhem. Also mourn letters are handled in this special room, only they are not sent to Arnhem but put into an special “envopack” and passed on to the regular sorting centre where they handle this “envopack” in a separated process.
The grey labelled containers, containing all paid mail, are brought to the preparation area. Here these containers are placed in a buffer area, which is indicated by lines on the floor, where they are positioned until they can be processed.
Finally the yellow labelled containers, containing all not paid mail, are brought to the order splitting area.
3.2.2.2
Order splitting
All yellow containers with mail which needs to be invoiced are placed in the buffer for order splitting. Mail arriving here should contain an order form as customers are obliged to include such a form if their mail needs to be invoiced. The orders are split per order row to make registration at the counter easy and efficient. If an order form is missing the order is put aside and the form is looked for or created after contact with customer service or the customer.
All split orders are handed over to the registration counters.
3.2.2.3
Registration
checked, meaning they will be counted, weighed and registered again to fully check if the order form is 100% correct. If weight difference is detected a weight check is performed by a different employee on a different counter to make sure no mistake was made. The computer also checks whether a customer has payment problems or other reasons why mail should not be sent. If such a situation occurs the mail is put aside in the roll container labelled “bounced” until contact with the pre-and after sales departments has confirmed what to do. All mail that has been invoiced correctly is placed into one of the roll containers behind the counter (being: paid mail regular 24 hour, paid mail 48 hour, paid parcels or paid special mail). Internal transport will now take these containers to the correct location.
3.2.2.4
Mail Preparation
All 24 hour regular mail (first) and 48 hours mail (last) containers at the intake process are transported to the preparation area and are labelled “green mail”. Mail arriving direct from the load-unload platform is called “grey mail”. Although the processing required at the preparation area is similar, the green mail is normally somewhat “easier” to process as it contains more grouped mail on average. Therefore grey and green mail are processed separately.
When the mail arrives at the preparation area, an employee picks it up by a lifting machine and dumps it onto a conveyer belt or a table, depending on the availability of these tools. From here the preparation employees pick up the mail and place it in a specific position in a specific bin. There are 6 different bins for respectively: large mail, small mail, bounced mail, bus-parcels own area, bus-parcels other areas and stamp mail. The employees pick up each mail piece and judge on the size, franking and postal code in with container it should be placed. They then place it in the correct container with the address in the upright position. Full bins are places on a bin carrier, ready for shipment.
3.2.2.5
Expedition
All mail which is ready for departure is put together and made ready for shipment by the expedition employee. This includes volume registration in the computer, and checking if all bins are stacked properly on the bin carriers.
Mail which is invoiced, prepared and stored in specific roll containers or bin carriers at the load-unload dock can be place in the truck(s). Truck drivers will fill their trucks on specific times during the night and drive to the sorting centre.
3.3 Collection in the mail chain
As Collection is just one step in the process of getting mail from the sender to the receiver we will discuss the connections business counters have with other departments.
3.3.1 The Pre- and After Sales department (PAS)
TNT tries to make sure that customers consider sending mail as being easy. So when customers hand in their mail not according to standards, the mail is most of the time still accepted. During interviews we learned that the Pre and After Sales department (PAS) is not eager to ask customers to change their sending behaviour as this may impact their experience of “the ease of sending”.
Incorrectly submitted mail however impacts the processes at business counters because the input becomes more variable. When such problems occur at business counters, the team manager seeks contact with the PAS department and tries to solve the problems in close dialogue. Contact is also made with the PAS department when wrong account numbers are mentioned on the intake form or when complains of customers occur.
3.3.2 Transport
Transport is the department which connects the business counters with the rest of the mail chain. Service Level Agreements (SLA’s) exist, which state at what time trucks arrive and what quantity they should be able to take to the sorting centre. Transport has its own SLA’s with other departments and contractors’ thus trucks cannot wait if the process finishes too late. It sometimes happens that the process at a business counter finishes 10 minutes late. This can result in the situation where the transport truck has left with all mail which was ready at the contracted time and some mail is left at the business counters. In that situation the team managers needs to arrange a car or truck from transport to come and pick up the remaining mail as fast as possible. Understandably this can result in a very costly process.
3.3.3 Sorting
3.4 Current workforce management
Team managers are responsible for managing personnel at their business counter. This includes tasks in recruitment, planning, control and administration. Many of the team managers have already been employed for a long time, which means they carry out their tasks with routine and mostly based on experience.
3.4.1 Workforce planning
At every business counter there is a group of employees who work according to a work schedule in accordance with their contracts. The task of the team manager it to adapt the work schedule to changes in employee availability and workload fluctuations. Examples of changes in availability of employees are: employees preferring to switch shifts, employees desiring vacation leave or employees calling in sick. Other kinds of leave such as compulsory training also need to be taken into account. Moreover, the amount of work fluctuates due to for example lower mail activity during vacations, special advertisement campaigns, local events like festivals, and the individual choices of customers to send mail on a specific day. The work schedule for the upcoming week is constructed the week before and is normally based on the schedule of the previous week modified with the known disruptions. But how much mail will arrive at a business counter on every evening next week is not known exactly. Some experienced team managers indicate they do know to some extent, if more or less mail can be expected. This expectation is based on a feeling for trends or the awareness of unique events. Example are: “the Monday is always more busy than the Wednesday” and “next week there will be less mail because of the fun fair in the nearby village”.
To change the work schedule team managers have their own way of processing the available information. In general no algorithms or automated systematic approaches are used to switch or add shifts; most managers use common sense, personal excel sheets and close dialogues with their employees in order to come to adjustments in the work schedule. As switching depends highly on flexibility of employees and detailed knowledge on personnel characteristics and because of the limited size of the problem, this common sense and dialogue approach is perceived sufficient.
Switching shifts of employees in the work schedule might result in violations of for example Collective Labour Agreements (CLA). These violations are automatically detected when such a switch is registered in the hour registration system: Harmony. Most team managers solve such violations by continuing to swift and hope one schedule is allowed (trial and error) or team managers let employees switch shifts without registration if no payment difference occurs.
3.4.1.1
Changes with DPM-C
The planning process at a business counter changes when DPM-C is rolled out because of two things. First, the basic schedule and thus all contracts are changed based on measurements of the average amount of mail per weekday (over 42 weeks) and standard efficiency norms. This new basis schedule is put in Harmony, the software package for work time administration, and serves as the standard situation. With the adjustments to the contracts team managers do not encounter the problem anymore of having too many people under contract. Unfortunately, this is only a 1 time fix to a problem which will reoccur in the future due to decreasing volumes. Though, the efficiency measurements will indicate if such a situation is arising. Secondly feedback on efficiency is introduced. Team managers receive on a daily basis how they performed the previous day. This feedback is intended to stimulate the team manager and direct him or her to schedule the amount of workforce better, thus having less over or under capacity.
3.4.2 Workforce control
When the planning is made, disruptions still occur. A team manager thus has to manage these disruptions to cope with them in an effective and efficient way. How a team manager does this depends on many factors. For example, if an employee becomes sick and needs to leave the process, a team manager might arrange an extra employee, ask the remaining employees to work overtime or switch employees between different processes. The specific way a team manager is used to handle in such situations depends on experience, personal preference and routine. Also the specific characteristics of employees and the business counter’s location influence the applicability of measures. Therefore coping with disruptions is done differently at different business counters.
3.4.2.1
Changes with DPM-C
The workforce control at a business counter changes when DPM-C is implemented. First of all the layout of the process is changed to create a more synoptic process. This increase in overview intends to help team managers assess the current situation and decide if action is needed. Also the introduction of process bulletin boards showing the productivity during the process should increase the ability to assess the current situation. Secondly the control function of team managers is developed by specific training on process steering. This can help the team manager to calculate with the current rate and the amount of mail present in the buffer, how much time is needed to process the remaining mail. We will address this topic in more detail in chapter 6.
3.4.3 Workforce administration
Harmony also indicates the availability of leave hours and needed action in case a person is sick for a long period of time.
3.4.4 Workforce planning restrictions
Personnel should always be scheduled within the rules of the law, the collective labour agreement, possible local rules, personal contracts and most favourably in mutual agreement. Collection is an organisation with many part-time workers. Therefore schedules are generally compliant with the laws concerning maximum work hours. If violations of the law do take place, they are mostly concerned with exceeding the maximum amount of work in overtime, and are corrected. Restrictions of the CLA are for example concerned with the minimal duration of a shift and the maximum of hours worked in overtime which can be exchanged for leave. Also personal contracts stating the minimum amount of hours to work in a month need to be taken into account by team managers when adjusting the planning. Fortunately the work time registration application Harmony automatically checks schedules for their appliance to these rules. And Harmony also automatically calculates the amount of extra payment (for working irregular hours) employees are entitled to. For team managers it is important to know these rules and to take them into account when adjusting the schedules as for example, extra payment for working irregular hours only occurs if an employee works after 19.00 hours. So letting an employee finish its shift at 19.00 instead of 19.15 implies a lot less extra costs.
3.4.5 Summary of current workforce planning
Workforce planning at business counters is currently done by creation of a base schedule (based on average mail volumes per weekday) and then manually adjustment for known disruptions in advance and unknown disruptions during the process. As there is no structured way of predicting how much workforce will be required other than the average in the basic schedule, team managers adjust this (if at all), on experience and gut feeling. It has not been documented at TNT how to cope with disruptions during the process. Hence differences are observed at each business counter.
In this chapter we have described the processes at business counters, their position within TNT and the current methodology how workforce is matched to workload. In the next chapter we provide a literature overview of the topic of matching workforce to workload.
Chapter summary:
4. Managing capacity under uncertainty
In the previous chapter we addressed the first investigative question by providing an overview of the collection organisation and processes. In this chapter we discuss the second step in our approach, thus addressing the question how matching workforce to workload is discussed in literature.
In section 4.1 we provide a literature framework with which we place matching capacity to demand in a broad research perspective. Since coping with uncertainty is at the heart of this matching process, we introduce a framework on this subject (addressed as Flexibility) in section 4.2. Specific literature on our topic is discussed in section 4.3. We conclude this chapter with a roadmap in section 4.4 on using the literature to address the problem we defined in chapter 2.
4.1 Planning and control in perspective
A quick scan of literature on the topic of matching capacity to demand learns it is a broad research subject discussed widely, and often in manufacturing settings. For this reason we start by presenting a high level framework on planning and control to create an overview of topics, terminology and relations between research areas.
4.1.1 Introduction to planning and control
Globalization, ongoing developments in (information) technology and increasing competition have led to an increasing awareness by management about the importance of system performance. System performance does not only address efficiency and costs, but also aspects of product and process quality, flexibility and speed [29]. Unfortunately, improving system performance is, most of the time, not an easy task.
This increase of management awareness caused the scientific community to pay a lot of attention to advancements in system planning and control. According to Zijm, all approaches in planning and control have in common “that they attempt to increase process capabilities, to support planning and control, or to diminish the planning and control complexity” [29]. Because of the widely acknowledged importance, the literature on planning and control has nowadays become broad, vast and incorporates different levels of detail. To create an overview in this field of research, several planning and control frameworks have been introduced.
4.1.2 Planning and Control Framework
Figure 5: Planning and Control Reference Architecture, Zijm [29]
[image:38.595.94.503.421.627.2]A framework introduced by Hans et al [13] elaborates on the framework of Zijm and other hierarchical production planning and control frameworks, to create the framework shown in Figure 6. This framework distinguishes functional planning areas and hierarchical levels more explicitly then the framework of Zijm.
Figure 6: Planning and Control Framework; Hans et al [13]
As we focus in this thesis on how to plan capacity to match demand we learn from these frameworks that we should confine ourselves to the research area of resource capacity planning and control but be aware of the interdependency with other areas.
solutions for relatively simple problems, and not addressed more realistic problems. In real life it is never the case that conditions like perfectly predictable demand and unlimited production capacity are met. And as managers do not have the possibility to leave uncertain variables out of their day-to-day processes, these early developed methods gained limited credibility under managers. On the positive side, Zijm justly states that applying ‘simple’ methods can lead to a less complex system or better understanding of the processes and products [29].
In essence both Zijm and Hans et al. conclude that coping with uncertainties at different hierarchical levels is at the heart of planning and control. Hans et al emphasised this by explicitly stating uncertainties at the different hierarchical levels. Zijm pointed out in his framework that for each module, methods would be needed that explicitly address uncertainty. Since 2000 the literature on models for production planning under uncertainty is growing fast. The literature review by Mula et al [21] provides an overview per production planning area (comparable to those proposed by Zijm) and per modelling approach, illustrating the extensive research on these topics.
TNT example: An example of interdependency between decisions on different areas within TNT is the possible introduction of a new sorting and preparation machine (SOSMA). As this machine would be able to handle both small and large mail, the process would be changed. But a process change like this would have a major effect on the required resources and thus process planning at business counters.
In summary we conclude that the framework in figure 5 shows us that different areas of research are concerned with planning and control and that they interact. Hans et al. introduces a way to explicitly divide research areas and hierarchical levels. We use this division in this thesis to focus on resource capacity planning as this is the topic of interest for matching capacity to demand.
4.1.3 Resource Capacity Planning
In literature resource capacity planning (also referred to as resource capacity management) describes the process of avoiding idle capacity with the goal of attending to demand in time and in the most efficient way [7]. According to Adenso-Diaz et al. [7] the problem of capacity management is one of the most difficult to tackle in business management.
As Hans et al. [13] distinguished different hierarchical levels within resource capacity planning, we will address resource capacity planning at each of these hierarchical levels. It is important to understand that decisions on higher hierarchal levels are needed earlier in time and are based on more uncertain information but do create restrictions within which the lower levels need to operate.
4.1.3.1
Strategic capacity planning
far from straightforward. Still decisions are needed as for example plans for new buildings or long-term employee training programs take a long time to implement.
Often historic data is used to make a prediction about the future by extrapolation of trends. Scenario building is also a technique used i
![Figure 2: Approach on Flexible Use of Employees; TNO [52]](https://thumb-us.123doks.com/thumbv2/123dok_us/1206669.644226/23.595.142.453.80.351/figure-approach-flexible-use-employees-tno.webp)

![Figure 5: Planning and Control Reference Architecture, Zijm [29]](https://thumb-us.123doks.com/thumbv2/123dok_us/1206669.644226/38.595.141.456.84.324/figure-planning-control-reference-architecture-zijm.webp)
![Figure 7: Conceptual Flexibility Framework, Gerwin [12]](https://thumb-us.123doks.com/thumbv2/123dok_us/1206669.644226/45.595.112.484.85.291/figure-conceptual-flexibility-framework-gerwin.webp)