ISSN Print: 2164-5167
Difference on Capital Allocation and Operating
Performance—Evidence from China Listed
Companies
Jianfeng Zhao
School of Economics and Management, Shanxi University, Taiyuan, China
Abstract
The neoclassical theory of investment has been developed to explain, in a perfect market, the investment decision of a company depends on the net present value of a project, and its expenditure is determined only by the set of investment opportunities, and independent of other factors. However, in re-ality, other factors influence investment mostly. For the full sample of China listed companies, capital allocation is consistent with operating performance. Controlling property rights of the enterprises, we show that various kinds of investments in state-owned listed companies are inconsistent with operating performance, but non-state-owned listed companies reflect effective invest-ment. In the long run, deepening classified reform of state-owned enterprises is extremely demanded.
Keywords
Capital Allocation, Operating Performance, Classified Reform
1. Introduction
In recent years, China economic growth has shifted and decreased, and the gov-ernment and enterprises gradually have realized that investment as the most important factor plays a “double-edged sword” effecting economic growth. In-vestment forms current demand, driving the current economic development, and constitutes future supply ability, affecting economic growth and economic structure. In other words, investment promotes economic development through short-term demand effect and long-term supply effect together, otherwise the simple pursuit model of investment scale to expand demand growth must high-light the dual problems of investment path dependence and economic growth How to cite this paper: Zhao, J.F. (2018)
Difference on Capital Allocation and Op-erating Performance—Evidence from Chi-na Listed Companies. American JourChi-nal of Industrial and Business Management, 8, 2200-2208.
https://doi.org/10.4236/ajibm.2018.811147
Received: October 25, 2018 Accepted: November 19, 2018 Published: November 22, 2018
Copyright © 2018 by author and Scientific Research Publishing Inc. This work is licensed under the Creative Commons Attribution International License (CC BY 4.0).
http://creativecommons.org/licenses/by/4.0/ Open Access
quality predicament (Hao Ying, et al., 2014) [1]. Reasoningly understanding and correctly utilizing the supply effect of investment is particularly important in the current supply-side reform, and is also the path to China economic growth by investment in New Normal.
Enterprises are the main body of investment behavior. Supply effect of in-vestment is the output effect of enterprise inin-vestment on macro-economy, and promotes the long-term growth of the national economy from multi-level wave transmission modes. The supply effect of investment is an economic concept with rich connotation and needs a normative value judgment. The core of the value judgment is to ensure high quality and effective future supply of invest-ment projects with operating performance constraints. In China, under new backgrounds of national development strategy, the relationship between enter-prise investment differences and operating performance becomes one of the important topics for further study. So is the supply effect of Chinese investment on economy positive or negative? Are Chinese enterprises investments high in quality? The paper analyses Chinese enterprises’ investments and performance deeply, then finds problems and countermeasures in terms of theory and prac-tice.
The paper proceeds as follows. Section 2 presents our theory of investment and research design. Section 3 presents full-sample results, and Section 4 com-pares results across different types of firms, and Section 5 concludes.
2. Theoretical Analysis and Research Design
2.1. Decision Criteria for Capital Allocation
In a perfect market, the investment decision of a company depends on the net present value of a project, and its expenditure is determined only by investment opportunity sets, and independent of other factors (Modigliani and Mille, 1958)
[2]. Hayashi (1982) theoretically proved that under the assumption of perfect market, the optimal capital expenditure of a company is the function of marginal Q [3]. It has also been the judgment of project investing in corporate financial theory, namely when making investment decisions, expected future cash flows should be discounted at the capital cost of the project, and the discount rate de-pends on size of the project, future cash flows and its risk. Only when the project in the future can provide sustained, stable and realistic cash flows, after actual execution the investment produce enough and effective supply of high quality to meet social demand. As the first major decision of corporate finance, the high quality capital investment decision must be conducive to create enterprise value and increase shareholders’ wealth. Based on these, capital allocation of listed companies is positively correlated with operating performance. The current ac-counting standards classify capital investment as equity investment, fixed assets, intangible assets and development expenditure by function and character, thus the following three hypotheses are proposed:
H1-1: Equity investment in listed companies is positively correlated with
erating performance.
H1-2: Fixed assets investment in listed companies is positively correlated with operating performance.
H1-3: Intangible investment in listed companies is positively correlated with operating performance.
2.2. Research on the Influence Factors of Capital Allocation
In the real world, however, due to asymmetric information, agency conflict and so on, company operating environment may make important influence on en-terprise investment decisions for managers, which affects efficiency of capital al-location and enterprise value (Jensen and Meckling, 1976) [4]. National devel-opment strategy, external governance environment factors (Li Yanxi, et al., 2015) [5] and other macroeconomic environment factors, industry competition (Chen Xinyuan, et al., 2013) [6], industry characteristics (Pan Yuxiang, et al., 2015) [7] and other medium industry factors, control power gain grabbing drive (Zhang Shuo and Zhao Xi, 2016) [8], equity concentration (Song Xiaobao) [9], manager features, management power (Wang Maolin, 2014) [10], bank-enterprise relations (Zhai Shengbao, et al., 2014) [11] and other more corporate internal characteristics all will affect enterprise investment strategy.
When studying Chinese enterprises, we can’t ignore the characteristic of property rights. In China, the government has the strong control ability to state-owned enterprises, where state-owned enterprises have huge advantages in getting resources (such as financing, project bidding, etc.) relative to non-state- owned enterprises. As the main participants of economic activities, the main business goals should also be to promote enterprise value, therefore, in the capi-tal allocation, they should be based on investment efficiency as the judgment standard, so as to promote the improvement of operating performance. Based on these, the following three hypotheses are proposed for the capital allocation in state-owned listed companies:
H2-1: Equity investment in state-owned listed companies is positively corre-lated with operating performance.
H2-2: Fixed assets investment in state-owned listed companies is positively correlated with operating performance.
H2-3: Intangible investment in state-owned listed companies is positively correlated with operating performance.
The non-state-owned listed companies are built according to the modern en-terprise system, and flourishing in the process of marketalization, where the re-source allocation is naturally optimal. At the same time, in non-state-owned listed companies underinvestment is mainly manifested with serious financing constraints. In order to obtain financing, enterprises also choose projects with better expected investment returns. Based on these, the following three hypo-theses are proposed for the capital allocation in non-state-owned listed compa-nies:
H3-1: Equity investment in non-state-owned listed companies is positively correlated with operating performance.
H3-2: Fixed asset investment in non-state-owned listed companies is positive-ly correlated with operating performance.
H3-3: Intangible investment in non-state-owned listed companies is positively correlated with operating performance.
2.3. Study Design
1) Sample and dataOur sample includes all listed companies in Chinese A stock market. We also exclude firms with missing or non-positive book value of relevant accounts, and where index calculation value is invalid (for instance, the denominator is zero), as is standard in the literature. Considering the financial crisis of 2008-2013, we use data from 2014 to 2016 in CSMAR database. Finally the full sample is 422. We winsorize regression variables at the 1% level to remove extreme outliers.
2) Model assumption and variable description
(
)
(
)
(
)
1 2 3 4 5
Perf = +α β ∆MA MA +β ∆Fix Fix +β ∆Int Int +β Size+β Lev+ε The above multiple linear regression model is established. The dependent va-riable is operating performance (Perf), which uses the weighted average return on equity after deducting non-recurring gains and losses. There are three inde-pendent variables, namely, the growth rate of equity investment
(
∆MA MA)
,the growth rate of fixed asset investment
(
∆Fix Fix)
and the growth rate ofintangible investment
(
∆Int Int)
. ΔMA is the change value of equityinvest-ment in the current period, MA is the beginning value of equity investment in the current period, ∆Fix is the change value of fixed asset investment in the current period, Fix is the beginning value of fixed asset investment in the current period, fixed assets investment includes net value of fixed assets, engineering materials and net value of construction in process; ∆Int is the change value of intangible investment, Int is the beginning value of intangible investment, in-cluding intangible assets investment and the average R&D expenditure. The control variable adopts the enterprise Size (Size) and financial leverage (Lev) at the end of the term (Table 1).
3. Capital Allocation Differences on Performance Test
3.1. Correlation Analysis
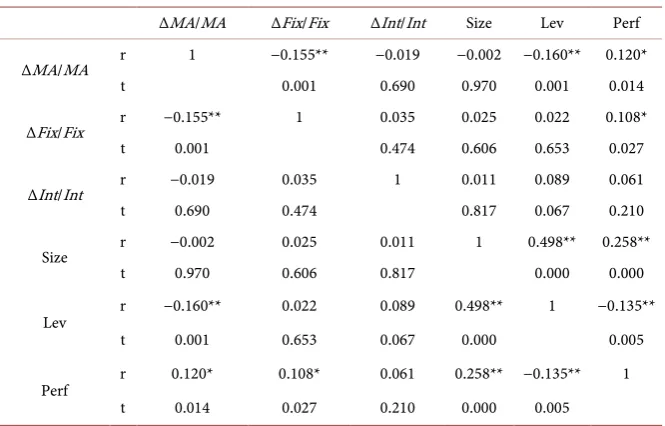
The correlation analysis results of full sample in the model are shown in Table 2. There is a significant positive correlation between equity investment and oper-ating performance, fixed asset investment is so. The correlation coefficient of intangible investment on operating performance is positive, but not significant. In terms of control variables, there are significant linear correlations between enterprise scale, financial leverage and operating performance. In addition, the values of variance expansion factor of each variable are less than 5, which are far
Table 1. Definition of model variables.
Symbol Definition of variables
Perf the weighted average return on equity after deducting non-recurring gains and losses ΔMA/MA the growth rate of equity investment
ΔFix/Fix the growth rate of fixed asset investment ΔInt/Int the growth rate of intangible investment Size the enterprise Size at the end of the term Lev financial leverage at the end of the term
Table 2. Correlation analysis of full sample.
ΔMA/MA ΔFix/Fix ΔInt/Int Size Lev Perf
ΔMA/MA r 1 −0.155** −0.019 −0.002 −0.160** 0.120*
t 0.001 0.690 0.970 0.001 0.014
ΔFix/Fix r −0.155** 1 0.035 0.025 0.022 0.108*
t 0.001 0.474 0.606 0.653 0.027
ΔInt/Int r −0.019 0.035 1 0.011 0.089 0.061
t 0.690 0.474 0.817 0.067 0.210
Size r −0.002 0.025 0.011 1 0.498** 0.258**
t 0.970 0.606 0.817 0.000 0.000
Lev r −0.160** 0.022 0.089 0.498** 1 −0.135**
t 0.001 0.653 0.067 0.000 0.005
Perf r 0.120* 0.108* 0.061 0.258** −0.135** 1
t 0.014 0.027 0.210 0.000 0.005
Note: **1% significant level; *5% significant level.
less than 10, indicating that there are no multiple mutual problems among the variables.
3.2. Regression Analysis Results
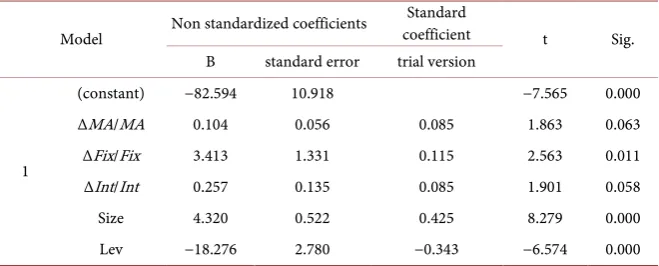
R2 is 18.4% in the model, and the fitting degree of the model is better. Regression
results are shown in Table 3, equity investment, fixed assets investment and in-tangible investment on operating performance have significant positive correla-tions respectively, showing that the higher the capital growth is, the better oper-ating performance, hypotheses H1-1, H1-2, H1-3 are verified.
4. The Regulating Effect of Property Rights on Capital
Allocation
Controlling property rights of an enterprise, when the ultimate controlling own-er of the sample company is the state-owned assets supown-ervision and administra-tion commission of the state council, a state-owned enterprise or other state or-gan, the value is 1, otherwise 0. In this way, the sample of state-owned listed companies is 120, and the others of 302 are non-state-owned listed companies.
[image:5.595.207.540.227.440.2]Table 3. Coefficient of full sample.
Model Non standardized coefficients
Standard
coefficient t Sig. B standard error trial version
1
(constant) −82.594 10.918 −7.565 0.000
ΔMA/MA 0.104 0.056 0.085 1.863 0.063
ΔFix/Fix 3.413 1.331 0.115 2.563 0.011
ΔInt/Int 0.257 0.135 0.085 1.901 0.058
Size 4.320 0.522 0.425 8.279 0.000
Lev −18.276 2.780 −0.343 −6.574 0.000
Note: Dependent: Perf.
4.1. State-Owned Listed Companies
In Table 4 for the subsample of state-owned listed companies, the relation be-tween equity investment and operating performance is not significantly corre-lated, fixed assets investment and intangible investment are so, and the Pearson correlation coefficient of equity investment and operating performance is nega-tive, H2-1, H2-2, H2-3 are not verified. In state-owned listed companies, there is no significant linear relationship between capital allocation and operating per-formance, which shows that the increase of capital does not bring the increase of operating performance, and capital allocation do not agree with operating per-formance. State-owned enterprises are the mixtures of administration manage-ment and market. Besides the pursuit of performance, they take into account tax, employment and social stability, and many other targets. Corresponding to these, senior executives are appointed and appraised by economic factors, polit-ical factors, social responsibility and other factors. Under multiple targets of state-owned enterprises, operating performance is not the sole decision criteria for selecting an investment project. Therefore, investment surplus or underin-vestment occurs, and the inunderin-vestment efficiency is not high.
4.2. Non-State-Owned Listed Companies
In Table 5 of the sample of non-state-owned listed companies, there is a signifi-cant positive correlation between equity investment and operating performance, fixed assets investment is so, and the correlation coefficient between intangible investment and operating performance is positive, but not significant. There are also significant linear relationships between enterprise scale, financial leverage and operating performance in control variables.
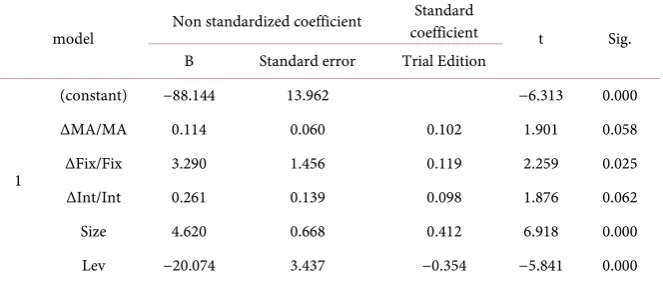
In the model design, R2 is 20%, and the fitting degree of the model is better.
As shown in Table 6, equity investment, fixed assets investment, intangible in-vestment and operating performance are significantly positively correlated re-spectively, in non-state-owned listed companies the higher growth of capital al-location, the better operating performance, and every capital allocation is con-sistent with enterprise performance, hypotheses of H3-1, H3-2, H3-3 are veri-fied.
Table 4. Pearson correlation analysis in state-owned listed companies.
ΔMA/MA ΔFix/Fix ΔInt/Int Size Lev Perf
ΔMA/MA r 1 −0.404** −0.227* 0.006 −0.089 −0.047
t 0.000 0.013 0.946 0.334 0.612
ΔFix/Fix r −0.404** 1 0.408** −0.045 0.063 0.029
t 0.000 0.000 0.626 0.496 0.750
ΔInt/Int r −0.227* 0.408** 1 0.218* 0.132 0.130
t 0.013 0.000 0.017 0.150 0.157
Size r 0.006 −0.045 0.218* 1 0.482** 0.317**
t 0.946 0.626 0.017 0.000 0.000
Lev r −0.089 0.063 0.132 0.482** 1 −0.052
t 0.334 0.496 0.150 0.000 0.575
Perf r −0.047 0.029 0.130 0.317** −0.052 1
t 0.612 0.750 0.157 0.000 0.575
Note: **1% significant level, *5% significant level.
Table 5. Pearson correlation analysis in non-state-owned listed companies.
ΔMA/MA ΔFix/Fix ΔInt/Int Size Lev Perf
ΔMA/MA r 1 −0.128* −0.016 0.012 −0.174** 0.152**
t 0.026 0.779 0.841 0.002 0.008
ΔFix/Fix r −0.128* 1 0.026 0.063 0.026 0.125*
t 0.026 0.648 0.272 0.647 0.030
ΔInt/Int r −0.016 0.026 1 0.007 0.106 0.065
t 0.779 0.648 0.900 0.066 0.259
Size r 0.012 0.063 0.007 1 0.471** 0.254**
t 0.841 0.272 0.900 0.000 0.000
Lev r −0.174** 0.026 0.106 0.471** 1 −0.164**
t 0.002 0.647 0.066 0.000 0.004
Perf r 0.152** 0.125* 0.065 0.254** −0.164** 1
t 0.008 0.030 0.259 0.000 0.004
Note: **1% significant level, *5% significant level.
4.3. Robustness Test
There are many indicators to express operating performance. The above results have been demonstrated by Perf. In order to improve our study, the robustness test is carried out here. We change Perf of the dependent variable to ROA (net profit/total assets) to describe operating performance. The results of the robust-ness test are consistent with the previous conclusions.
[image:7.595.208.540.364.607.2]Table 6. Coefficient of the model in non-state-owned listed companies.
model Non standardized coefficient
Standard
coefficient t Sig. B Standard error Trial Edition
1
(constant) −88.144 13.962 −6.313 0.000
ΔMA/MA 0.114 0.060 0.102 1.901 0.058
ΔFix/Fix 3.290 1.456 0.119 2.259 0.025
ΔInt/Int 0.261 0.139 0.098 1.876 0.062
Size 4.620 0.668 0.412 6.918 0.000
Lev −20.074 3.437 −0.354 −5.841 0.000
Note: Dependent: Perf.
5. Conclusions and Implications
For the full sample, the capital allocation of listed companies in China is consis-tent with the operating performance. Equity investment, fixed assets investment, intangible investment are basically effective, but the relationship between in-tangible investment and operating performance is relatively weak, which shows that the intangible investment efficiency is low, according with the uncertainty feature of the innovation.
In state-owned listed companies, various kinds of investment are inconsistent with operating performance. Choosing investment projects is not in accordance with investment optimization, against the enterprise goal, in the long run, which is bad for enterprise development, and deepening the reform of state-owned en-terprises is extremely demanded. Based on the strategic positioning and devel-opment objective of state-owned capital, combined with different state-owned enterprises roles in the economic and social development, the present situation and needs, according to the main business and core business scopes, state-owned enterprises are classified into two categories of business class and public class. Reforming State-owned enterprises should be carried out by enterprise charac-ter, improve the corporate governance structure, optimize the layout of state-owned capital and strengthen supervision of state-owned assets. According to the tasks undertook and the social development request, state-owned enter-prises of the public class should strengthen state-owned capital investment, im-prove the quality and efficiency of public services, strictly limit their main busi-ness scopes, strengthen main busibusi-ness management, and focus on providing public products and services to make greater contribution. State-owned enter-prises of business class should optimize the resources allocation, intensify re-structuring, integration and R&D expenditure, speed up the pace of technology and management innovation, persistently promote the transformation and up-grading, and foster a batch of state-owned backbone enterprises with innovation capacity and international competitiveness. In this way, the classification reform will better promote the preservation and appreciation of state-owned capital.
In non-state-owned listed companies, various investments are consistent with
business performance, which reflects the effective investment of non-state-owned listed companies. Private enterprises are the important part of the national economy, and different from state-owned enterprises. Non-state-owned enter-prises have generally clear property rights, relatively perfect modern corporate governance structure, and investment standard consistent with enterprise goal to achieve the optimal resource allocation for healthy and efficient enterprise de-velopment. Therefore, with the further development of market economy, the whole society should create a good investment and financing environment to promote the continuous growth of private enterprises for realizing the optimal allocation of all the social resources.
Conflicts of Interest
The author declares no conflicts of interest regarding the publication of this pa-per.
References
[1] Hao, Y., Xin, Q.Q. and Liu, X. (2014) Regional Difference, Enterprise Investment and Quality of Economic Growth. Economic Research, No. 3, 101-115.
[2] Modigliani, F. and Miller, M.H. (1958) The Cost of Capital, Corporation Finance and the Theory of Investment. American Economic Review, 48, 261-297.
[3] Hayashi, F. (1982) Tobin’s Marginal q and Average q: A Neoclassical Interpretation. Econometrica, 50, 213-224. https://doi.org/10.2307/1912538
[4] Jensen, M.C. and Meckling, W.H. (1976) Theory of the Firm: Managerial Behavior, Agency Costs and Ownership Structure. Journal of Financial Economics, 3, 305-360.
https://doi.org/10.1016/0304-405X(76)90026-X
[5] Li, Y.X., et al. (2015) External Governance Environment, Ownership and Efficiency of Listed Companies’ Investment. Nankai Business Review, No. 1, 25-36.
[6] Chen, X.Y., et al. (2013) Industry Competition, Managerial Investment, and Equity Value of Growth/Put Options. China Economic Quarterly, No. 10, 305-332. [7] Pan, Y.X., et al. (2015) The Research of the Relationship between Managers’
Cha-racteristics and Their Investment Decision in Cultural Creative Enterprises. China Soft Science, No. 3, 172-181.
[8] Zhang, S. and Zhao, X. (2016) Change in Capital Allocation and Private Benefit Ex-propriation—Evidence from Control Right Transaction in Chinese Listed Firms. Accounting Research, No. 12, 44-51.
[9] Song, X.B. (2013) Ownership Concentration, Investment Decision and Agency Cost. Chinese Journal of Management Science, 21, 152-161.
[10] Wang, M.L., He, Y.R. and Lin, H.T. (2014) Managerial Power, Cash Dividends and Enterprises’ Investment Efficiency. Nankai Business Review, No. 2, 13-22.
[11] Zhai, S.B., et al. (2014) The Study on the Relationship between the Banking Con-nection and the Investment Efficiency of Listed Company. Accounting Research, No. 4, 74-81.