Article
1
The Facility List Coder: A Tool to Evaluate
2
Community Food Environments
3
Ana María Arcila-Agudelo 1, Juan Carlos Muñoz-Mora 2 and Andreu Farran-Codina 1,*
4
1 Department of Nutrition, Food Science, and Gastronomy, XaRTA – INSA, Faculty of Pharmacy, University
5
of Barcelona, Campus de l’Alimentació de Torribera, Av. Prat de la Riba, 171, Santa Coloma de Gramenet,
6
E-08921 Barcelona, Spain
7
2 Department of Economics, Universidad EAFIT (Colombia)
8
* Author to whom correspondence should be addressed.
9
10
Abstract: A community food environment plays an essential role in explaining the healthy life-style
11
patterns of its community members. However, there is a lack of compelling quantitative approaches
12
to evaluate these environments. This study introduces and validates a new tool named the Facility
13
List Coder (FLC), whose purpose is to assess food environments based on data sources and
14
classification algorithms. Using the case of Mataró (Spain), we randomly selected 301 grids areas
15
(100 m2) where we conducted street audits in order to physically identify all the facilities by name,
16
address and type. Then, audit-identified facilities were matched with those automatically-identified
17
and were classified using the FLC in order to determine its quality. Our results suggest that
18
automatically-identified and audit-identified food environments have a high level of agreement.
19
The ICC estimates and their respective 95% confidence intervals for the overall sample, yield the
20
result “excellent” (ICC ≥ 0.9) for the level of reliability of the FLC.
21
Keywords: community food environment; nutrition environment; geographical information
22
systems (GIS); Facility List Coder; Python
23
24
1. Introduction
25
There is growing interest in understanding how the physical environment affects health
26
outcomes, either directly or by creating a context in which people make health-related decisions (1).
27
Among the various different environs (e.g. sports facilities, etc.), community food environments have
28
received increasing attention in the public health sector and from policy makers due to their effects
29
on diet and health outcomes such as obesity (2). The transformation of the food and nutrition industry
30
during the last decade, the increase of the availability of high calorie food (e.g. fast-food) (availability),
31
the relative increase of healthy food prices over less healthy food options (affordability), the increase
32
of areas without a store where it is possible to buy fresh food (i.e. food desert) (accessibility), among
33
other factors, evidence the fact that community food environments have changed dramatically
34
during the last decades and are playing an important role in changing the food behaviors of adults
35
as well as children (3–5).
36
Despite much qualitative evidence showing the influence of these new community food
37
environments on food behaviors and health outcomes such as obesity, quantitative studies have
38
found counter-intuitive or inconsistent results that suggest that the relationship between food
39
environments and eating patterns is still far from being understood (3,5–7). In a recent systematic
40
review of the relationship between local food environments and obesity, (3) find limited evidence of
41
the existence of this relationship due to results that were predominantly null. Likewise, Williams et
42
al (7) find very little evidence of an effect of community food environments surrounding schools on
43
food purchases and consumption, but did find some evidence of an effect on body weight.
44
Many systematic review articles have been published attempting to explain this lack of
45
quantitative evidence of the relationship between community food environments and health
46
outcomes. These publications have suggested that the absence of compelling direct evidence is
47
mainly due to one factor: the insufficient validity and reliability of food environment measurements.
48
McKinnon et al. (2009) and Lytle et al. (2017) survey peer-reviewed publications from 1990 to 2015
49
which assess food environments using quantitative approaches. They find four types of
50
methodologies: (i) geographic analysis, (ii) sales analysis, (iii) nutrient analysis, and (iv) menu
51
analysis. Only 25% of these studies show any metric evidence (i.e. validity and reliability indices) that
52
validate their quantitative approach for food environments. These instruments are standardized
53
assessment tools, such as the Nutrition Environment Measure Survey (NEMS) (8), which are typically
54
paper-based forms filled out by the subjects themselves (i.e. self-reported) or by a trained observer.
55
In general, these instruments present multiple methodological challenges that limit the
56
understanding of a particular food environment: (i) limited geographical coverage, (ii) high
57
sensitivity to the types of facilities included in the analysis, (iii) high implementation costs, among
58
others (9,10).
59
Other approaches that are receiving increasing attention for assessing food environments
60
quantitatively are those methodologies based on Geographical Information System (GIS)
61
technologies. These methods use the actual locations of the food facilities (i.e. stores, supermarkets,
62
etc.) to estimate different measures such as facility density or proximity to the nearest facility (11).
63
Based on these measures, researchers are able to build different definitions of the level and intensity
64
of exposure of a particular individual to a given food environment. Thereby, the GIS-based
65
alternatives solve the problems of traditional methods, which creates a new and important
66
opportunity to finally uncover the actual relationship between food environments and health
67
outcomes, quantitatively (11).
68
Nonetheless, thanks to the considerable heterogeneity in the use of GIS methods and empirical
69
evidence that utilize these techniques to analyze different food environments, their use has led to an
70
increasing number of null results for the establishment of a robust association between community
71
food environments and other health outcomes such as obesity, sedentarism, among others. In a recent
72
systematic review, Caspi et al. (11) conclude that the methodological constraints of using GIS
73
methods center around the lack of validation evidence and standardization of data sources. Generally,
74
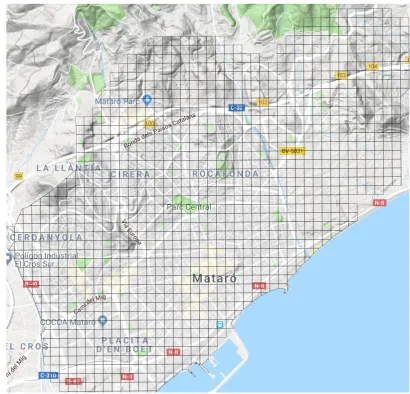
information about facilities in community food environments, is obtained either by using
75
administrative records or commercial sources with no extra quality validation. The resulting poor
76
quality data can lead to uncertainty, bias and reduced statistical power (12). Thus, in order to boost
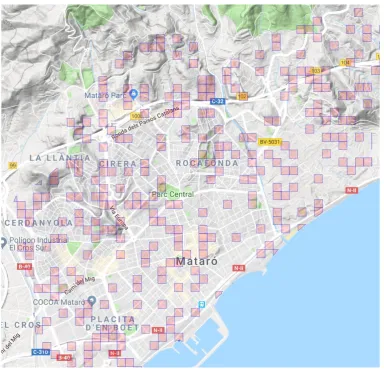
77
the potential of GIS-based solutions for studying food environments, developing new validated,
78
standardized and replicable GIS-based methods are necessary in order to take advantage of this type
79
of solution, and ultimately, to better understand food environments (11).
80
In our case, the need for a tool to assess urban environments arose when studying the prevalence
81
of diet inadequacy in the scholar population of the city of Mataró (Catalonia, Spain) (13). That study
82
demonstrated that adherence to a Mediterranean Diet was lower among adolescents and children
83
who had money to spend at school. Because the availability of money is not a risk factor per se if there
84
is no easily accessible unhealthy food, it was decided to study the food environment around schools.
85
Thus, the aim of this paper is to introduce and validate a new GIS-based tool called the Facility List
86
Coder (FLC), developed to meet the so mentioned need. This tool is based on secondary data, and
87
offers a low-cost, scalable, efficient, and user-friendly way to indirectly identify community
88
nutritional environments.
89
90
2. Materials and Methods
91
Case Study Selection
92
In order to validate the FLC we use the case of Mataró (Spain), a coastal city located near
94
Barcelona (25km) in Catalonia, Spain. The city has experienced an important increase in population
95
in the last 50 years (from 40,407 inhabitants in 1960 to 122,905 in 2010) due to migration from other
96
parts of Spain and, in recent years, from other nations (mainly from Morocco). The economy of
97
Mataró is mainly based on services (63% of total invoicing) and industry (31%) (14). The mixture of
98
population and culture have increased the risk of health related problems such as child overweight
99
and obesity (13). Among the main determinants of this situation, the food environment around
100
schools stands up. However, the lack of information on the number and type of facilities in this city
101
has obstructed the analysis of the influence of food environment on nutritional outcome (13).
102
Secondary Data: Introducing the Facility List Coder (FLC)
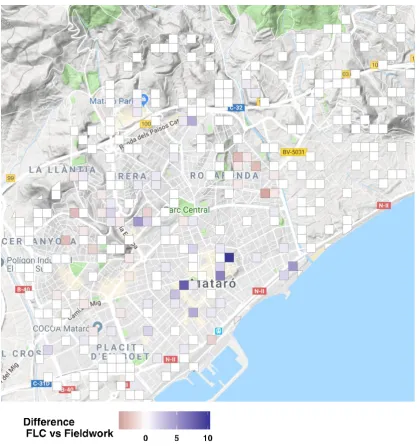
103
104
The FLC is an open source tool developed in Python 3.7 that combines GIS analysis with
105
standard data techniques. In the present text, the term ‘facility’ is used to name any installation,
106
equipment or place that could be an element of interest when assessing community food
107
environments. Besides other GIS-based solution(11,12), the FLC collects geographical information
108
and facility characteristics from two main GIS search-engines that are available on-line (Google Maps
109
and Open Street Maps) performing a spatial query around a pre-defined zone around a centroid (e.g.
110
homes or schools), then information is classified based on the meta-data available for each location
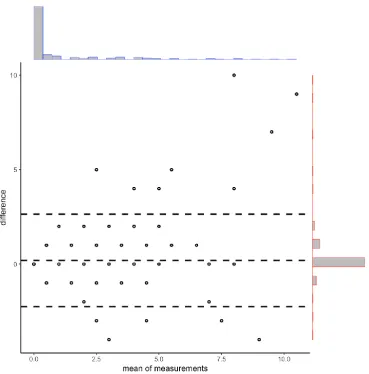
111
based on a comprehensive, multi-language list of key words that allows for the categorization of each
112
facility. These data sets are built utilizing the concept of nodes (or places), which include any
113
geographical objects, such as bridges, street lights, stores, schools, parks, among others. Besides the
114
geographical location, each place provides different types of information like their description,
115
characteristics, offers, among others. This information is a combination of self-reported data by users
116
and centrally collected information by each company or organization.
117
Thereby, the FLC performs a spatial query, retrieving all types of facilities present in a
pre-118
defined zone (e.g. buffer around an interest point or any geographic object). In the case of Google
119
Maps, we used the API that offers a low-cost and very efficient spatial query. For Open Street Map,
120
we implement a spatial query taking all nodes that could be classified as facilities. In order to avoid,
121
duplicates, FLC perform different techniques based on location as well as all available metadata for
122
each location. Once the complete list of facilities is obtained, each facility (e.g. convenience food store,
123
bar, bakery, etc.) is automatically classified using the meta-data available in each data set. We have
124
built a comprehensive, multi-language list of key words that allows for the categorization of each
125
facility into four types: (i) fast-food restaurants, (ii) bars/restaurants, (iii) supermarkets, and (iv)
126
convenience stores and others. These categories can be modified in order to fulfill the specific needs
127
of researchers, for example related to geographical location, multi-lingual search options or research
128
questions. Although other researchers have used similar categories (15), our pre-defined
multi-129
lingual key word list offers a contribution for researching community food environments within the
130
European context as empirical studies for Europe often use categories created for the United States,
131
which might incorrectly estimate the particularities of European food traditions. Furthermore, this
132
list can be easily modified and new terms incorporated or deleted depending on the needs of the
133
researchers. Finally, taking advantage of the different measures available for GIS, the FLC provides
134
different measures, such as: (i) the geographical distance taking into account the road network, in
135
kilometers, (ii) the average time of the walking distance, in minutes, and (iii) the average time of the
136
cycling distance, in minutes. As its main output, the FLC offers a detailed data set for all the classified
137
facilities located around each point of interest. Figure 1 resumes the FLC workflow.
138
141
Figure 1. Facility List Coder workflow
142
Street Audits (Physical Verification)
143
144
In order to validate the classification provided by the FLC, we employed a physical verification
145
test (street audits). For the purpose of creating an exogenous unit of analysis, we divided the territory
146
under study into grids of 100 m by 100 m. In total, we created 1,375 grids (see Figure 2).
147
148
149
Figure 2. Sampling grids (100mts x 100mts) drawn over Mataró map and used to sample audit zones.
150
151
Based on this buffer zone, we built a simple random sample using a 95% confidence level, with
152
expected proportion and variance with a 95% confidence level. In total, 301 grids were randomly
154
chosen (22% of the total). Figure 3 shows the final sample selection.
155
156
157
158
Figure 3. Randomly Selected grids (100mts x 100mts) drawn over Mataró map with the sampled audit
159
zones marked in magenta.
160
161
Two trained people walked the buffer zone in order to record the facilities located along each
162
grids using a tool developed previously with Open Data Kit (https://opendatakit.org/). For each of
163
these facilities, they recorded its name, address and exact coordinates, and took a picture of each
164
storefront. Finally, based on the classification provided by Lake et al. (2010b), our team classified each
165
facility into four categories: (i) fast-food restaurants, (ii) bars/restaurants, (iii) supermarkets, and (iv)
166
convenience stores and others. This physical verification was carried out in February of 2018.
167
The physical verification test allowed us to find three types of facilities: (i) those facilities that
168
were found using the FLC, but that were not physically present (false positives); (ii) facilities that
169
exist, but were not identified by the FLC (false negatives); and (iii) those that were identified using
170
both methods.
171
172
Statistical Analysis
173
In order to assess the reliability index of our two methods for counting the number of facilities
175
on each grids, a descriptive agreement analysis based on the paired t-test and Bland-Altman plot was
176
performed. Whereas the former allowed us to determinate whether there exists a systematic
177
difference between the two methods, the latter allowed us to visually identify the agreement pattern
178
by plotting the difference between the two methods on the vertical axis of the diagram with the
179
average of these same methods on the horizontal axis (17).
180
Then, in order to establish the degree of correlation and agreement between the two methods,
181
we used the Intra-class Correlation Coefficient (ICC), widely used for doing inter-rater reliability
182
analysis. This index is based on McGraw and Wong (18) and there are 10 different forms of the ICC
183
corresponding to different contexts. In our context, as we were interested in assessing the reliability
184
based on the mean of the two methods (i.e. the FLC and field work), we estimated the ICC based on
185
a mean-rating (k = 2), absolute-agreement, two-way mixed-effects model. The ICC values that are less
186
than 0.5 are indicative of poor reliability, values between 0.5 and 0.75 indicate moderate reliability,
187
values between 0.75 and 0.9 indicate good reliability, and values greater than 0.90 indicate excellent
188
reliability (19). Moreover, in order to control for the potential bias of having a lot of pairs of zeroes
189
that may artificially inflate the apparent reliability, we use the Krippendorff’s Alpha Reliability
190
Estimate which is alternative to estimate reliability, allowing controlling for the presence of zeros.
191
All analyses were performed using R.
192
3. Results
193
194
After applying the Facility List Coder (FLC) to Mataró using 100mts x 100mts grids, we
195
identified 935 facilities. According to our results, around the pre-defined grid zone in Mataró, the
196
most common type of facility was “bars/restaurants”, representing 25.8% of all identified facilities,
197
followed by “fast-food restaurants” with 18.9%. According to the FLC results, only 571 grids had at
198
least one facility.
199
200
Figure 4 shows an overview of the results from comparing the field work and the FLC results.
201
Overall, we found that the FLC performed well compared with the street audit. In fact, for 78% of the
202
selected streets, we found the exact same number of facilities through both methods. Moreover, when
203
allowing for a tolerance rate of just one facility, this agreement rate rose to 92.4%. Likewise, we found
204
around 14% of false positives (those facilities that were found using the FLC, but that were not
205
physically present) and 8% of false negatives (facilities that exist, but were not identified by the FLC).
206
The paired t-test statistics is 0.976 with 573 degrees of freedom (p-value=0.329). Hence, there was no
207
evidence of a systematic difference between the results from the FLC and the field work.
208
210
211
Figure 4. Spatial distribution of the difference between the FLC and the street audit (field work). The
212
map shows the difference between facilities found using the FLC and street audit at the randomly
213
selected grids.
214
215
The Bland-Altman diagram provides a first glance at the pattern of agreement between the two
216
methods (see Figure 5). As we pointed out, we observed a high level of agreement between the two
217
methods for the total number of facilities per grid. However, we did find an important disagreement
218
between the FLC and the field work results on those grids with the two largest numbers of facilities
219
(9 and 10). After checking manually, we found that these differences were mainly due to how local
220
food markets were counted: they were treated as single facilities during the field work, yet the FLC
221
coded each facility located within the markets.
222
224
Figure 5. Bland and Altman diagram for the comparison of results obtained with FLC versus street
225
audit.
226
227
The ICC estimates and their 95% confidence intervals for the overall sample indicated that the
228
level of reliability is in the range of good to excellent. When we corrected the data for the local markets,
229
our results got an excellent reliability index using the ICC, which were in any case always above 0.9.
230
Once we take into account the zero bias (Krippendorff’s alpha) results are still significa showing a
231
high degree of reliability (see Table 1).
232
Table 1. Intra-class correlation coefficients calculated using a mean-rating (k = 2),
absolute-233
agreement, 2-way mixed-effects model.
234
Interclass Correlation
Krippendorff’s Alpha
False Positive Rate ICC
index
95% Confidence
Interval F Test With True Value 0 Lower
Bound
Upper
Bound Value df1 df2 Sig
Overall Sample 0.898 0.872 0.919 9.94 300 287 0.000 0.875 14%
Overall sample after correcting for markets
235
When we compared the ICC results by type of facility, we found good to excellent results for all
236
types of facilities (Table 2). The ICC for bars/restaurants was excellent (0.92), followed by fast-food
237
restaurants (0.86) and supermarkets (0.82). The worst performance was found within the category of
238
convenience stores and others, where the ICC was 0.76, still acceptable according the criteria
239
mentioned above. These results suggest that the automatic classification of facilities performed by
240
the FLC is consistent with the classification performed by direct observation. As before, the
241
Krippendorff’s alpha confirms our results as well as the false positive rate.
242
Table 2. Intra-class correlation coefficients calculated using a mean-rating (k = 2),
absolute-243
agreement, 2-way mixed-effects model. Sample after correcting for markets
244
Krippendorff’s
Alpha False
Positive Rate Interclass
Correlation
95% Confidence
Interval F Test With True Value 0 Lower
Bound
Upper
Bound Value df1 df2 Sig
Fast Food 0.861 0.825 0.889 7.18 297 298 0.000 0.770 2%
Bar/Restaurants 0.926 0.907 0.941 13.5 296 297 0.000 0.840 11%
Supermarkets 0.827 0.780 0.864 5.96 297 237 0.000 0.810 5%
Convenience
Stores and others 0.764 0.703 0.813 4.30 297 282 0.000 0.587 2%
4. Discussion
245
Assessing food environments using GIS-based approaches offers an ample methodological
246
range of possibilities that can overcome the most traditional challenge to finding quantitative
247
evidence for the relationship between food environments and health outcomes (3,7). This study
248
sought to validate a new tool called the Facility List Coder (FLC), which allows for evaluating
249
community food environments, using secondary data obtained from the two most traditional
250
geographical on-line search-engines: Google Maps and Open Street Maps. We used the case of
251
Mataró (Spain) to validate this tool, comparing the automatic facility classification provided by the
252
FLC with the ‘gold-standard’ obtained using physical direct verification. Our results indicate that the
253
FLC has good to excellent reliability with respect to the street audit—hence, the FLC provides an
254
excellent source of information for studying food environments.
255
The FLC fulfills the five main requirements suggested by Wilkins et al. (2017b) for validating a
256
GIS-based approach to food environments: (i) food outlet data, (ii) extracting food outlets, (iii)
257
defining food outlet constructs, (iv) geocoding methods, and (v) access metrics. Information for GIS
258
search-engines is centrally managed by each company, yet they are often updated by users (food
259
outlet data). As a result of this spatial query, we retrieved all types of facilities present in a pre-defined
260
buffer zone. Since a spatial query is based on a pre-defined location, including particular search terms
261
(extracting food outlets) is not necessary. Once the complete list of facilities is retrieved, they are
262
classified using an exhaustive list of key words following Lake et al. (2010). Likewise, since other
263
metadata is also collected, information can be easily verified (defining food outlet constructs).
264
Because the information is already geocoded, no further geocoding methods are needed (geocoding
265
methods). Finally, taking advantage of the pre-defined GIS search-engine algorithms, the FLC
266
provides different measurements of distances, such as network distance, walking distance, among
267
others (access metrics).
268
One of the main concerns related to measuring food environments using secondary data sources
269
is the lack of adequate evidence of their validity. Many researchers have highlighted this fact as being
270
one of the main limitations of their studies (7,20,21). Very often, researchers use a facility census or
271
facility lists as the main source of information for assessing food environments. This data is mainly
272
geographical location and update, which leads to high heterogeneity in the data quality among
274
different sources. Mendez et al. (2016) compared two different data sources for food outlets in the
275
United States and found that, depending on the data source selected, the level of statistical
276
significance of the association between neighborhood racial and socioeconomic characteristics and
277
food/alcohol facility density varies. This empirical problem is mainly due to the large difference
278
between the two data sources and it points out the importance of data validation in avoiding bias. In
279
order to overcome these challenges, researchers should compare to a ‘gold standard’ like physical
280
verification (street audits) (20,23). Using this approach, Wilkins et al. (2017b) validated the two main
281
data sources for the United Kingdom through street audit verification, concluding that these two
282
secondary data sets provide a good view of the actual state of food environments. Nonetheless,
283
utilizing a ‘gold standard’ is not always possible as it is often demanding financially as well as
time-284
wise. In these cases, the FLC contributes good to excellent reliability and might offer a complementary
285
data source for researchers so they can have a benchmark with which to validate or complement their
286
initial results using the additional information for food environments.
287
Sociodemographic dimensions could trigger effects of any food environment on health
288
outcomes (5). Former studies have shown that low-income families are more likely to be affected by
289
their surrounding food environment (7,24). Hence, assessing validated and standardized measures
290
of food environments can be difficult—for example, low-income areas pose an empirical challenge as
291
administrative data is often low quality or simply non-existent. In these cases, the FLC can be used
292
as the main source of information to identify community food environments in cases where
293
researchers or practitioners have a limited budget, or the area of study makes it impossible to utilize
294
other intensive techniques such as a facility census. Furthermore, even considering that the quality
295
of data provided by this GIS systems is not homogenous for all countries, this GIS information has
296
worldwide coverage, so the FLC might provide a proxy for the food environment in places where the
297
coverage and the data quality is good but an official facility census or directory doesn´t exists or is
298
not available, as in our case.
299
As Wilkins et al. (2017a) have mentioned, the GIS-based tool has limitations that users need to
300
be aware of. First, as the FLC uses the most popular GIS search-engines to assess food environments,
301
it can be a source of measurement error as information could be either centrally generated by the
302
search-engines or self-reported by users. Despite this, all the information available is verified and
303
standardized to guarantee good quality control (25,26). The fact that part of the information is
self-304
reported by users might lead to the following potential limitations: (i) the FLC might underestimate
305
the food environment in places with a small amount of GIS information and (ii) the FLC might
306
misallocate facilities in locations where no further information is available. Although it is impossible
307
to rule these biases out completely, other researchers (27) have evidenced the validity and good
308
quality of this information. We confirm this in our research.
309
Another concern is the automatic facility classification into pre-defined categories. Lake et al.
310
(2010) present a literature review that delineates how to create a detailed guide for developing
311
classifications of food environments. They conclude that it is not possible to provide only one
312
classification that can be applied in any context. Therefore, we opted for a simplistic and conservative
313
classification adapted to the Spanish context for four categories: (i) fast-food restaurants, (ii)
314
bars/restaurants, (iii) supermarkets, and (iv) convenience stores and others. As Wilkins et al. (2017b)
315
claim, although this general classification does not take into account food provision within individual
316
outlets nor other factors that may influence purchasing decisions, such as pricing and preferences, it
317
provides an opportunity for a baseline analysis and it presents a possibility for future large-scale
318
research projects (23).
319
The FLC is not the only tool that can be used to assess food environments by using common
on-320
line search-engines like Google Maps. The SPOTLIGHT-Virtual Audit Tool (S-VAT) uses the street
321
views provided by Google Earth to develop a desk-based assessment of community food
322
environments (25,28). This tool was derived from a large European Union-funded project and was
323
developed in order to identify and compare environmental characteristics in European
324
through which they can virtually ‘audit’ segment by segment of each street. As a result, based on
326
their storefronts, a list is compiled of all the facilities, as well as other characteristics such as
327
walkability, cycling-related infrastructure, public transport, among others. Bethlehem et al. (2014)
328
found that S-VAT was a highly reliable tool for classifying food environments using street view
329
images.
330
The FLC differs from the S-VAT in many ways. First, the FLC focuses only on determining the
331
characteristics of each food environment through building a classification system of facilities in
pre-332
defined categories while the S-VAT only relies on the storefront image, which can lead to important
333
misclassifications. Second, unlike the S-VAT, the results from the FLC provide a list of all the
334
classified facilities, which allows for properly classifying every food environment. Third, as the
S-335
VAT is based on the visual audit of each street, it is more difficult to collect metadata or characteristics
336
of each facility. The FLC gathers all the information available for each store (e.g. type, images,
337
opening hours, among others), which provides a better understanding of the food environment.
338
Therefore, the FLC and S-VAT, rather than being equivalent tools, complement one another.
339
5. Conclusions
340
To conclude, the FLC is a valid and reliable tool for evaluating community food environments
341
and can be used either as a validation of other secondary data or as a main source of information. The
342
FLC uses the most popular data sources (i.e. Google Maps and Open Street Maps) to identify the
343
facilities present around a given location (e.g. school, hospital, university). As a result, researchers
344
can have access to a comprehensive list of facilities around any location of interest, allowing for more
345
detailed investigation that informs key research questions about the influence of food environments
346
on multiple public health outcomes, such as obesity, sedentarism, dietary patterns, among others. In
347
sum, FLC offers a new, low-cost, scalable, efficient, and user-friendly tool to assess food
348
environments, and it can be implemented in different types of research projects that want to include
349
food environments as a dimension of analysis.
350
Supplementary Materials: The original codes are available at
351
https://github.com/jcmunozmora/facilitylistcoder.git
352
Author Contributions: Conceptualization, A.M.A.A. and A.F.C.; Methodology, A.M.A.A. and A.F.C..; Software,
353
A.M.A.A. and J.C.M.; Validation, A.M.A.A. and J.C.M..; Formal Analysis, A.M.A.A., A.F.C. and J.C.M.;
354
Investigation, A.M.A.A. and A.F.C.; Resources, A.M.A.A. and A.F.C.; Data Curation, A.M.A.A. and J.C.M.;
355
Writing – Original Draft Preparation, A.M.A.A., A.F.C. and J.CM.; Writing – Review & Editing, A.F.C..;
356
Visualization, A.M.A.A. and J.C.M.; Supervision, A.F.C.; Project Administration, A.M.A.A.; Funding Acquisition,
357
A.M.A.A. and A.F.C.
358
Funding: This research received no external funding. A.M.A.A. has received a grant from the Colombian
359
Government to study her PhD in Food and Nutrition at the Universitat de Barcelona (Spain).
360
Conflicts of Interest: The authors declare no conflict of interest.
361
References
362
363
364
1. Lytle LA. Measuring the Food Environment: State of the Science. Am J Prev Med [Internet]. 2009 Apr 1
365
[cited 2019 Jan 4];36(4):S134–44. Available from:
366
https://www.sciencedirect.com/science/article/pii/S074937970900052X
367
2. Pitt E, Gallegos D, Comans T, Cameron C, Thornton L. Exploring the influence of local food
368
environments on food behaviours: a systematic review of qualitative literature. Public Health Nutr
369
[Internet]. 2017 Sep 7 [cited 2019 Jan 4];20(13):2393–405. Available from:
370
https://www.cambridge.org/core/product/identifier/S1368980017001069/type/journal_article
371
environment with obesity: A systematic review of methods, study quality, and results. Obesity. 2015
373
Jul;23(7):1331–44.
374
4. Williams J, Scarborough P, Matthews A, Cowburn G, Foster C, Roberts N, et al. A systematic review of
375
the influence of the retail food environment around schools on obesity-related outcomes. Obes Rev
376
[Internet]. 2014 May 1 [cited 2017 Oct 16];15(5):359–74. Available from:
377
http://doi.wiley.com/10.1111/obr.12142
378
5. Pitt E, Gallegos D, Comans T, Cameron C, Thornton L. Exploring the influence of local food
379
environments on food behaviours: a systematic review of qualitative literature. Public Health Nutr. 2017
380
Sep;20(13):2393–405.
381
6. Glanz K, Sallis JF, Saelens BE, Frank LD. Healthy Nutrition Environments: Concepts and Measures. Am
382
J Heal Promot [Internet]. 2005 May 25 [cited 2019 Jan 4];19(5):330–3. Available from:
383
http://journals.sagepub.com/doi/10.4278/0890-1171-19.5.330
384
7. Williams J, Scarborough P, Matthews A, Cowburn G, Foster C, Roberts N, et al. A systematic review of
385
the influence of the retail food environment around schools on obesity-related outcomes. Obes Rev. 2014
386
May;15(5):359–74.
387
8. Glanz K, Sallis JF, Saelens BE, Frank LD. Nutrition Environment Measures Survey in Stores (NEMS-S).
388
Development and Evaluation. Am J Prev Med [Internet]. 2007 Apr 1 [cited 2017 Oct 16];32(4):282–9.
389
Available from: http://www.sciencedirect.com/science/article/pii/S0749379706005691
390
9. McKinnon RA, Reedy J, Morrissette MA, Lytle LA, Yaroch AL. Measures of the Food Environment. A
391
Compilation of the Literature, 1990-2007. Am J Prev Med [Internet]. 2009 Apr 1 [cited 2019 Jan 5];36(4
392
SUPPL.):S124–33. Available from:
393
https://www.sciencedirect.com/science/article/pii/S074937970900021X?via%3Dihub
394
10. Lytle LA, Sokol RL. Measures of the food environment: A systematic review of the field, 2007–2015. Heal
395
Place [Internet]. 2017 Mar 1 [cited 2017 Oct 16];44(44):18–34. Available from:
396
http://www.sciencedirect.com/science/article/pii/S1353829216300843?via%3Dihub
397
11. Caspi CE, Sorensen G, Subramanian SV, Kawachi I. The local food environment and diet: A systematic
398
review. Health Place [Internet]. 2012 Sep 1 [cited 2017 Oct 16];18(5):1172–87. Available from:
399
http://www.sciencedirect.com/science/article/pii/S1353829212001037?via%3Dihub
400
12. Wilkins EL, Morris MA, Radley D, Griffiths C. Using Geographic Information Systems to measure retail
401
food environments: Discussion of methodological considerations and a proposed reporting checklist
402
(Geo-FERN). Heal Place [Internet]. 2017 Mar 1 [cited 2017 Oct 16];44:110–7. Available from:
403
http://www.sciencedirect.com/science/article/pii/S1353829216302799
404
13. Arcila-Agudelo AM, Ferrer-Svoboda C, Torres-Fernàndez T, Farran-Codina A, Arcila-Agudelo AM,
405
Ferrer-Svoboda C, et al. Determinants of Adherence to Healthy Eating Patterns in a Population of
406
Children and Adolescents: Evidence on the Mediterranean Diet in the City of Mataró (Catalonia, Spain).
407
Nutrients [Internet]. 2019 Apr 15 [cited 2019 May 31];11(4):854. Available from:
408
https://www.mdpi.com/2072-6643/11/4/854
409
14. Departament de Geografía. Mataró 2050 [Internet]. Barcelona; 2008. Available from:
410
http://mataro.cat/web/portal/contingut/document/originals/2018/Mataro_2050_Estudi_final.pdf
411
15. Lake AA, Burgoine T, Greenhalgh F, Stamp E, Tyrrell R. The foodscape: Classification and field
412
validation of secondary data sources. Health Place [Internet]. 2010 Jul 1 [cited 2019 Jan 6];16(4):666–73.
413
Available from: https://www.sciencedirect.com/science/article/pii/S1353829210000146?via%3Dihub
414
validation of secondary data sources. Health Place. 2010 Jul;16(4):666–73.
416
17. Watson PF, Petrie A. Method agreement analysis: A review of correct methodology. Theriogenology
417
[Internet]. 2010 Jun 1 [cited 2018 May 15];73(9):1167–79. Available from:
418
https://www.sciencedirect.com/science/article/pii/S0093691X10000233
419
18. McGraw KO, Wong SP. Forming inferences about some intraclass correlation coefficients. Psychol
420
Methods [Internet]. 1996 [cited 2018 May 15];1(1):30–46. Available from:
421
http://doi.apa.org/getdoi.cfm?doi=10.1037/1082-989X.1.1.30
422
19. Koo TK, Li MY. A Guideline of Selecting and Reporting Intraclass Correlation Coefficients for Reliability
423
Research. 2015;
424
20. Wilkins EL, Morris MA, Radley D, Griffiths C. Using Geographic Information Systems to measure retail
425
food environments: Discussion of methodological considerations and a proposed reporting checklist
426
(Geo-FERN). Heal Place. 2017 Mar;44:110–7.
427
21. Fleischhacker SE, Evenson KR, Sharkey J, Pitts SBJ, Rodriguez DA. Validity of Secondary Retail Food
428
Outlet Data. Am J Prev Med [Internet]. 2013 Oct [cited 2019 Jan 6];45(4):462–73. Available from:
429
http://www.ncbi.nlm.nih.gov/pubmed/24050423
430
22. Mendez DD, Kim KH, Hardaway CR, Fabio A. Neighborhood Racial and Socioeconomic Disparities in
431
the Food and Alcohol Environment: Are There Differences by Commercial Data Sources? J Racial Ethn
432
Heal Disparities [Internet]. 2016 Mar 16 [cited 2019 Jan 6];3(1):108–16. Available from:
433
http://link.springer.com/10.1007/s40615-015-0120-0
434
23. Wilkins EL, Radley D, Morris MA, Griffiths C. Examining the validity and utility of two secondary
435
sources of food environment data against street audits in England. Nutr J. 2017 Dec;16(1):82.
436
24. Casey R, Oppert JM, Weber C, Charreire H, Salze P, Badariotti D, et al. Determinants of childhood
437
obesity: What can we learn from built environment studies? Food Qual Prefer. 2014 Jan 1;31(1):164–72.
438
25. Bethlehem JR, Mackenbach JD, Ben-Rebah M, Compernolle S, Glonti K, Bárdos H, et al. The SPOTLIGHT
439
virtual audit tool: a valid and reliable tool to assess obesogenic characteristics of the built environment.
440
Int J Health Geogr. 2014;13(1):52.
441
26. Cetateanu A, Jones A. How can GPS technology help us better understand exposure to the food
442
environment? A systematic review. SSM - Popul Heal. 2016;2:196–205.
443
27. Svastisalee CM, Holstein BE, Due P. Validation of presence of supermarkets and fast-food outlets in
444
Copenhagen: case study comparison of multiple sources of secondary data. Public Health Nutr [Internet].
445
2012 Jul 22 [cited 2019 Jan 8];15(07):1228–31. Available from:
446
http://www.journals.cambridge.org/abstract_S1368980012000845
447
28. Rutter H, Glonti K, Lakerveld J. The way ahead: Where next for research into obesogenic environments?
448
Obes Rev. 2016;17:108–9.