integrated information and numerical modelling
framework
Jelena Ninic1, Christian Koch2 and Walid Tizani1
1 University of Nottingham, NG7 2RD, UK 2 Bauhaus-Universität Weimar, 99423 Weimar, Germany
Abstract. In situations where rapid decisions are required or a large number of design alternatives is to be explored, numerical predictions of construction pro-cesses have to be performed in near real-time. For the design assessment of com-plex engineering problems such as mechanised tunnelling, simple numerical and analytical models are not able to reproduce all complex 3D interactions. To over-come this problem, in this paper a novel concept for on-demand design assess-ment for mechanized tunnelling using simulation-based meta models is proposed. This concept includes: i) the generation of enhanced simulation-based meta mod-els; ii) real-time meta model-based design assessment in the design tool, and; iii) the implementation within a unified numerical and information modelling plat-form called SATBIM. The capabilities of this concept are demonstrated through an example for the evaluation of tunnel alignment design and the assessment of the impact of tunnelling on existing infrastructure. Moreover, meta models are used for fast forward calculation in sensitivity analyses for the evaluation of the importance of model parameters. The concept proved its efficiency by assessing the design alternatives in real-time with the prediction error of less than 3% com-pared to complex numerical simulation in presented example.
Keywords: Building Information Modelling, Numerical analysis, Meta models, Level of Detail, Soil-structure interaction, Real-time prediction.
1
Introduction
and are difficult to operate in real-time [2]. This can be overcome using computationally efficient meta models instead of the original, detailed numerical models [3].
Meta modelling is understood differently in different domains. In model-driven soft-ware engineering, for example, a meta model specifies the structure, the semantics, and the constraints for a family of models in a certain domain, e.g. in cyber-physical sys-tems modelling [4]. While a model is, simply speaking, an abstraction of phenomena in the real world, a meta model is a further abstraction that specifies the properties of the model itself [5], In other domains, meta models have also been developed to serve as “surrogate models” for expensive simulation processes in order to improve the over-all computational efficiency. In that sense, they have been applied to solve a number of practical engineering problems in the last years. Meta models are extensively used for prediction, sensitivity analysis, pattern recognition, and design optimization [6]. In tun-nelling applications, meta models trained using field monitoring data collected during the tunnel construction process [7] or complex simulation models [8] have been applied for predicting the surface settlements induced by tunnelling. Apart from the prediction speed, the advantage of using meta models is their ability to learn from the different types and large amount data and therefore interpret and summarise existing knowledge in different forms compared to physical models.
Simulation models, on the other hand, are complex and require a large amount of project-specific information that is often available in the form of dispersed resources usually either given in some Computer Aided Design (CAD) format, or, more recently, stored in a Building Information Model (BIM) together with other relevant data about design and construction [9, 10]. One of the challenges during the optimisation of a project design is to preserve the consistency between design alternatives and the corre-sponding design assessment across different sub-models and throughout different phases. Currently, this is usually an error-prone process, involving manual conversion of data from a BIM or similar storage to a format accepted by numerical design tools. An efficient solution to solve this problem is an integrated design-analysis-assessment framework where the numerical simulations are automatically generated based on the geometry and semantics stored in BIM design tools such as Revit [11]. Therefore, we proposed a unified platform for information, numerical modelling and visualisation of simulation results called “SATBIM” (Simulations for multi-level Analysis of interac-tions in Tunnelling based on the Building Information Modelling technology) [12]. In this paper, this platform is extended with a tool for meta model-based design assess-ment.
of tunnelling on existing infrastructure. Moreover, the importance of model parameters is evaluated by means of sensitivity analysis.
2
Methodology
In order to enable on-demand design assessment in engineering design environments, a unified platform for information and numerical modelling considering a multi-level representation, extended with a tool for real-time prediction is proposed in this paper.
2.1 On-demand design assessment in information models
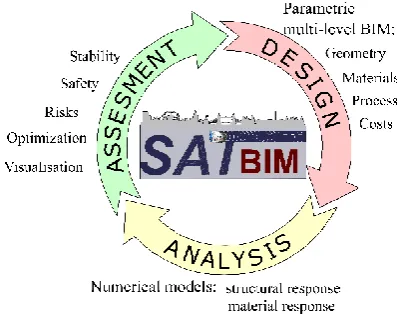
[image:3.595.194.393.483.640.2]Unified platform for information and numerical modelling. SATBIM is an inte-grated, open-source platform for information modelling, structural analysis and visual-isation of the mechanised tunnelling process. Based on a parametric BIM for tunnelling [13], a multi-level simulation model is developed to support engineering decisions dur-ing the project life cycle and to allow for the evaluation and minimisation of risks on existing infrastructure (see Fig. 1). Within this platform, industry-standard tools (Au-todesk Revit) are employed for the design of the tunnel structure and the surrounding infrastructure with consideration of different Levels of Detail (LoDs) for all system components (soil, tunnel structure, tunnel boring machine, existing buildings). Based on the multi-level, parametric BIM, multi-level numerical models for each component are developed, considering proper geometric as well as material representation, inter-faces and the representation of the construction process. The numerical models are then fully automatically instantiated and executed based on the geometry and semantic ex-ported from BIM using newly developed software SatBimModeller [12]. Finally, the simulation outputs are read back and visualised within Revit.
In the SATBIM framework, a multi-scale modelling concept is applied to the shield tunnelling components (soil, TBM, lining, buildings) to enable efficient representation of the tunnelling process with different LoDs as the calling process requires. For exam-ple, on the kilometre scale, a low LoD is applied to represent the general alignment of the track and surrounding infrastructure, while on the centimetre scale, all details are captured with the highest LoD of each component. The multi-level approach is also useful over different project stages due to the availability of the information and details at the different design phases. At early design stages only basic requirements are known, and therefore lower LoDs can be represented, while towards the final design and over the construction phase the highest LoDs are represented within information and numerical models. Such an integrated multi-scale design-numerical approach con-tributes to modelling efficiency by minimising the time needed for model generation as well as computation.
This model is used as a basis for i) information modelling, ii) numerical modelling for the generation of the data set for meta model training and iii) visualisation of numerical assessment results.
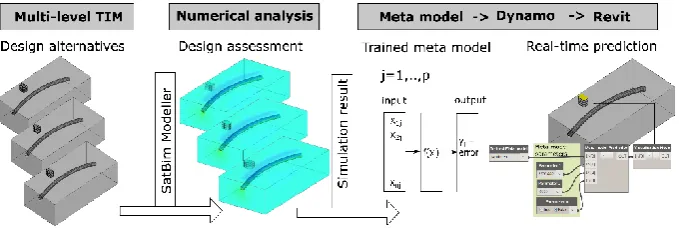
[image:4.595.130.470.530.644.2]Real time-design assessment. To enable real-time assessment, meta models are trained a priori using a process-oriented simulation model generated from a multi-level tunnel-ling information model (TIM) using the SatBimModeller [12]. Apart from settlements, output parameters include the lining stresses, pore pressures, and damage estimates for existing buildings. Figure 2 illustrates the use of simulation-based meta models for real-time predictions. For different design alternatives, with particular design parameters, simulation models are automatically generated and executed using the SatBimModel-ler. The simulation results are stored in a format suitable for meta model training. The data set obtained from the simulation model is trained by means of a hybrid training algorithm (described below) to create enhanced meta models. Finally, the resulting meta model is implemented in Dynamo (a visual programming tool for Revit) to enable interactive visualisation of the effects of design choices within the Revit design envi-ronment.
2.2 Meta models for real-time prediction
Machine learning methods. For the purpose of real-time predictions of tunnelling-induced effects such as surface settlements, risk on building damage, etc., a meta model is employed to substitute for computationally demanding 3D numerical simulations. An algorithm is developed to select an optimal meta model by evaluating and compar-ing different methods for data traincompar-ing:
Polynomial Regression (PR), Artificial Neural Networks (ANNs),
Support Vector Regression (SVR) (with Radial Basis Function (RBF) ker-nel SVR-RBF and Polynomial kerker-nel (SVR-Poly).
In the following, the fundamentals of the prediction models used in this paper are de-scribed.
Polynomial regression. This is a meta modelling approach for modelling the relation-ship between a scalar dependent variable y (output or target variable) and one or more independent variables x (in our case the input vector). For given a data set
{yi, , xi1, … , xip}i=1n of n patterns, a polynomial regression model assumes that the rela-tionship between the dependent variable y and the p vector of input variables xi is mod-elled as an nth degree polynomial in x [14].
𝑦𝑖= 𝛽0+ 𝛽1𝑥𝑖+ 𝛽2𝑥𝑖2+ ⋯ + 𝛽𝑚𝑥𝑖𝑚+ 𝜀𝑖 (𝑖 = 1, 2, … , 𝑛) (1)
Where 𝜷 are regression coefficients and an εi is an “error variable” that adds noise to the polynomial relationship between the dependent variable 𝐲 and inputs 𝐱. In our application, we are using second-order polynomials, so that the model now becomes:
𝑦𝑖(𝛽, 𝑥 ) = 𝛽0+ ∑𝑛𝑖=1𝛽𝑖𝑥𝑖+ ∑𝑛𝑖=1𝛽𝑖𝑖𝑥𝑖2 + ∑𝑖=1𝑛 ∑𝑛𝑗>𝑖𝛽𝑖𝑗𝑥𝑖𝑥𝑗= 𝑿𝑇𝜷 + 𝜀𝑖 (2)
The vector of estimated polynomial regression coefficients is estimated using the Ordinary Least Squares (OLS) method, as the simplest and thus most common estima-tion method. The OLS method minimizes the sum of squared errors and residuals in statistics, and leads to a closed-form expression for the estimated value of the unknown parameter 𝛽:
𝜷̂ = (𝑿𝑇𝑿)−1𝑿𝑇𝒚. (3)
This is the unique least-squares solution as long as 𝑿 has linearly independent col-umns.
𝑦𝑘(𝑥, 𝑤) = 𝑓 (∑𝑗=1𝑚 (𝑤𝑗𝑘+ 𝜃𝑗)𝑓 ∑𝑛𝑖=1(𝑤𝑖𝑗𝑥𝑖+ 𝜃𝑖) ) (4)
In this equation, 𝑤𝑖𝑗 are connection weight between input and hidden neurons, 𝑤𝑗𝑘 are connection weights between hidden and output neurons, 𝜃 is bias and 𝑓() an activation function used to transform the input values and transfer them to the next layer. The relation between the input and output is established by a training procedure, adjusting the connection weights 𝒘 in order to minimise the error 𝐸 between output 𝒚 and target values 𝒕 for number of patterns m. Using a gradient descent method, the connection weights are updated as follows:
𝑤𝑖𝑠= 𝑤𝑖𝑠−1+ Δ𝑤 = 𝑤𝑖𝑠−1− 𝛾𝜕𝑤𝜕𝐸 𝑤ℎ𝑒𝑟𝑒 𝐸 = ∑𝑚𝑘=1(𝑦𝑘− 𝑡𝑘)2 (5)
Where 𝛾 is a learning rate. The training procedure is performed in a number of iter-ation steps is and the weights 𝒘 are updated for all connections between input-hidden, hidden-hidden, and hidden-output neurons. The quality of the meta model training de-pends on both i) the network architecture (number of hidden layers and hidden neurons) and learning parameters (number of iteration steps and learning rate 𝛾).
Support vector regression. This is a machine learning method where the so-called sup-port vectors determine the approximation function [16]. In this method the multivariate regression function f(x) is established based on the input data set x to predict the output data y = f(x) such as:
𝑦 = 𝑓(𝑥) = ∑𝑥𝑖𝜖𝑆𝑉(𝛼𝑖− 𝛼𝑖∗)𝐾(𝑥, 𝑥𝑖) + 𝑏 (6)
where K is a kernel, n is the number of training data, b is an offset parameter of the model, 𝛼𝑖 and 𝛼𝑖∗≠ 0 are Lagrange multipliers of the primal-dual formulation of the problem, and SV is the support vector set. The transformed regression problem may be solved by quadratic programming and only the input data corresponding to the non-zeros 𝛼𝑖 and 𝛼𝑖∗ contribute to the final regression model.
The kernel K is a non-linear mapping from an input space onto a characteristic space through a dot product of the non-linear kernel function 𝜙(𝑥). In this application, two different types of kernel functions are tested:
Polynomial function: (𝛾 (𝑥, 𝑥′) + 𝑟)𝑑 where d is the polynomial degree and r is an independent coefficient
Radial basis function exp (−𝛾 ‖𝑥 − 𝑥′‖ 2
), with 𝛾 is a coefficient greater than 0.
data normalisation, data split, and
optimisation of free parameters of machine learning methods.
In order to achieve better training performance, all input-output pairs are normalised, i.e. mapped to the interval [0.1; 0.9] using a data normalization algorithm. For a param-eter V the normalized value 𝑉𝑛𝑜𝑟𝑚 is obtained as
𝑉𝑛𝑜𝑟𝑚=𝑉𝑉−𝑉𝑚𝑖𝑛
𝑚𝑎𝑥−𝑉𝑚𝑖𝑛(𝑉̅𝑚𝑎𝑥− 𝑉̅𝑚𝑖𝑛) + 𝑉̅𝑚𝑖𝑛 (7)
where 𝑉𝑚𝑎𝑥 and 𝑉𝑚𝑖𝑛 are the maximal and minimal value of the variable V, and 𝑉̅𝑚𝑎𝑥 and 𝑉̅𝑚𝑖𝑛 are the maximal and minimal values of the variable V after normalization, defined as 0.1 and 0.9.
For the training of the enhanced meta model, the data set is split into data for training, testing and validation of the meta model, according to prescribed portions, splitting the data of the whole set at random (see Fig. 2.). The learning process is performed with the training set, while the test set is used to test the prediction performance. Finally, the meta model quality is evaluated with the validation set. This data split is important i) to avoid model overfitting and ii) to double-check the prediction capabilities of the trained meta model.
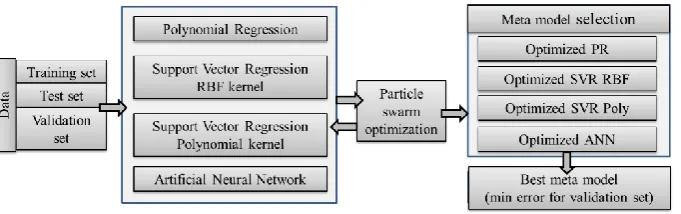
[image:7.595.131.472.470.577.2]Some of the mentioned machine learning methods are characterized by having pa-rameters which influence the training performance (eg. neural networks: number of hidden layers, nodes and learning rate). In order to have enhanced meta models, those parameters are optimized with the Particle Swarm Optimization (PSO) method [17] as shown in Figure 3.
Fig. 3. Algorithm for generation of enhanced meta models. Optimisation of free parameters with the PSO method and selection of the best model with minimum error on the validation set.
value 𝑝𝑏𝑒𝑠𝑡 (𝑥𝑖𝑗𝑝𝑏𝑒𝑠𝑡). If a particle takes the complete population as its topological
neighbours, the best value is a global best 𝑔𝑏𝑒𝑠𝑡 (𝑥𝑖𝑗𝑔𝑏𝑒𝑠𝑡 ). The new velocity and posi-tion of the particles are updated in each iteraposi-tion using the following equaposi-tions:
𝑣𝑖,𝑗+1= 𝑤𝑖𝑗 + 𝜙1𝑟1(𝑥𝑖𝑗𝑝𝑏𝑒𝑠𝑡− 𝑥𝑖𝑗) + 𝜙2𝑟2(𝑥𝑖𝑗𝑔𝑏𝑒𝑠𝑡— 𝑥𝑖𝑗)
𝑥𝑖,𝑗+1= 𝑥𝑖𝑗+ 𝑣𝑖,𝑗+1 (8)
Where 𝑤 are weights, 𝑟1 and 𝑟2 represent random numbers uniformly distributed over [0; 1] and 𝜙1 and 𝜙2 are so-called cognition and social learning factors.
The details about the optimisation algorithm are presented in Section 3.1.
2.3 Sensitivity analysis for model evaluation
Sensitivity analysis is a vital tool in the SATBIM framework for performing the fol-lowing tasks:
determination of the sensitivity/importance of the component LoD for a de-fined analysis scenario and w.r.t. design parameters,
general study of sensitivity/importance of design parameters (geometrical, material and process) for predefined analysis scenarios, and
generation of reliable meta models based on important parameters determined by the sensitivity analysis.
In this paper, we give an example of how sensitivity analysis can be used to evaluate the importance of input parameters for design assessment. For this purpose, the One at Time (OAT) design method is used. This method is based on the discretization of the inputs in levels, allowing a fast exploration of the model behaviour and identification of the influential inputs. In this variance-based method, the importance of the input parameter is quantified through i) the absolute mean 𝜇∗ of the elementary effect 𝐸𝐸𝑖, representing the total sensitivity index and a measure of the overall effect of a factor on the output and ii) the standard deviation 𝜎, which detects the interaction effects with the other parameters as well as the nonlinear relation between the corresponding in-put/output [18,19]. The elementary effect 𝐸𝐸𝑗𝑖 of the jth parameter 𝑋
𝑗 in the ith repetition as well as 𝜎 and 𝜇∗ are calculated as:
𝐸𝐸𝑗𝑖=
𝑌(𝑋1,… 𝑋𝑗+Δ,…𝑋𝑘)−𝑌(𝑋1,… 𝑋𝑗,…𝑋𝑘)
Δ ;
𝜎𝑗= √1𝑛∑𝑛𝑖=1‖𝐸𝐸𝑗𝑖− 𝜇𝑗‖ 𝑎𝑛𝑑 𝜇𝑗∗=𝑛1∑𝑛𝑖=1‖𝐸𝐸𝑗𝑖‖ (9)
where Y(Xj) is an output and 𝛥 is a predetermined multiple of 1/(𝑝 − 1), with p
denot-ing the number of intervals of Xj.
effect on the output. This can be ensured by performing sensitivity analysis a priori to meta model generation. This will be an important matter of further research within SATBIM framework.
3
Workflow and implementation
In this section, the details of the implementation of robust meta models, visualisation of the simulation results and sensitivity analysis for evaluation of the numerical models are described.
3.1 Implementation of the enhanced meta models
The algorithm for the robust meta model training is implemented in Python following the main idea described in Fig. 3 and applying the methods of machine learning de-scribed in Section “Machine learning methods”. For the implementation, the Python library SciKitLearn for supervised learning is used [20]. This toolkit contains imple-mentation of regression models, ANNs and SVR. However, in order to achieve robust learning, the PSO method was implemented to optimize training parameters of different machine learning models. Moreover, the following additional methods were imple-mented:
ReadDatasetFile()for reading the data set with its associated arguments file,
and the training portion, test portion, validation portion;
ComputeError() with arguments training method, training set, test set;
ForwardPass() with arguments weights, data set, method parameters;
ViewPerformance() with arguments training set, test set, validation set.
Listing. 1. Algorithm for generation of enhanced meta models. Optimisation of free parameters with PSO and selection of the best model with minimum error on the validation set.
3.2 Real-time design assessment in Revit
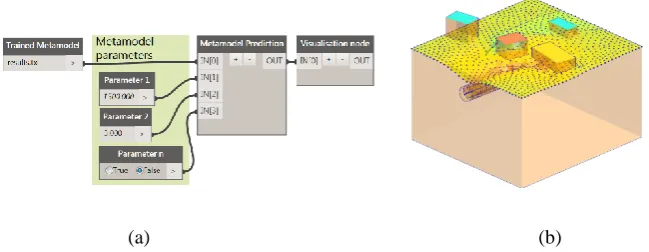
Having established enhanced meta models, we can use them for the fast prediction of the effect of design actions in Revit. In order to do that, a Dynamo node was developed to calculate the forward pass of the meta model based on the model parameters set in Dynamo. The trained meta model is imported as a text file, while parameters are set using value boxes or sliders as shown in Fig. 4(a). The “meta model prediction” node calculates the forward pass, i.e. the analysis response for the selected design parameters. The results are then displayed in Revit with a “visualisation node”. This node is visu-alising simulation results, highlighting both the contour-fill coloured surface for the output quantities as well as the deformation for the case of surface settlements (which is made more visible using a deformation scale factor).
"Training, testing and validation of meta models." def main():
methods = [ linear_model.SGDRegressor(), svm.SVR(kernel='rbf', C=5, gamma=0.4), svm.SVR(kernel='poly', C=1e3, degree=3),
MLPRegressor(solver='lbfgs', alpha=1e-4, random_state=1, max_iter=5000] "Optimize model parameters."
for clf in methods:
param_svr_new = PsoOptimize(clf, model_param_, bx, by, bxt, byt, 20, 20 ) clf.set_params(C = param_svr_new[0])
clf.fit(bx, by)
rrmse = ComputeError(clf, bxt, byt) tot.append(rrmse)
"Choose best model, test and plot results." clf = meth[BestModel(tot)]
rrmse_test = ComputeError(clf, bxt, byt ) # rRMSE of test set rrmse_train = ComputeError(clf, bx, by ) # rRMSE of tran set tr = clf.predict(bx) # training forward pass
(a) (b)
Fig. 4. (a) Dynamo node for real-time design assessment based on meta models; (b) visualisation of numerical results in Revit using contour-fill coloured and deformed surface for surface settle-ments and contour-fill coloured surface for risk of tunnelling on buildings [18].
This simple and intuitive representation is crucial for improving the understanding of tunnelling-induced effects by design engineers who can’t afford computationally ex-pensive numerical simulations or non-experts who may be involved in the decision pro-cess of the project development. Apart from surface settlements, the risk on existing infrastructure is also visualised as shown in Fig. 4(b), where the buildings are sorted in relative scale from green (safe) to red (in risk) based on the influence of the tunnel excavation [21].
3.3 Sensitivity analysis based on meta models
Calculation of the sensitivity measures is implemented in Python as shown in Listing 2. For the forward calculation of the effect of parameter variation onto the output, the meta models trained by means of finite element simulations are applied. This offers significant advantages, since the calculation of the elementary effect requires a large number of forward calculations to ensure the uniqueness of the solution. As explained in the previous section, meta models are excellent tools for interpolation and extrapo-lation of the trained data set, and therefore a reasonable solution for the forward calcu-lations in this manner. In Listing 2, the following steps are performed:
define the set of parameter ranges to be investigated (𝑏𝑥𝑡);
use the meta model to predict the model output (sens_test) based on given input (𝑏𝑥𝑡) and trained meta model synaptic weights (weights) using the For-wardPass() method;
[image:11.595.134.459.150.276.2] calculate the 𝜎 (standard deviation of 𝐸𝐸𝑖) using the ComputeDeviation() method;
Listing. 2. Algorithm for sensitivity analysts based on meta models.
4
Examples
4.1 Real-time prediction
In the example presented in this paper, we consider the problem of a tunnel passing in the vicinity of an existing building (see Fig. 5). The investigated design and modelling parameters are: i) building LoDs (1, 2 and 3); ii) the distance of building’s centreline from the tunnel in Y direction (0, 10, 20, 30, 40, 50, 60 m) and; iii) the tunnel overbur-den (5, 10, 15, 20, 25m). SatBimModeller is used for the generation and execution of a large number of simulations in order to obtain the data set for meta model training. In this numerical experiment containing 105 simulations for the construction of 25 tunnel rings with combination of three parameters (building LoD, overburden and distance), the selected monitoring quantities are the vertical displacements of the building top. This results in a data set of 2554 monitoring samples. This set is used for the generation of the meta model for prediction of building settlement w.r.t building LoD, overburden and distance. In the next step, this meta model is used for the forward calculations of sensitivity analyses.
"Calculate sensitivity measures for data set “bxt” ." def main():
"Read meta model ." w = ReadWeights(weights) sens = []
devs = []
bxt = [[0 for x in xrange( input_size)] for x in xrange(n_delta*time_steps)] for i in range (0, n_delta):
for j in range (0, time_steps):
bxt[i*time_steps+j][1] = 0.1+0.8/(n_delta-1)*i bxt[i*time_steps+j][3] = 0.1+0.8/(time_steps-1)*j
Fig. 5. Parameters for investigation of the building LoD sensitivity. Left: Design alternatives in terms of building distance from the tunnel alignment; Right: depth of tunnel w.r.t. foundation of
the existing building.
Meta model training for the prediction of building settlement. The procedure and the algorithm described in Sections 2.2. and 3.1. are applied for the meta model training based on a data set of 2554 samples. Here, the data set is divided into portions of 80%, 15% and 5% samples for training, testing and validation, respectively.
Fig. 6. (a) Training performance of the meta model using the various machine learning tech-niques; (b) convergence of the optimization process of the ANN architecture.
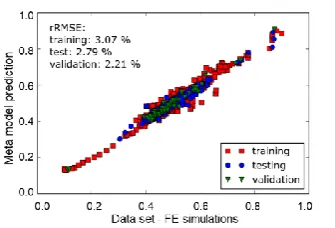
[image:13.595.135.445.385.504.2]Fig. 7. Comparison between vertical displacements of the building obtained from the FE simu-lation and predictions of the trained meta model for the training, test and validation sets for the
model with best performance
Figure 7 shows the comparison between the data set and meta model prediction for the training, testing and validation set for the best meta model. From this figure, it can be concluded that the optimized ANN meta model has excellent prediction capabilities, with the error on test and validation set being less than 3%.
[image:14.595.128.471.574.648.2]On-demand design assessment in Revit. Figure 8 illustrates how simulation-based meta models can be used for real-time prediction and design assessment in Revit. In this example, to assess the impact of tunnel construction on an existing building, the influence of the distance of the tunnel from the existing building and the tunnel depth is evaluated directly in the design tool. The design parameters are set by user using value boxes and sliders in Dynamo as illustrated in Fig. 8. This design assessment ap-proach can be applied in the early design phase when exploring different design alter-natives to minimize the impact of tunnel construction on the existing building. Using the meta model, the results of the analysis are obtained and visualised instantaneously, while the full finite element simulations would have taken hours to calculate. Another advantage of using meta models for real-time design assessment is that meta models are able to interpolate and to certain extent extrapolate the prediction for the explored range of parameters. Thus, for a discrete number of test simulations characterised with a given range of input parameters, using the meta models, the response can be obtained for an infinite number of (continuous) parameter combinations within this range.
4.2 Evaluation of the LoD importance
[image:15.595.139.458.246.367.2]A variance-based global sensitivity analysis has been conducted in order to measure the sensitivities of the model output (settlements at the building top) to the input parameters (building LoD, overburden and distance). In this methodology, the importance of the input parameter is quantified through two sensitivity measures 𝜎 and 𝜇∗ as explained in Section 2.3.
Fig. 9. Sensitivity of the building LoD for different building distance from the tunnel alignment for tunnel overburden of 10m: a) absolute mean of 𝐸𝐸𝑖; b) standard deviation of 𝐸𝐸𝑖.
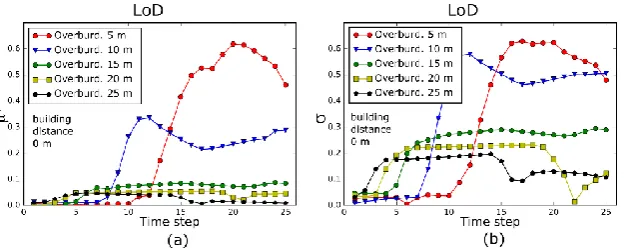
Fig. 10. Sensitivity of the building LoD for different tunnel overburden for building distance of 0 m: a) absolute mean of 𝐸𝐸𝑖; b) standard deviation of 𝐸𝐸𝑖.
In Figures 9 and 10, the sensitivity measures for the selected LoD of the building to vertical displacements are shown. From the plots, we can conclude that the global sen-sitivity 𝜇∗ as well as the interaction effect indicated by 𝜎 of the LoD drops with the increase of the distance of the building from the tunnel and the increase of the overbur-den of the tunnel. It is for instance obvious that when the distance of the building from the tunnel is approximately 4D, the selected building LoD becomes irrelevant, meaning that we can choose the lowest LoD and reduce computational costs.
[image:15.595.144.457.411.536.2]global sensitivity and the interaction effect reduce with the increase of the overburden. However, these sensitivity measures are still significant even for the overburden of 25m - especially 𝜎, which detects a nonlinear relation between the input and the output. This is due to two reasons: first, because the chosen limit of the overburden of 25m (2.5 D) from the tunnel crown is still in a zone of large influence, and second because of the building distance from the tunnel in Y direction of 0 m, where the interaction effect is the strongest (see Fig. 9).
5
Conclusions
In this paper, a concept for on-demand tunnelling design assessment in an engineering design environment is proposed. To this end, simulation-based meta models, trained a priori with complex 3D numerical simulation models, are employed for real-time pre-diction. The unified design-analysis- assessment platform SATBIM is used as a design tool, and as a basis for generation of a large number of simulations for creating a data set for meta model training. Moreover, a strategy and algorithm for generation of en-hanced meta models based on different machine learning techniques is proposed. In the example given in this paper, we demonstrated on-demand design assessment of effects of tunnelling on existing building in Revit. Finally, meta models are applied for sensi-tivity analysis to explore the importance of model parameters.
In general, real-time predictions are required if a large number of alternatives has to be explored and if decisions have to be made in real-time (e.g. setting support pressures during the tunnel construction process). Meta models have been chosen in this approach to substitute complex 3D numerical simulation, since they have been recognised by the practitioners as an efficient method which compromises complexity and speed of cal-culation [22]. Meta models are able to account for the individual behaviour of each component and their complex interactions, giving a more physical response. Conse-quently, different design assessment measures can be evaluated at the same time (sur-face settlements, risk on buildings, stresses in tunnel structure). Certainly, to generate these meta models, a large number of simulation runs has to be performed a priori, and these calculations will require a significant amount of time. However, the advantage is that the generation of simulations is automatized and instantaneous by applying Sat-bimModeller and that the used simulation models can be parallelised [23]. Secondly, since meta models are able to interpolate and to a certain extent extrapolate the predic-tion from given parameter ranges, one can test an infinite number of parameter combi-nations within the chosen range from a discrete number of simulations used for meta model training. Another tradeoff is that trained meta models are characterised with a certain prediction error. Therefore, different machine learning methods and optimiza-tion were used here in order to ensure the best training performance. Consequently, in the example given in this paper, the prediction error is less than 3% and therefore ac-ceptable for most engineering applications.
be performed to obtain sensitivity measures. By applying meta model-based sensitivity analysis, we evaluated the importance of the building model LoD for numerical assess-ment. The results can be used in the future to select optimal LoD of building compo-nent. This then would lead to optimal information and numerical models in terms of model size and computational efforts.
The SATBIM toolkit will be made available as open source software together with tutorials, a complete manual, and a number of benchmark examples. The project’s Github repository (not yet public) can be found at: https://github.com/satbim.
Acknowledgements
This project has received funding from the European Union’s Horizon 2020 research and innovation programme under the Marie Sklodowska-Curie grant agreement No 702874 “SATBIM — Simulations for multi-level Analysis of interactions in Tunnel-ling based on the Building Information ModelTunnel-ling technology”. This support is grate-fully acknowledged.
References
1. Potts, D., Zdravkovic, L.: Finite element analysis in geotechnical engineering: application. Thomas Telford Ltd; (2001)
2. Ninić, J., Meschke, G. :Model update and real-time steering of tunnel boring machines using simulation-based meta models. Tunnelling and Underground Space Technology, 45, pp. 138–152, (2015).
3. Khaledi, K., Miro, S., König, M., Schanz, T.: Robust and reliable metamodels for mecha-nized tunnel simulations. Computers and Geotechnics 61, pp. 1–12, (2014).
4. Legatiuk, D., Theiler, M., Dragos, K. & Smarsly, K., 2017. A categorical approach towards metamodeling cyber-physical systems. In: Proceedings of the 11th Interna-tional Workshop on Structural Health Monitoring (IWSHM). Stanford, CA, USA, 09/12/2017.
5. Smarsly, K., Theiler, M. & Dragos, K., 2017. IFC-based modeling of cyber-physical systems in civil engineering. In: Proceedings of the 24th International Workshop on Intelligent Com-puting in Engineering (EG-ICE). Nottingham, UK, 07/10/2017.
6. Schulz1, W., Hermannsa, T., Khawlia, T.A.: Meta-modelling, visualization and emulation of multi-dimensional data for virtual production intelligence. AIP Conference Proceedings 1863, 440003 (2017).
7. S. Suwansawat, Einstein, H.: Artificial neural networks for predicting the maximum surface settlement caused by EPB shield tunneling, Tunnelling and Underground Space Technology 21 (2) 133–150, (2006).
8. Kim, C.Y, Bae, G., Hong, S., Park, C., Moon, H., Shin, H.: Neural network based prediction of ground surface settlements due to tunnelling, Computers and Geotechnics 28 (6-7) 517– 547, (2001).
10. Koch, C., Vonthron, A., König, M.: A tunnel information modelling framework to support management, simulations and visualisations in mechanised tunnelling projects, Automation in Construction 83, 78–90, (2017).
11. Meschke, G., Freitag, S., Alsahly, A., Ninic, J., Schindler, S., Koch, C.: Numerical Simula-tion in Mechanized Tunneling in Urban Environments in the Framework of a Tunnel Infor-mation Model, Bauingenieur 89 (11) (2014) 457–466.
12. Ninić, J., Koch, C., Stascheit, J.: An integrated platform for design and numerical analysis of shield tunnelling processes on different levels of detail, Advances in Engineering Soft-ware 112, pp.165–179, (2017).
13. Ninić, J., Koch, C., Tizani,W.: Parametric information modelling of mechanised tunnelling projects for multi-level decision support, 24th EG-ICE International Workshop on Compu-ting in Engineering 1, pp. 228-238, (2017).
14. Montgomery, D.C, Peck,, E.A., Vining, G.G.: Introduction to Linear Regression Analysis (5 ed.), John Wiley & Sons, (2012).
15. Rumelhart, D.E., Hinton, G.E., Williams, R.J.: Learning representations by back-propagat-ing errors. Nature 323, 533-536, (1986).
16. Vapnik,V.: The nature of statistical learning theory, Springer-Verlag, 2000.
17. Kennedy, J., Eberhart, R. C.:Particle swarm optimization, in: I. Press (Ed.), Proceedings of the IEEE International Conference on Neural Networks, Piscataway, NJ, USA, 1995, pp. 1942 – 1948.
18. Morris, M.: Factorial sampling plans for preliminary computational experiments. Techno-metrics 33, 161 -174, (1991).
19. Miro, S., Hartmann, D., Schanz, T: Global sensitivity analysis for subsoil parameter estima-tion in mechanized tunneling. Computers and Geotechnics 56, 80-88, (2014).
20. Pedregosa, F., Varoquaux, G., Gramfort, A., Michel, V., Thirion, B., Grisel, O., Blondel, M., Prettenhofer, P., Weiss, R., Dubourg, V., Vanderplas, J., Passos, A., Cournapeau, D., Brucher, M., Perrot, M., and Duchesnay, E.: Scikitlearn: Machine Learning in Python. Jour-nal of Machine Learning Research 12, 2825-2830, (2011).
21. Schindler, S., Hegemann, F., Koch, Ch., König, M., Mark, P.: Radar interferometry based settlement monitoring in tunnelling: Visualisation and accuracy analyses, Visualization in Engineering, Volume: 4, pages 7-23, (2016).
22. Stascheit, J., Ninić, J., Hegemann, F., Maidl, U., Meschke, G.: Building Information Mod-elling in mechanised shield tunnMod-elling – A practitioner’s outlook to the near future, Geome-chanics and Tunnelling 11 (1), pp. 34–49, (2018).