This is a repository copy of Solubility and Nucleation of Methyl Stearate as a Function of Crystallization Environment.
White Rose Research Online URL for this paper: http://eprints.whiterose.ac.uk/128034/
Version: Accepted Version
Article:
Camacho Corzo, DM orcid.org/0000-0001-5330-4110, Roberts, KJ
orcid.org/0000-0002-1070-7435, More, I et al. (1 more author) (2018) Solubility and Nucleation of Methyl Stearate as a Function of Crystallization Environment. Energy and Fuels, 32 (3). pp. 3447-3459. ISSN 0887-0624
https://doi.org/10.1021/acs.energyfuels.7b03212
(c) 2018, American Chemical Society. This document is the Accepted Manuscript version of a Published Work that appeared in final form in Energy & Fuels, copyright (c) American Chemical Society after peer review and technical editing by the publisher. To access the final edited and published work see: https://doi.org/10.1021/acs.energyfuels.7b03212
[email protected] https://eprints.whiterose.ac.uk/ Reuse
Items deposited in White Rose Research Online are protected by copyright, with all rights reserved unless indicated otherwise. They may be downloaded and/or printed for private study, or other acts as permitted by national copyright laws. The publisher or other rights holders may allow further reproduction and re-use of the full text version. This is indicated by the licence information on the White Rose Research Online record for the item.
Takedown
If you consider content in White Rose Research Online to be in breach of UK law, please notify us by
Page 1 of 47 SOLUBILITY AND NUCLEATION OF METHYL STEARATE AS A FUNCTION OF
CRYSTALLISATION ENVIRONMENT
Diana M. Camachoa*, Kevin J. Robertsa, Iain Moreb, Ken Lewtasb,c
[a] School of Chemical and Process Engineering, University of Leeds, Leeds, LS2 9JT, UK
[b] Infineum UK Ltd, Milton Hill Business and Technology Centre, Abingdon, OX13 6BB,
UK
[c] Current address: Lewtas Science & Technologies Ltd., Oxford, OX2 7DY, UK
Keywords: Biodiesel cold-flow behaviour, solubility, solution ideality, nucleation kinetics and
mechanism, methyl esters, solvent effect, solution turbidometric characterisation, polythermal
method, KBHR model
*Corresponding author
Page 2 of 47 ABSTRACT
Crystallisation studies of methyl stearate from supersaturated dodecane, kerosene and toluene
solutions reveal strong evidence that solvent choice influences solubility and nucleation
behaviour. Solute solubility is less than ideal with toluene, kerosene and dodecane, respectively
exhibiting the closest behaviour to ideality, the latter consistent with the highest solvation.
Polythermal crystallisation studies using the KBHR model [1-3], reveal a progressive
nucleation (PN) mechanism with crystallite interfacial tension values between
0.94-1.55, 1.21 - 1.91 and 1.18-1.88 for dodecane, kerosene and toluene, respectively. Nucleation
rates at the critical undercooling lie between 4.56 x 10¹⁶ and 1.79 x 10¹⁷ , with the highest
rates associated with crystallisation from kerosene solutions. Iso-supersaturation nucleation
rates are the highest for dodecane ranging from 2.39 x 10¹⁷ and 3.63 x 10¹⁸ .
Nucleation in toluene appears to be hindered by its relatively higher interfacial tension which
is associated with nucleation rates about an order of magnitude less than those obtained for
Page 3 of 47 1. Introduction
The study of diesel and biodiesel fuel crystallisation is of importance to the fuels industry as
poor cold-flow properties of these mixtures can cause operability problems within vehicles
engines, pipelines and vehicle tanks under cold weather conditions due to the formation of
crystals at low temperatures. To date most research has focussed on the crystallisation within
diesel fuel [4-15], which mostly comprises alkanes, with much less emphasis being placed to
the study of biodiesel fuel. First generation of biodiesel fuels are generally a mixture of both
saturated and unsaturated methyl esters from which the former represent an important
proportion of these solution and commonly contain methyl palmitate (C16:0) and stearate
(C18:0). The cold-flow behaviour of biodiesel is determined to a great extent by the amount of
saturated compounds present in its composition.
Some studies [16-19] have been carried out in order to characterise the cold-flow behaviour of
biodiesel fuel produced from different bio-resources, measuring certain properties such as:
cloud point (CP), pour point (PP) and cold filter plugging point (CFPP) and the effect of
cold-flow improvers on these properties. The fractionation of methyl esters crystallising from
biodiesel fuel mixtures produced from different bio-resources has also been addressed [20-25].
However, up to now there has been a lack of fundamental studies on the nucleation of saturated
methyl esters, such as methyl palmitate and stearate.
As a baseline case, it is the aim of this study to deliver fundamental information on the
solubility and nucleation of methyl stearate measured as a function of solution environment. In
this, the solubility is assessed using the van’t Hoff analysis [26]. This was combined with a
Page 4 of 47
[1-3]. This theory, outlined in section 2 of the paper, permits a first principle analysis of
nucleation kinetics and enables the derivation of key kinetic parameters and the
characterisation of the nucleation mechanism.
As in real-world operation biodiesel fuel is commonly mixed with traditional diesel fuel, three
different model solvents were chosen representing the variation in solvation environment, viz.
dodecane, toluene and kerosene.
2. Nucleation kinetics and mechanism
2.1. Classical nucleation theory (CNT) and its assessment
The classical nucleation theory provides a model for the prediction of the rate at
which nuclei of new crystalline phase are formed. This model given by expression (1) describe
the dependence of nucleation rate on two terms: a thermodynamic (exponential) which
accounts mainly for the effect of temperature, supersaturation ratio and the effective
interfacial tension on the formation of nuclei and a “kinetic” one (pre-exponential)
which described the frequency with which molecules will attach to the nucleus. The interplay
of these two terms would determine a system’s nucleation behaviour.
e�� (1)
Where is the nucleation rate constant, is the nuclei numerical shape factor i.e. for
spherical nuclei and for cubic nuclei, is the volume occupied by a solute molecule in the
Page 5 of 47
(2)
Here is the solution’s molar concentration and is the equilibrium concentration.
Supersaturation can also be expressed as the relative supersaturation as given by
expressions (3)
(3)
The analysis of nucleation kinetics can be performed by either the isothermal or polythermal
methodologies which both use the concept of solution state metastability to create the
supersaturation needed to promote nucleation. The isothermal method makes use of the kinetic
expressions derived from classical nucleation theory, in particular, utilising the assumption that
the induction time can be taken as being inversely related to the nucleation rate . In
contrast the polythermal method assesses nucleation through establishing the effect of cooling
rate on crystallisation temperatures .
2.1.1. The isothermal method
In this method, one can calculate key nucleation parameters including the interfacial tension
and the critical nucleation cluster size , as a function of solution supersaturation and
temperature.
In this case, many experiments ideally should be carried out i.e. typically 5-10 different
Page 6 of 47
data is though relatively simple as nucleation rates can be directly extracted by fitting a
probability distribution of the measured induction times. A comprehensive assessment that
quantifies the uncertainty associated with the parameters estimated using this methodology is
provided in the work presented by Xiao Y. et al. [28].
2.1.2. The polythermal method
The polythermal approach continuously varies the solution supersaturation, and hence
induction time, upon cooling and assesses the balance between excess concentration generation
via the cooling rate and the material’s intrinsic nucleation rate. The effect that supersaturations
has on nucleation is implicitly evaluated over the whole width of the metastable zone. This is
defined, for the work presented here, as the difference between the equilibrium concentration
derived from van’t Hoff analysis and the solution concentration pertinent to the temperature at
which spontaneous crystallisation occurs.
The process involves driving the solution by cooling until the induction time is effectively zero.
i.e. the point at which spontaneous nucleation takes place. Under these conditions mass transfer
due to molecular diffusion can be expected to be rapid and hence the degree of statistical
variation would be much less than that for induction times measurements. The latter is typically
recorded for lower supersaturations, concomitantly larger cluster sizes and lower levels of
molecular diffusion.
In the polythermal case, experimental data is comparatively easy to collect using automated
temperature controlled solution turbidimetric methods. As nucleation is clearly of stochastic
nature, in our analysis all the determined parameters are presented with their corresponding
Page 7 of 47
previous work [3]. In this, we have shown that typically five repeats at each cooling rate are
sufficient (Section 2 of the SM provided in reference [3]) to obtain reliable data to perform an
assessment using this approach.
The analysis of polythermal data can be much more complex than the isothermal case and could
be performed using a number of different available models, both empirical [29, 30] and first
principles [31-33]. The most widely used interpretation of data is using the empirical
Nyvlt expressions [29, 30]. However, given the empirical nature of the Nyvlt approach, Kubota
[31] and Sangwal [32, 33] have re-interpreted these equations in order to derive more
physically meaningful parameters. An example of the application of these approaches is
provided by Mitchell N.A. et al. [34] where key kinetic parameters were derived for
paracetamol–ethanol solutions.
2.1.3. Comparison between isothermal and polythermal methods
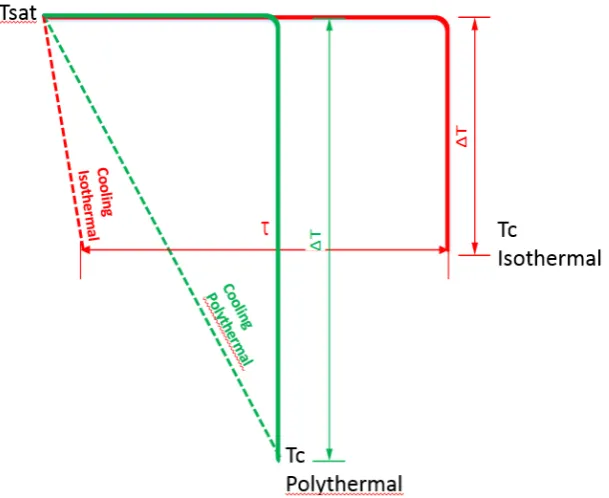
Figure (1) compares the different approaches used in each of the methodologies to collect
experimental data. Using a turbidimetric technique, in the isothermal method a clear
homogeneous solution is rapidly cooled to a given supersaturation where the solution is kept
until crystallisation is detected through the increase in the solution’s turbidity, after a given
induction time . On the other hand, in the polythermal method a solution is cooled
continuously at a given rate, until crystallisation is detected through the increase in the
solution’s turbidity. Although in the isothermal method the onset of crystallisation is monitored
at the same temperature (or supersaturation), this method is up to a certain extent inherently
polythermal as the solution has already gone through a number of different temperatures (or
Page 8 of 47
methodologies are apparently quite different, interestingly, they reach the same endpoint, e.g.
as shown in Camacho D.M. etal. (Table 9 CrystEngComm, 2014) [3] nucleation parameters
calculated via the two methodologies are broadly equivalent. For clarity to the reader on how
to establish the corresponding supersaturations using either of the two methodologies, section
1 of the supplementary information (SI) provides also a figure in which these method are
compared based on a plot of concentration vs temperature.
Due to the nature of crystallisation in methyl esters solutions, characterised for very narrow
metastable zones and very short induction times a polythermal method was used to collect
experimental data. Details of this methodology are provided in section 4.
2.2. The Kashchiev-Borissova-Hammond-Roberts (KBHR) approach
A first principles analytical polythermal approach, the
Kashchiev-Borissova-Hammond-Roberts (KBHR), comprises a set of model equations analytically derived starting from the
Kolmogorov-Johnson-Mehl-Avrami (KJMA) expression. Such model is analogous to
“chemical reaction progress kinetic analysis” [35], in which reaction progress is monitored as
a function of a dynamically changing reactant concentration, which is akin to carrying out
hundreds of separate initial rate experiments [35]. A key outcome of the KBHR model is the
so called “rule of three” [1, 2] which can be used to discriminate between two case nucleation
mechanisms, i.e.
Progressive nucleation (PN) [2] where new crystal nuclei are continuously formed in the
Page 9 of 47
associated with both the nucleation and the growth processes until the crystals reach a size
where they are detectable optically via the turbidimetric technique.
Instantaneous nucleation (IN) [1] where all nuclei emerge at once at the beginning of the
crystallisation process to subsequently grow and develop into crystal. In this case, strong
nucleation sites will favour the nucleation process and therefore inductions times are only
associated with the time for these crystals to growth to a detectable size.
The expressions related to both the PN and IN mechanisms, analytically derive in the KBHR
approach, are presented below [2].
2.2.1. Progressive Nucleation
The general expression relating critical undercooling and cooling rate for this mechanism is
given by expression (4)
(4)
The relative critical undercooling is a dimensionless quantity associated with the critical
undercooling given by:
Page 10 of 47
Similarly, the critical undercooling , which represents the solution´s metastability limit in
terms of temperature, is defined as:
(6)
where and are the solution equilibrium and crystallisation temperatures, respectively.
Expression (4) describes the dependence of the number of crystals at the detection point
on cooling rate when i.e. the volume of single crystals is unaccounted for (see
derivation in SM), thus the free parameters , and are given by [2]
(7)
(8)
(9)
Where, the volume of the solution and is given by [2]
(10)
Page 11 of 47
When equation (4) is derived by means of the relative volume of crystals the parameters
, and are defined by
(11)
(12)
(13)
Here, is the dimensionality of crystallites growth, i.e. 3 for spheres or cubes, 2 for disks or
plates and 1 for needles. and are the crystallite growth exponents which are related
to the different growth mechanism [36]. The case corresponds to growth mediated by
diffusion of solute towards the crystallite or transfer of solute across the crystal/solution
interface. The case characterises growth controlled by the presence of screw
dislocations in the crystallite. The parameter ranges between ½ and 1: is for
growth controlled by undisturbed diffusion of solute, and is for growth by diffusion of
solute through a stagnant layer around the crystallite or for normal or spiral growth limited by
transfer of solute across the crystal/solution interface. At the crystallite radius increases
linearly with time [1, 2, 37] . is the crystallites´ growth shape factor i.e. for
spheres, 8 for cubes, for disks, for square plates ( is the fixed disk or plate
Page 12 of 47
growth rate constant, is the gamma function and the relative volume of crystals at the
detection point
2.2.2. Instantaneous nucleation
In the case of IN the expression for the dependence of relative critical undercooling on cooling
rate is given below
ln ln ln (14)
In this expression , and the parameter is given by
(15)
Where is the concentration of nuclei at the time at which the instantaneous nucleated
crystallites are formed and is given by expression (16)
(16)
If additionally, the undercooling at which all nuclei spontaneously appear is small enough so
Page 13 of 47
(17)
Equation (14) takes the form of a straight line given by
ln ln ln (18)
ln line corresponding to expression (4) is only slightly curve, thus in a not too wide
experimental range it can be approximate to a straight line [1, 2]. This linear relationship can
be analytically derived using an arbitrarily critical undercooling as shown in reference [2] and
is given by expression (19). When comparing this expression with equation (18) then from the
slope of a line of the dependence of relative critical undercooling for crystallisation on the
cooling rate , the nucleation mechanism can be stablish using the “rule of three” [1, 2]:
or
ln ln ln (19)
In expression (19) is a positive number and is a parameter related to [1]
Both expressions (4) and (14) are subjected to the inequalities (20) as shown in the analytical
derivation in section 1 of the SM. Which means that this analysis is restricted to small enough
values of the critical undercooling for which the inequalities are satisfied
Page 14 of 47
The critical radius of the nucleus and the number of molecules in the critical nucleus
can be calculated from expressions (21) and (22) given in terms of the relative undercooling
(21)
(22)
The classical 3D nucleation rate model, given in terms of the parameters defined by the KBHR
approach is presented in equation (23)
(23)
Here is related to the attachment frequency of monomers to the nucleus , the
concentration of nucleation sites , and the Zeldovich factor . The latter accounts for the
probability that a critical nucleus would become a crystal and not re-dissolve.
The attachment frequency is given by either expression (24) or (25) for attachment of
monomers controlled by volume diffusion or interface transfer respectively [38]
(24)
Page 15 of 47
where is the sticking coefficient, the diffusion coefficient of colliding building units, the
concentration of colliding building units, the transfer frequency of building units from
adsorbed to integrated, the thickness of adsorbed surface layer and the surface area of
nucleus.
The attachment of building units to the cluster is quite sensitive to changes in the temperature,
the effect being mainly due to the viscosity. This is particularly relevant when the attachment
of monomers is controlled by volume diffusion and nucleation occurs within a temperature
range in which the solution viscosity varies strongly with .
It is important to highlight here that due to the nature of the derivation of the KBHR approach,
the assessment of polythermal data using this theory is subject to the following assumptions:
1. The supersaturation at which crystallisation is detected (MSZW) has to be sufficiently small,
so that the solution viscosity does not change significantly within the assessed range
2. The former will allow the assumption that the nucleation mechanism does not change within
the range of concentrations measured on cooling
A fuller description of this theory is provided in the SI to this paper.
3. Materials and methods
3.1. Materials
Methyl stearate, dodecane and toluene were purchased fromSigma-Aldrich. The purity of the
Page 16 of 47
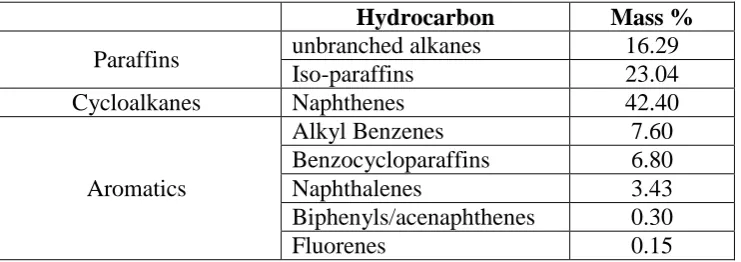
purification was carried out. Kerosene was supplied by Infineum Ltd. (Milton Hill-Oxfordshire
UK). Its hydrocarbon composition is summarised in Table 1. Its n-alkanes chain length
distribution is given in Fig.2 of the SI.
3.2. Equipment and experimental procedure for polythermal data collection
Crystallisation experiments were carried out using the Avantium Crystal 16® system. This
provides a multiple reactor facility with four separate Peltier heated aluminium blocks, each of
which has a capacity to hold four magnetically-agitated 1 mL solution vials. Each block can be
individually programmed to follow a given temperature profile during which the variations in
the solution turbidity are followed as a function of temperature.
Solutions of methyl stearate in three different solvents dodecane, kerosene and toluene were
prepared at solutions concentrations of 200, 250, 300 and 350 g of solute per litre of solvent
for the first two solvents, and 154, 192, 231 and 269 g of solute per litre of solvent for toluene.
In order to ensure accurate measurement of temperatures, calibration of the Crystal 16® unit
was required. Four vials containing each of the solvents were placed in each of the blocks
which were programmed to a specific temperature in the range of 20°C to -8°C. Whilst each
block was kept at a chosen temperature, measurements of the actual temperature with 0.5°C
accuracy were carried out by positioning a thermocouple within each of the vials. The average
of the four temperatures readings obtained in each block was plotted against the programmed
temperature and fitted by a straight line represented by the expressions ,
and for dodecane, kerosene and toluene respectively. These
expressions were then used to correct the experimentally measured temperature values. The
Page 17 of 47
The solutions were subject to heating and cooling cycles, with each cycle initiated by heating
the solutions up to 40°C where they were held for 1 h to ensure complete homogenization and
then cooled to -15°C where they were also held for 1 h to allow equilibration. This temperature
profile was applied at each solution’s concentration using four different rates 0.25, 1.0, 3.2 and
9.0 °C/min for dodecane and kerosene systems and 0.25, 0.5, 1.0 and 1.5 °C/min for toluene
solutions. The range of both concentrations and cooling rates for solutions of a given solvent
was chosen to ensure accurate temperature profiles. This was achieved by setting temperatures
profiles in which crystallisation was detected above -15 °C (lowest working temperature of the
Crystal 16®) and a sufficiently wide range of cooling rates in compliance with both the
equipment cooling power capacity and the methodology applied. For the solutions where
crystallisation was detected at lower temperatures a narrower cooling range had to be used due
to the decrease in the equipment cooling capacity observed at these temperature levels.
At each rate the temperature cycle was repeated five times to obtain average values for the
crystallisation and dissolution temperatures and .These were estimated based upon the
points in the turbidity profile at which sudden changes in light transmittance are detected .
Fig. 2 shows a typical experimental profile together with a representative raw data set for one
of the experimental runs.
To assess the influence of the solute and solvent molecules polarity on the solubility of methyl
stearate, its dipole moment was calculated in vacuum using three different methods:
semi-empirical:AM1, Hartree-Fock:3-21G and DFT:B3LYP/6-31G* delivering values of 1.67 D,
1.54 D and 1.52 D respectively (Ken Lewtas, private communication, September 4th, 2015).
Page 18 of 47 3.3.1. Solubility
The polythermal data were used to establish the solubility for methyl stearate in dodecane,
kerosene and toluene solutions by extrapolation of the lines to 0°C/min. The solubility
was modelled according to the van’t Hoff equation given by expression (26). This expression
is derived from the general expression of solid-liquid equilibrium assuming that specific heat
capacity ( Cp) can be neglected. This assumption can be applied to the analysis of methyl
stearate solubility as according to previous work [39] Cp values does not change significant
within the temperature range studied here.
ln (26)
The strength of the solutions’ chemical interactions was assessed by comparing the solubility with the
ideal model solid-liquid equilibrium given by expression (27)
ln (27)
In these expressions is the mole fraction of the solute in the solution at saturation, is the
solution temperature, , are the molal enthalpy of dissolution and
fusion respectively,
, are the molal entropy of dissolution and
Page 19 of 47
A compounds molar solubility, can be related to the solubility of its ideal state through its
activity coefficient which is given by expression (28) obtained by equating the activity
at the solution’s equilibrium and that of its ideal state
Υ (28)
An activity coefficient equal to 1 indicates the solution behaves ideally i.e. the enthalpy of
dissolution is equal to zero, as the energy needed to break solute-solute interactions added to
that of breaking solvent-solvent interactions is equal to the energy released when solute-solvent
bonds are formed. On the other hand, if activity coefficient is either lower or higher than 1 this
would indicate a solution will dissolve more or less of the expected solute concentration at
equilibrium respectively. For forces of attraction between like molecules would be
favour over those of unlike molecules. For forces of attraction between unlike molecules
would be favour over those of unlike molecules. Deviations from a solutions’ ideal behaviour
can be due either to enthalpic or entropic factors and this can be established by comparing the
solubility van’t Hoff model line with that of the ideal solution under the same temperature
range. If the slopes of the lines are different, dissolution would be both enthalpic and entropic
driven. If the lines are parallel this would indicate that dissolution is only entropically driven.
3.3.2. Nucleation kinetics
Using the KBHR approach the analysis of nucleation kinetics, from polythermal experimental
Page 20 of 47 4.Results and discussion
4.1. Solubility
The average values for the collected crystallisation and dissolution temperatures
together with the corresponding standard deviations as a function of cooling rate and
concentration are presented in the SI. An example of the linear dependence of and on
is given in Fig. 3. The saturation temperature , obtained from the extrapolation to 0°C/min
of lines at each of the solution´s concentrations, are also shown in Table 1 of the SI.
The specific data points used to model the solubility according to the van´t Hoff equation are
given in Table 2. together with the corresponding enthalpy and entropy of dissolution and
mixing and . The activity coefficients and their modelled dependence on
temperature are also provided. Methyl stearate enthalpy and entropy of melting
are 53.94 and 0.17 respectively. The subtraction of these values from those of
enthalpy and entropy of dissolution delivered the corresponding values of enthalpy and entropy
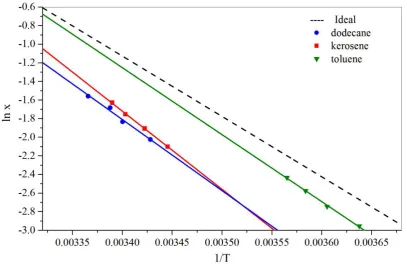
of mixing. The comparative van’t Hoff lines are given in Fig. 4.
van´t Hoff plots fit well to a linear model for all solutions studied. This indicates consistency
of structure of material, at the corresponding range of temperature. Activity coefficients are all
higher than one indicating that solute-solute interactions are stronger in all cases. However, the
significant lower values obtained in toluene together with the lowest enthalpy of mixing
suggest that in these solutions solute-solvent interactions are stronger than in the other two
Page 21 of 47
The highest solubility is observed in toluene and decreases as function of solvent in the
following order: toluene > kerosene > dodecane. This is in the same order of
polarity/aromaticity. Fatty acid methyl esters are organic compounds with medium polarity due
to the presence in their chemical structure of both a COO-alkyl group and a non-polar long
hydrocarbon chain. The solubility trend could be justified in terms of the solvent polarity and
the like-dissolves-like rule of thumb i.e. a non-polar compound will be dissolved by non-polar
solvents and vice versa. Straight chain n-alkanes such as dodecane with a dipole moment of
around 0.07 D [40] are non-polar molecules which will have lower affinity with methyl stearate
whose dipole moment calculated in vacuum ranges between 1.52 and 1.67 D. On the other
hand toluene will show better affinity due to a higher dipole moment equal to 0.36 D [40].
Kerosene is expected to deliver solubility higher than that of dodecane but lower than that
observed in toluene due to its composition that comprises different types of hydrocarbons
molecules including aromatic species.
According to this, it could be expected that dipole-dipole interaction between methyl stearate
and toluene molecules are stronger. Additionally, it has been hypothesised [40, 41] that the low
activity coefficients obtained in the case of toluene are likely to be , to a great extent, due to
the polarising effect created by the delocalised electron cloud around the benzene ring [41].
This could cause the distortion of the electron cloud around the solvent molecule inducing
temporary dipoles among solute-solvent molecules which can be quite strong interactions in
the case of the benzene ring, due to the effect of London dispersion forces [40]. This effect
appears to be manifested through the very low in toluene solvent, consistent with the
Page 22 of 47
The noticeable dependence of activities on temperature for kerosene solutions can be evidence
on the steep slope of the van’t Hoff line. Higher enthalpy and entropy of dissolution in this case
are likely to be due to the range of different compounds present in kerosene, especially the
aromatic molecules, which not only differ in size but will also complicate chemical interaction
with the solute.
4.2. Nucleation kinetics
The relative critical undercooling at the corresponding concentrations and cooling rates are
presented in Table 1 of the SI. For each of the four solution concentrations within each solvent
system a plot of cooling rate vs. relative critical undercooling in ln-ln coordinates
was then constructed to obtain the slope of the straight line fitting these data points according
to expressions (18 and 19).
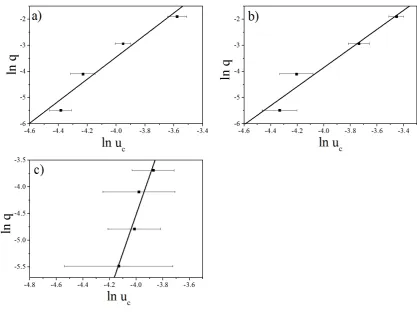
Fig. 5 presents an example of the plot obtained for a concentration of 250 g/L in dodecane and
kerosene solutions and for a concentration of 192 g/L in toluene solutions. The best linear
fitting to these data is given by , and
respectively. The slope and the correlation coefficient of the best-fit straight line to
the data for each concentration within the three solvent systems are presented in Table 3.
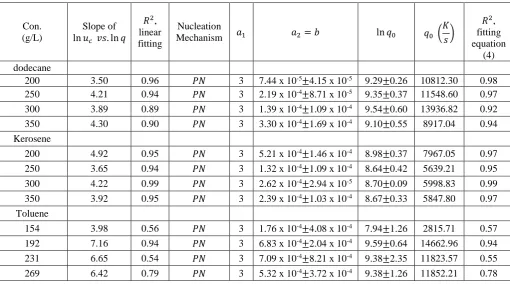
In all cases the slopes of the lines are higher than 3, suggesting that crystallisation of methyl
stearate proceeds via the mechanism. Thus, according to the approach, equation (4)
should describe the experimental data plotted in vs. coordinates. The values of
Page 23 of 47
of the solution concentrations, within each solvent system these values along with the
correlation coefficients for the fitting of equation (4) to the experimental are given.
The best-fit curves between the experimental values and those calculated from equation
(4) were obtained by setting . An example of such a curve for the concentration of 250
g/l in dodecane and kerosene solutions and for a concentration of 192 g/l in toluene solution is
presented in Fig. 6.
Even though a much lower range of cooling rates was used for the toluene solvent (0.25 to
1.5 °C/min compared to 0.25 to 9 °C/min for the other two solvents) the low values of ,
suggest that both relationships given by equations (4) and (18) are not followed. Thus, in this
particular case further analysis could be undertaken by solving numerically equation (8) in
the SM. The numerical solution of this equation would allow nucleation kinetic parameters
to be obtained that would give a better fit regarding the dependence of the relative volume of
crystals on the relative critical undercooling. Comparison of this trend line with the
corresponding experimental data would provide an insight into whether this system can be
better analysed using this more rigorous approach when compared to the constraints inherent
in the analytical solution. In particular, such constraints describe only the early stages of
crystallisation over which concentration can be assumed to remain virtually unchanged and
hence the dependence of and on and can be effectively ignored. If this is the case
the solution viscosity could also be assumed to remain virtually unchanged on cooling.
Nonetheless, the analysis was still performed for toluene solutions for comparison with the
Page 24 of 47
According to equation (8) equals , a dimensionless thermodynamic parameter defined by
equation (10) from which the can be calculated. The results obtained for ln yield the
values of , a parameter related through equation (9) to the nucleation rate constant and
the number of crystallites at the detection point.
The effective interfacial tension was evaluated from equation (10), using
[42], the calculated equilibrium temperatures , the shape factor for spherical
nuclei and the molecular latent heat of crystallisation estimated to be ,
and for methyl stearate crystallising from dodecane, kerosene and
toluene respectively. These values were calculated assuming the enthalpy of dissolution
obtained from the solubility data can be equated to the enthalpy of crystallisation. In addition
to this, the critical nucleus radius and number of molecules were obtained from equation
(21) and (22) respectively, calculated at levels obtained using values corresponding to
the extrapolation to 0°C/min of lines, at each of the four concentrations within each
solvent system. The results are given in Table 4.
The low values of the effective interfacial tension are an indication of a prevalence of
heterogeneous nucleation ( mechanism for the nucleation of the methyl stearate
crystallites regardless of the solution environment and are within the same order of magnitude
of values reported earlier for n-alkanes [43-46].
The number of crystallites formed at the detection point , at a given crystallisation
temperature can be obtained by performing a mass balance using the van’t Hoff models derived
for each solvent system. Thus, using the corresponding values of mole fraction, the mass of
Page 25 of 47
parameter in the molar fraction relationship. The mass of C18:0 in the solid phase per unit
volume is therefore the difference between the mass of C18:0 in the initial solution and the
mass in solution at the corresponding crystallisation temperature. This value can be converted
to volume by dividing the mass of the solute in the solid phase by the corresponding density.
Finally, the number of nuclei per unit volume i.e. as a function of solvent and solution
concentration can be estimated from dividing the total volume of solid by the volume of a
single nucleus. The latter can be obtained using the values of the critical radius assuming
spherical nuclei.
Following this, the nucleation rate constants and nucleation rates can be calculated from
equation (9) and (23) respectively using , the corresponding equilibrium temperatures
, values of the dimensionless thermodynamic parameter and values of the parameter for
C18:0 as a function of solvent and concentration. A summary of these results is given in Table
4. The trend of these parameters is also shown in Fig. 4 of the SI.
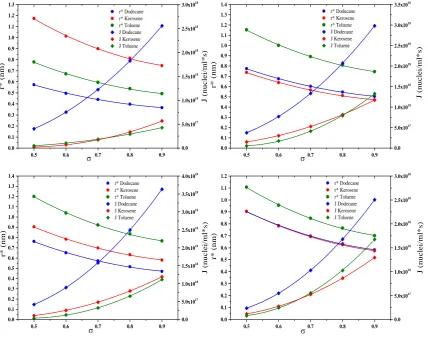
Fig. 7 provides a comparison of the trend of nucleation rates together with the critical radius
on an iso-supersaturation basis. values were calculated using the interfacial tension
obtained for each of the solutions’ concentration studied at the corresponding levels.
4.2.1. Nucleation at the detection point
Nucleation rates are observed to be higher in kerosene where the supersaturation levels at
which nucleation is detected are greater than in the other two solvents (Table 5.). The lowest
Page 26 of 47
tensions observed in this case, where the flatter nature of the slopes of the lines show that
nucleation proceeds more progressively or is a more thermodynamically controlled process.
This is likely to be the result of the highest solubility of C18:0 in toluene which would favour
solute-solvent interactions over solute-solute ones. In addition to this, in toluene systems the
fraction of methyl stearate that remains in solution at the corresponding crystallisation
temperatures, are lower in comparison to those in the other two solvent systems (Table 4), as
crystallisation occurs at lower temperatures in this case. Thus, given that interfacial tensions
are inversely related to , higher resistance to nucleation should be expected. In these solutions
a sufficient level of supersaturation is then required to overcome the free energy for nucleus
formation evidenced in the high levels of , which compares to those observed in kerosene
where nucleation rates are at least one order of magnitude higher that in toluene.
Given that lower levels of interfacial tensions were observed in kerosene followed by dodecane
solutions, it is likely that in these solvents nucleation is controlled, either by the attachment
frequency or the concentration of nucleation sites . This could indicate that either volume
diffusion or interface transfer of building units (molecules) would be rate limiting according to
expressions (24) and (25). In the case of kerosene solvent, these conclusions are in line with a
higher range of at which higher values were observed in comparison to dodecane
solutions, allowing for both sufficient driving force nucleation and solute availability in
solution that would reduce interfacial tension.
Interestingly, although similar values of interfacial tension to those of kerosene systems were
obtained in dodecane solutions, the nucleation rates in the latter case where significantly lower
Page 27 of 47
solvent-solute intermolecular interaction, due to the non-polar nature of dodecane molecules,
the diffusion of solute molecules should not be rate limiting and therefore sufficient levels of
attachment frequency should be possible to reach. Based on these observations and accounting
for the definition of nucleation rate given by equation (23), it is likely that in these systems
nucleation rates are then hindered by the availability of nucleation sites , due to the lower
solubility of methyl steareate in dodecane that would allow a lower amount of solute per unit
volume.
4.2.2. Nucleation at the same levels of supersaturation
If the analysis is performed comparing nucleation parameters at equal levels of solution
supersaturation (Fig. 7), nucleation rates are higher in dodecane followed by kerosene and
toluene solvent. The differences between dodecane and both kerosene and toluene solutions
rates increase with an increase in up to even one order of magnitude at supersaturations
higher than 80%. In general the critical nucleus radius is higher in toluene followed by kerosene
and dodecane solutions, although this trend changes at the lowest and highest solution
concentration studied in which kerosene solutions shows the highest and lowest values of this
parameter respectively.
Given that the critical nucleus radius are directly related to interfacial tension, these
observations confirm that interfacial tensions are rate limiting in toluene solvent over all the
range of supersaturations chosen. Interfacial tensions in kerosene are closer in magnitude to
those observed in dodecane solvent, while delivering nucleation rates closer in magnitude to
those observed in toluene solutions. The latter complement the discussion presented in the
Page 28 of 47
kerosene, which comprises molecules of different types including paraffins, cycloalkanes and
aromatics, that could hinder the diffusion processes associated with molecular attachment into
the nucleus and therefore decrease the attachment frequency .
Interfacial tensions were observed to be the highest in kerosene at the lowest solution
concentration becoming closer to those observed in dodecane and below to those of toluene
solutions as solutions concentration increases. This could be associated with an increase in the
thermodynamic barrier to nucleation at lower concentrations where solute-solvent interactions
would be favoured.
In the case of dodecane solutions the lowest values of interfacial tensions are in line with a
more kinetically controlled process as discussed in section (4.2.1). The lower values of this
parameter can be associated with the lower solubility of C18:0 in dodecane that favour
solute-solute interactions. Likewise, attachment frequencies should be favoured by an easy
de-solvation process due to the low solute-solvent strength interactions indicating that nucleation
is likely to be hindered by the low values of .
The differences in the tendency observed when nucleation is analysed at the detection points
in comparison to the same levels suggests that the complex composition of kerosene solvent
significantly influence the nucleation process. In this case the role of thermodynamic and
kinetics is more interconnected due to the different type of intermolecular interactions that
would affect de-solvation and diffusion process as well as solubility.
A summary of the obtained solubility and nucleation kinetics parameters as well as some
Page 29 of 47
5. CONCLUSIONS
The solubility and nucleation of methyl stearate crystallising from dodecane, kerosene and
toluene was studied. Solutions of C18:0 in all cases show lower solubility than that of an ideal
solution with the highest solubility obtained in toluene followed by kerosene and dodecane
solvents. The analysis showed that in all cases a progressive nucleation mechanism and
crystallite interfacial tension values between 0.94-1.55, 1.21 - 1.52 and 1.18-1.88
for methyl stearate crystallising from dodecane, kerosene and toluene respectively. Nucleation
rates calculated using the obtained values of and the number of crystals at the detection
point ranged between 4.56 x 10¹⁶ and 1.79 x 10¹⁷ , with the highest rates predicted
for methyl stearate crystallising from kerosene solutions. This trend changes when the analysis
is performed at the same levels where nucleation rates were the highest in dodecane solvent.
This is effect is thought to be due to the complex nature of kerosene in which the interplay
between de-solvation, diffusion process and solubility plays a more important role.
Page 30 of 47
The authors gratefully acknowledge Infineum Ltd. for the funding of this research which forms
part of the doctoral studies of one of us (D.C.).
We also gratefully acknowledge the UK´s EPSRC for the support of nucleation and crystal
growth research at Leeds and Manchester through funding the Critical Mass Project:
Molecules, Clusters and Crystals (Grant references EP/IO14446/1 and EP/IO13563/1).
The research on the analysis of nucleation data using the polythermal method was inspired by
Professor Dimo Kashchiev (Institute of Physical Chemistry, Bulgarian Academy of Sciences)
during his sabbatical leave in Leeds (Leverhulme Trust, Grant F10100A). We are most grateful
to him for his insightful contribution to this research area.
Page 31 of 47
Dimensionless molecular latent heat of crystallisation
Solution activity
Surface area of nucleus
Dimensionless thermodynamic parameter
Equilibrium nucleus concentration
Concentration of nucleation sites or instantaneously nucleated crystallites
Attachment frequency of monomers to the nucleus
Nucleation rate
Nucleation rate constant
Nucleus numerical shape factor
Crystallite growth exponent
Detectable number of crystallites
Cooling rate
Parameter in the dependence for both and
Parameter in equation (10) related to
Solution temperature
Crystallisation temperature
Equilibrium dissolution temperature
Solution saturation (or equilibrium) temperature
Critical undercooling for crystallisation
Volume of solute molecule in crystal
Volume of solution
Mole fraction of solute in solution
Page 32 of 47
Ideal equilibrium mole fraction
Concentration of colliding building units
zeldovich factor
Molal enthalpy of melting
Molal entropy of melting
Molal enthalpy of dissolution
Molal entropy of dissolution
Molal enthalpy of mixing
Molal entropy of mixing
Number of molecules in critical nucleus
Critical nucleus radius
Relative supersaturation
Critical relative supersaturation
Relative critical undercooling for crystallisation
Activity coefficient
Effective interfacial tension of crystal nucleus in
Molecular latent heat of crystallisation
Density
Sticking coefficient
Positive number in expression (10)
Transfer frequency of building units from adsorbed to integrated
Page 33 of 47
Heterogeneous nucleation
Homogeneous nucleation
Instantaneous nucleation
Kashchiev-Borissova-Hammond-Roberts approach
Metastable zone width
Progressive nucleation
Standard deviation
Page 34 of 47 Supplementary Information. Additional and more detailed materials are provided as a
supplement to the paper including: comparative schemes for the isothermal or the polythermal
method based on a concentration vs temperature profile, the full derivation of the set of
expressions that comprise the approach , kerosene n-alkanes chain length distribution,
temperature calibration lines for the Crystal 16 unit , flow chart describing how to apply the
KBHR approach for the analysis of nucleation kinetics from polythermal experimental data,
experimental crystallisation and dissolution temperatures as a function of cooling rate
and comparative figures of nucleation kinetics parameters for methyl stearate crystallising
Page 35 of 47 REFERENCES
[1] D. Kashchiev, A. Borissova, R.B. Hammond, K.J. Roberts, Dependence of the critical
undercooling for crystallization on the cooling rate, J Phys Chem B, 114 (2010) 5441-5446.
[2] D. Kashchiev, A. Borissova, R.B. Hammond, K.J. Roberts, Effect of cooling rate on the
critical undercooling for crystallization, J Cryst Growth, 312 (2010) 698-704.
[3] D. Camacho, A. Borissova, R. Hammond, D. Kashchiev, K. Roberts, K. Lewtas, I. More,
Nucleation mechanism and kinetics from the analysis of polythermal crystallisation data:
methyl stearate from kerosene solutions, Crystengcomm, 16 (2014) 974-991.
[4] M. Rubbo, J.N. Sherwood, An Improved Method for the Measurement of the Rates of
Growth and Dissolution of Crystals Under Isothermal Conditions, Journal of Crystal Growth,
61 (1983) 210-214.
[5] R. Boistelle, Calculation of the adsorption energies of n-alkane molecules on the (001) face
of crystals of long-chain even n-alkanes, Jornal of Crystal Growth, 43 (1978) 141-147.
[6] B. Simon, A. Grassi, R. Boistelle, Cinétique de Croissance de la Face (110) de la Paraffine
C36H74 en Solution, Journal of Crystal Growth, 26 (1974) 77-89.
[7] M. Rubbo, R. Boistelle, Dissolution and Growth-Kinetics of the (001) Faces of
Normal-Hexatriacontane Crystals Grown from Heptane, Journal of Crystal Growth, 51 (1981) 480-488.
[8] H.E. Lundagermadsen, R. Boistelle, Growth-Kinetics of the (001) Faces of Hexatriacontane
(C36H74) in Solution, Journal of Crystal Growth, 46 (1979) 681-690.
[9] W. Beckmann, R. Boistelle, Growth Kinetics of the (110) Face of Stearic Acid Growing
from Butanone Solutions_Pure Solutions and in the Presence of an Emulsifier, Journal of
Page 36 of 47
[10] R. Boistelle, D. Aquilano, Interaction Energy and Growth Mechanisms on Twinned and
Polytypic Crystals of Long-Chain Even Normal-Alkanes . I. Interaction-Energy Calculations,
Acta Crystallogr A, 33 (1977) 642-648.
[11] R. Boistelle, B. Simon, G. Pepe, Polytypic Structures of C28H58 (Octacosane) and
n-C36H74 (Hexatriacontane), Acta Crystallographica Section B-Structural Science, 32 (1976)
1240-1243.
[12] R. Boistelle, H.E.L. Madsen, Solubility of Long-Chain N-Alkanes in Petroleum Ether, J
Chem Eng Data, 23 (1978) 28-29.
[13] H.E. Lundagermadsen, R. Boistelle, Solubility of long-chain n-paraffins in pentane and
heptane, J. Chem. Soc., Faraday Trans. 1, 72 (1976) 1078-1081.
[14] H.E.L. Madsen, R. Boistelle, Solubility of Octacosane and Hexatriacontane in Different
Normal-Alkane Solvents, J Chem Soc Farad T 1, 75 (1979) 1254-1258.
[15] R. Boistelle, A. Doussoulin, Spiral Growth Mechanisms of (110) Faces of Octacosane
Crystals in Solution, Journal of Crystal Growth, 33 (1976) 335-352.
[16] N.U.S. Jr, V.P. Migo, K. Sato, M. Matsumura, Crystallization behavior of neat biodiesel
and biodiesel treated with ozonized vegetable oil, European Journal of Lipid Science and
Technology, 107 (2005) 689-696.
[17] C. Boshui, S. Yuqiu, F. Jianhua, W. Jiu, W. Jiang, Effect of Cold Flow Improvers on Flow
Properties of Soybean Biodiesel Biomass and Bioenergy 34 (2010) 1309-1313.
[18] E. Odeigah, R.B. Janius, R. Yunus, Factors Affecting the Cold Flow Behaviour of
Biodiesel and Methods for Improvement-A Review Pertanika J. Sci. & Technolog. , 20 (1)
(2012) 1-14.
[19] R.O. Dunn, M.W. Shockley, M.O. Bagby, Improving the Low Temperature Properties of
Page 37 of 47
[20] J.A.P. Coutinho, K. Knudsen, S.I. Andersen, E.H. Stenby, A local composition model for
paraffinic solid solutions, Chemical Engineering Science, 51 (1996) 3273-3282.
[21] J.A.P. Coutinho, F. Mirante, J. Pauly, A new predictive UNIQUAC for modeling of wax
formation in hydrocarbon fluids, Fluid Phase Equilibria, 247 (2006) 8-17.
[22] J.A.P. Coutinho, C. Dauphin, J.L. Daridon, Measurements and modelling of wax
formation in diesel fuels, Fuel, 79 (2000) 607-616.
[23] J. Pauly, J.L. Daridon, J.M. Sansot, J.A.P. Coutinho, The pressure effect on the wax
formation in diesel fuel, Fuel, 82 (2003) 595-601.
[24] J.C.A. Lopes, Et.al., Prediction of Cloud Points of Biodiesel, Energy & Fuels, 22 (2008)
747-752.
[25] J.A.P. Coutinho, M. Gonc-alves, M.J. Pratas, M.L.S. Batista, V.F.S. Fernandes, J. Pauly,
J.L. Daridon, Measurement and modeling of biodiesel cold-flow properties, Energy & Fuels,
24 (2010) 2667-2674.
[26] J.M. Prausnitz, Molecular thermodynamics of fluid-phase equilibria, Prentice-Hall Inc.,
Englewood Cliffs N. J., 1969.
[27] J.H. ter Horst, S. Jiang, Crystal nucleation rates from probability distributions of
inductions times Crystal Growth and Design, 11 (2011) 256-261.
[28] Y. Xiao, S.K. Tang, H. Hao, R. Davey, T. Vetter, Quantifying the inherent uncertainty
associated with nucleation rates estimated from induction time data measured in small volumes,
Cryst Growth Des, 17 (2017) 2852-2863.
[29] J. Nyvlt, Kinetics of nucleation in solutions J Cryst Growth, 4 (1968) 377-383.
[30] J. Nyvlt, R. Rychly, J. Gottfried, J. Wurzelova, Metastable Zone Width of some aqueous
solutions J Cryst Growth, 6 (1970) 151-162.
[31] N. Kubota, A new interpretation of metastable zone widths measured for unseeded
Page 38 of 47
[32] K. Sangwal, A novel self-consistent Nyvlt-like equation for metastable zone width
determined by the polythermal method Crystal Research and Technology, 44 (2009) 231-247.
[33] K. Sangwal, Recent developments in understanding of the metastable zone width of
different solute-solvent systems Journal of Crystal Growth, 318 (2001) 103-109.
[34] N.A. Mitchel, P.J. Frawley, Nucleation kinetics of paracetamol–ethanol solutions from
metastable zone widths, Jornal of Crystal Growth, 312 (2010) 2740-2746.
[35] D.G. Blackmond, Reaction progress kinetics analysis: a powerful methodology for
mechanistic studies of complex catalytic reactions, Angewandte Chemie-International Edition,
44 (2005) 4302-4320.
[36] D. Kashchiev, A. Firoozabadi, Induction time in crystallisation of gas hydrates, Journal of
Crystal Growth, 250 (2003) 499-515.
[37] D. Kashchiev, Nucleation basic theory with applications, in, Butterworth Heinemann,
Oxford ; Boston, 2000.
[38] D. Kashchiev, Nucleation: basic theory with applications, Butterworth-Heinemann,
Oxford, 2000.
[39] Q. Hussain, Crystallisation of long chain methyl esters in relation to their cold flow
behaviour, in: School of Process Environmental and Materials Engineering, University of
Leeds, Leeds, 2012.
[40] J.J. Scheepers, E. Muzenda, M. Belaid, Influence of structure on fatty acid ester-alkane
interactions, International Conference on Chemical Engineering and its Applications, (2012)
93-102.
[41] J.J. Scheepers, E. Muzenda, M. Belaid, Influence of temperature and molecular structure
on organics-biodiesel interactions using group contribution methods Proceedings - World
Page 39 of 47
[42] C.H. MacGillavry, M. Wolthuis-Spuy, Crystal structure of an Orthorhombic Modification
of Methyl Stearate, Acta Crystallographica B26 (1970) 645-648.
[43] D. Turnbull, R.L. Cormia, Kinetics of crystal nucleation in some normal alkanes liquids
The Journal of Chemical Physics, 34 (1961) 820-831.
[44] K.J. Roberts, J.N. Sherwood, A. Stewart, The Nucleation of n-Eicosane Crystals from
Solutions in n-Dodecane in the Presence of Homologous Impurities, Journal of Crystal Growth,
102 (1990) 419-426.
[45] A.R. Gerson, K.J. Roberts, J.N. Sherwood, An Instrument for the Examination of
Nucleation from Solution and Its Application to the Study of Precipitation from Diesel Fuels
and Solutions of Normal-Alkanes, Powder Technol, 65 (1991) 243-249.
[46] B.D. Chen, L.J. Brecevic, J. Garside, Nucleation of tetracosane in hydrocarbon solvents,
Page 40 of 47 Tables and Figures
Table 1. Composition of Kerosene from 2D Gas Chromatography analysis performed by Infineum UK
Hydrocarbon Mass %
Paraffins unbranched alkanes 16.29
Iso-paraffins 23.04
Cycloalkanes Naphthenes 42.40
Aromatics
Alkyl Benzenes 7.60
Benzocycloparaffins 6.80
Naphthalenes 3.43
Biphenyls/acenaphthenes 0.30
Fluorenes 0.15
Table 2. Solubility, enthalpy and entropy of dissolution and mixing for methyl stearate in three different solvents, together with corresponding activity coefficients. Parameters values obtained by modelling solubility data according to the van´t Hoff plot. (The errors of the slope and the intercept for enthalpy and entropy of dissolution refer to the 95% confidence interval)
Solvent
ln
dodecane
18.70 0.132
63.55 ± 10.860 0.20 ± 0.037 9.61 0.03 2.01
21.09 0.160
22.18 0.186
24.12 0.210
Kerosene
17.25 0.123
69.80 ±2.874 0.22 ± 0.098 15.87 0.05 1.85
19.21 0.149
20.86 0.173
22.01 0.196
Toluene
1.90 0.052
59.84 ± 3.785 0.19 ± 0.014 5.90 0.02 1.14
4.36 0.064
6.04 0.076
[image:41.595.30.571.353.564.2]Page 41 of 47 Table 3. Slopes of the best linear fit to data points in vs. coordinates and correlation coefficients; values of the free parameters obtained from the data fitting in vs. coordinates according to equation (4) and correlation coefficients (the errors of the slope and the free parameters refer to the 95% confidence interval)
Con. (g/L)
Slope of
ln ln
, linear fitting
Nucleation
Mechanism ln
, fitting equation
(4) dodecane
200 3.50 0.96 3 7.44 x 10⁻⁵ 4.15 x 10⁻⁵ 9.29 0.26 10812.30 0.98
250 4.21 0.94 3 2.19 x 10⁻⁴ 8.71 x 10⁻⁵ 9.35 0.37 11548.60 0.97
300 3.89 0.89 3 1.39 x 10⁻⁴ 1.09 x 10⁻⁴ 9.54 0.60 13936.82 0.92
350 4.30 0.90 3 3.30 x 10⁻⁴ 1.69 x 10⁻⁴ 9.10 0.55 8917.04 0.94
Kerosene
200 4.92 0.95 3 5.21 x 10⁻⁴ 1.46 x 10⁻⁴ 8.98 0.37 7967.05 0.97
250 3.65 0.94 3 1.32 x 10⁻⁴ 1.09 x 10⁻⁴ 8.64 0.42 5639.21 0.95
300 4.22 0.99 3 2.62 x 10⁻⁴ 2.94 x 10⁻⁵ 8.70 0.09 5998.83 0.99
350 3.92 0.95 3 2.39 x 10⁻⁴ 1.03 x 10⁻⁴ 8.67 0.33 5847.80 0.97
Toluene
154 3.98 0.56 3 1.76 x 10⁻⁴ 4.08 x 10⁻⁴ 7.94 1.26 2815.71 0.57
192 7.16 0.94 3 6.83 x 10⁻⁴ 2.04 x 10⁻⁴ 9.59 0.64 14662.96 0.94
231 6.65 0.54 3 7.09 x 10⁻⁴ 8.21 x 10⁻⁴ 9.38 2.35 11823.57 0.55
269 6.42 0.79 3 5.32 x 10⁻⁴ 3.72 x 10⁻⁴ 9.38 1.26 11852.21 0.78
Table 4. Nucleation kinetics parameters and nucleation rates for methyl stearate crystallising from three different solvents at four different solution concentrations. The critical radius, number of crystals at the detection point and nucleation rates are calculated at corresponding to values obtained by the extrapolation to 0°C/min of lines is the equilibrium solubility, the relative critical undercooling, is the fraction of methyl stearate that remains in solution at the corresponding crystallisation temperatures, is relative supersaturation, is interfacial tension, is the critical nucleus radius, is the number of molecules in the critical radius, is the number of crystals at the detection point and the nucleation rate
Solvent
dodecane
0.132 0.010 0.10 0.32 0.94 0.84 5 2.43 x10¹⁹ 6.70 x 10¹⁶
0.160 0.013 0.12 0.37 1.35 0.99 8 2.07 x 10¹⁹ 9.04 x 10¹⁶
0.186 0.011 0.13 0.38 1.16 0.98 8 2.57x 10¹⁹ 1.06 x 10¹⁷
0.210 0.015 0.15 0.44 1.55 1.00 8 3.16 x 10¹⁹ 1.27 x 10¹⁷
Kerosene
0.123 0.017 0.07 0.66 1.91 0.94 7 2.64x 10¹⁹ 1.24 x 10¹⁷
0.149 0.014 0.10 0.50 1.21 0.74 4 5.83 x 10¹⁹ 1.48 x 10¹⁷
0.173 0.015 0.11 0.55 1.52 0.84 5 5.11 x 10¹⁹ 1.79 x 10¹⁷
0.196 0.015 0.13 0.54 1.48 0.85 5 5.47 x 10¹⁹ 1.68 x 10¹⁷
Toluene
0.052 0.016 0.03 0.55 1.18 0.73 3 3.93 x 10¹⁹ 7.08 x 10¹⁶
0.064 0.016 0.04 0.49 1.86 1.17 14 1.08 x 10¹⁹ 4.56 x 10¹⁶
0.076 0.017 0.05 0.58 1.88 1.07 10 1.87 x 10¹⁹ 1.04 x 10¹⁷
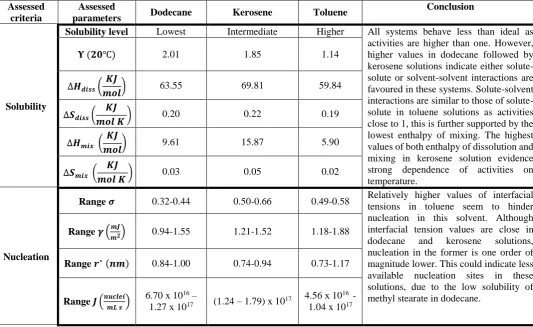
[image:42.595.41.545.511.688.2]Page 42 of 47 Table 5. Summary of parameters obtained through the combined assessment of solubility, and nucleation kinetics of methyl stearate in three different solvents. is the activity coefficient, and are the enthalpy and entropy of dissolution respectively, and are the enthalpy and entropy of mixing respectively, is the interfacial tension, is the nucleus critical radius and is the nucleation rate
*These results are presented together with those obtained for the assessment of morphology and crystal growth kinetics, for the same solutions’ systems, in Camacho D.M. et al., Morphology and Growth of methyl stearate as a function of crystallisation environment, Cryst. Growth Des., (2017), 17, 563-575
Assessed criteria
Assessed
parameters Dodecane Kerosene Toluene
Conclusion
Solubility
Solubility level Lowest Intermediate Higher All systems behave less than ideal as
activities are higher than one. However, higher values in dodecane followed by kerosene solutions indicate either solute-solute or solvent-solvent interactions are favoured in these systems. Solute-solvent interactions are similar to those of solute-solute in toluene solutions as activities close to 1, this is further supported by the lowest enthalpy of mixing. The highest values of both enthalpy of dissolution and mixing in kerosene solution evidence strong dependence of activities on temperature.
2.01 1.85 1.14
63.55 69.81 59.84
0.20 0.22 0.19
9.61 15.87 5.90
0.03 0.05 0.02
Nucleation
Range 0.32-0.44 0.50-0.66 0.49-0.58 Relatively higher values of interfacial
tensions in toluene seem to hinder nucleation in this solvent. Although interfacial tension values are close in dodecane and kerosene solutions, nucleation in the former is one order of magnitude lower. This could indicate less available nucleation sites in these solutions, due to the low solubility of methyl stearate in dodecane.
Range 0.94-1.55 1.21-1.52 1.18-1.88
Range 0.84-1.00 0.74-0.94 0.73-1.17
Range 6.70 x 10
16–
1.27 x 10¹⁷ (1.24 – 1.79) x 1017
Page 43 of 47 Fig. 1 Comparative scheme of the different approaches used to collect experimental crystallisation temperatures using both the isothermal and the polythermal methods
Fig. 2 a) Typical experimental profile using Crystal 16® by applying the polythermal method. b) Representative turbidity profile in transmittance vs. temperature coordinates obtained by the application of a polythermal method
0 20 40 60 80 100 120 -20 -15 -10 -5 0 5 10 15 20 25 30 35 40 45
00:00:00 04:48:00 09:36:00 14:24:00 19:12:00
T ra n sm it ta n ce ( % ) T e m p e ra tu re ( °C ) Time (hours) Temperature Profile Turbidity Profile 0 20 40 60 80 100 120
-20 -15 -10 -5 0 5 10
tra ns m it a nce %
Temperature (°C)
[image:44.595.82.524.439.583.2]Page 44 of 47 Fig. 3 Crystallisation and dissolution temperatures as a function of cooling rate for solution concentrations of 250 g/L for methyl stearate crystallising from dodecane and kerosene solvents and of 192 g/L for methyl stearate crystallising from toluene solvent
Fig. 4 van’t Hoff plot for methyl stearate in three different diesel type solvents. Solid lines represent experimental solubilities and the dashed line the ideal solubility. Experimental solubilities were obtained by extrapolation to 0ºC of
[image:45.595.95.503.435.702.2]Page 47 of 47 Fig. 7 Tendency of critical radius and nucleation rates as a function of supersaturation for C18:0 growing from dodecane, kerosene and toluene solvents using parameters derived for the range of concentrations studied. Concentration increases from left to right and from top to bottom
0.5 0.6 0.7 0.8 0.9
0.0 0.1 0.2 0.3 0.4 0.5 0.6 0.7 0.8 0.9 1.0 1.1 1.2 1.3 r* Dodecane r* Kerosene r* Toluene J Dodecane J Kerosene J Toluene r* ( n m) 0.0 5.0x10¹⁷ 1.0x10¹⁸ 1.5x10¹⁸ 2.0x10¹⁸ 2.5x10¹⁸ 3.0x10¹⁸ J (n u c le i/ ml * s)
0.5 0.6 0.7 0.8 0.9
0.0 0.1 0.2 0.3 0.4 0.5 0.6 0.7 0.8 0.9 1.0 1.1 1.2 1.3 1.4 r* Dodecane r* Kerosene r* Toluene J Dodecane J Kerosene J Toluene r* ( n m) 0.0 5.0x10¹⁷ 1.0x10¹⁸ 1.5x10¹⁸ 2.0x10¹⁸ 2.5x10¹⁸ 3.0x10¹⁸ 3.5x10¹⁸ J (n u c le i/ ml * s)
0.5 0.6 0.7 0.8 0.9
0.0 0.1 0.2 0.3 0.4 0.5 0.6 0.7 0.8 0.9 1.0 1.1 1.2 1.3 1.4 r* Dodecane r* Kerosene r* Toluene J Dodecane J Kerosene J Toluene r* ( n m) 0.0 5.0x10¹⁷ 1.0x10¹⁸ 1.5x10¹⁸ 2.0x10¹⁸ 2.5x10¹⁸ 3.0x10¹⁸ 3.5x10¹⁸ 4.0x10¹⁸ J (n u c le i/ ml * s)
0.5 0.6 0.7 0.8 0.9