STEM CELLS AND REGENERATION TECHNIQUES AND RESOURCES ARTICLE
Optimized inducible shRNA and CRISPR/Cas9 platforms for
in vitro
studies of human development using hPSCs
Alessandro Bertero1,2,‡,§,¶, Matthias Pawlowski1,3,§, Daniel Ortmann1,2,§, Kirsten Snijders1,2, Loukia Yiangou1,4, Miguel Cardoso de Brito1,2, Stephanie Brown1,2, William G. Bernard1,4, James D. Cooper1,4, Elisa Giacomelli1,2, Laure Gambardella1,4, Nicholas R. F. Hannan1,2,*, Dharini Iyer1,4, Fotios Sampaziotis1,2, Felipe Serrano1,4, Mariëlle C. F. Zonneveld1,2, Sanjay Sinha1,4, Mark Kotter1,3and Ludovic Vallier1,2,5,¶
ABSTRACT
Inducible loss of gene function experiments are necessary to uncover mechanisms underlying development, physiology and disease. However, current methods are complex, lack robustness and do not work in multiple cell types. Here we address these limitations by developing single-step optimized inducible gene knockdown or knockout (sOPTiKD or sOPTiKO) platforms. These are based on genetic engineering of human genomic safe harbors combined with an improved tetracycline-inducible system and CRISPR/Cas9 technology. We exemplify the efficacy of these methods in human pluripotent stem cells (hPSCs), and show that generation of sOPTiKD/KO hPSCs is simple, rapid and allows tightly controlled individual or multiplexed gene knockdown or knockout in hPSCs and in a wide variety of differentiated cells. Finally, we illustrate the general applicability of this approach by investigating the function of transcription factors (OCT4andT), cell cycle regulators (cyclin D family members) and epigenetic modifiers (DPY30). Overall, sOPTiKD and sOPTiKO provide a unique opportunity for functional analyses in multiple cell types relevant for the study of human development.
KEY WORDS: Human pluripotent stem cells, shRNA, CRISPR/Cas9, OCT4, POU5F1, T, brachyury, DPY30
INTRODUCTION
Loss-of-function experiments in human pluripotent stem cells [hPSCs; comprising human embryonic stem cells (hESCs) or human induced pluripotent stem cells (hiPSCs)] provide a unique opportunity to study the mechanisms that regulate human development, physiology and disease (Avior et al., 2016; Pourquié et al., 2015; Zhu and Huangfu, 2013). However,
functional genomic applications of hPSCs are currently limited by the lack of an easy and efficient method to conditionally manipulate gene expression in both hPSCs and hPSC-derived cells. Indeed, such a system is necessary both for the study of genes essential for hPSC self-renewal and for functional analyses at specific stages of differentiation.
Historically, the expression of inducible short hairpin RNAs (shRNAs) has been the most popular method to trigger gene knockdown in human cells. This has been achieved using a TET-ON system, which relies on a modified RNA polymerase (Pol) III promoter that is responsive to a tetracycline-sensitive repressor protein (tetR) to induce shRNA expression by simple tetracycline (TET) treatment (Lambeth and Smith, 2013). Nevertheless, application of this TET-ON system in hPSCs has proved challenging for two main reasons: (1) tight control of shRNA expression is difficult to achieve, thereby resulting in uncontrolled knockdown; (2) induction of shRNA rarely works in differentiated derivatives. Indeed, very high and homogenous expression of both the tetR and the inducible shRNA is required to obtain potent yet controlled knockdown. However, transgene silencing is a recurring problem in hPSCs (Ellis, 2005; Herbst et al., 2012; Yao et al., 2004), and randomly integrated promoters are often subject to positional effects that can strongly limit their activity (Zafarana et al., 2009). Differentiation further increases the chances of silencing, as transgenes can be located in regions where heterochromatin forms following cell fate choices (Herbst et al., 2012; Raya et al., 2009). As a consequence, inducible shRNA expression in both hPSCs and a wide variety of their differentiated progenies has never been reported.
More recently, CRISPR/Cas9-mediated gene knockout has emerged as a powerful method to interrogate gene function (Wright et al., 2016), and inducible manipulation of gene expression in hPSCs using this approach has been reported (Chen et al., 2015; González et al., 2014; Mandegar et al., 2016). However, these methods are either very complex and time consuming, as they involve multiple genome editing steps that need to be individually tailored for each gene to be examined (Chen et al., 2015), or are not widely applicable in multiple differentiated cell types as they rely on inducible promoters that are not stably and homogeneously expressed following hPSC differentiation (González et al., 2014; Haenebalcke et al., 2013; Mandegar et al., 2016; Ordovas et al., 2015). Overall, there are currently no methods for inducible gene knockout in hPSCs that fulfill all the criteria described above.
Here we describe novel platforms for single-step optimized inducible gene knockdown or knockout (sOPTiKD or sOPTiKO) that address all the limitations of current inducible shRNA or CRISPR/Cas9 systems, thus providing powerful and scalable Received 31 March 2016; Accepted 7 October 2016
1
Wellcome Trust-MRC Stem Cell Institute, Anne McLaren Laboratory, University of
Cambridge, Cambridge, CB2 0SZ, UK.2
Department of Surgery, University of
Cambridge, Cambridge, CB2 0QQ, UK.3
Department of Clinical Neuroscience,
University of Cambridge, Cambridge, CB2 0QQ, UK.4
Division of Cardiovascular
Medicine, University of Cambridge, Cambridge, UK.5
Wellcome Trust Sanger Institute, Hinxton, CB10 1SA, UK.
*Present address: Centre for Biomolecular Sciences, University of Nottingham,
Nottingham, NG7 2RD, UK.‡Present address: Department of Pathology, University
of Washington, Seattle, WA 98109, USA. §
These authors contributed equally to this work ¶
Authors for correspondence ([email protected]; [email protected]) L.V., 0000-0002-3848-2602
This is an Open Access article distributed under the terms of the Creative Commons Attribution License (http://creativecommons.org/licenses/by/3.0), which permits unrestricted use, distribution and reproduction in any medium provided that the original work is properly attributed.
DEVEL
O
platforms that have the potential to greatly simplify the study of human gene function.
RESULTS
Validation of theROSA26andAAVS1loci as genomic safe harbors in hPSCs and their differentiated derivatives
We aimed to develop optimal conditional loss-of-function platforms using inducible shRNAs or guide RNAs (gRNAs) for CRISPR/ Cas9. We reasoned that inserting each element of the TET-ON system into a different genomic safe harbor (GSH; Sadelain et al., 2012) would maximize expression in hPSCs and their differentiated progenies while avoiding potential promoter interference (Shearwin et al., 2005). TheAAVS1and ROSA26loci appeared particularly suitable for this purpose as these GSHs have been suggested to
allow strong expression of various transgenes in hPSCs, including constitutively expressed shRNAs (DeKelver et al., 2010; Hockemeyer et al., 2009; Irion et al., 2007). We first improved the targeting efficiency for both GSHs by developing a CRISPR/ Cas9n-based gene-trap strategy to target the humanROSA26locus (Fig. 1A,B, Fig. S1A) and by refining an existing zinc-finger nuclease (ZFN)-based targeting strategy for the AAVS1 locus (Hockemeyer et al., 2009) (Fig. 1A,B). In both cases, hPSC targeting occurred with very high efficiency (59-100%; Table S1), while neither ROSA26 nor AAVS1 modifications resulted in chromosomal abnormalities (data not shown).
We then sought to identify the most efficient promoter to drive constitutive transgene expression from GSHs. We tested the ability of different promoter configurations to express an enhanced green
A
B
C
Neuroectoderm
Neural crest
Chondrocytes
Smooth muscle
Fibroblasts Neurons
Oligodendrocytes Astrocytes Osteocytes
Presomitic mesoderm
Lateral plate
mesoderm Epicardium
Definitive Endoderm Cardiac mesoderm
Cardiomyocytes
Intestine
Cholangiocytes Pancreas
Hepatocytes
Lung
Neuron
s
Neural crest Osteo
Chondro
SMC Epi Fib
ro
Cardio
Intestin
e
Pan
c
Cho
l
Hep Lung
100
101
102
103
104
EG
F
P
M
F
I
Fib
ro
Neuron
s
Neural crest Oste
o
Chondr
o
SMC E
p
i
Cardio
Intestine
Panc Cho
l
Hep Lung
0 50 75
25 100
%
E
G
F
P
p
o
si
ti
ve
H9 AAV ROSA 5’-HAR
Exon 1 SA pA pA
3’-HAR Neo CAG EGFP R26-prom
ROSA26 CAG-EGFP
Exon 2
5’-HAR
Exon 1 pA pA
3’-HAR Puro CAG EGFP AAV-prom
AAVS1 CAG-EGFP
Exon 2 SA-T2A
hPSCs GSH-EGFP hPSCs
Nucleofection OR lipofection Nuclease
A
Nuclease
B Drug selection +
clonal isolation Donor
EGFP
D
DAPIH9
ROSA-EGFP
AA
V
-EGFP
EGFP GFAP TUBB3
Neural differentiation
DAPI EGFP ACTN2 TNNT2
Cardiac differentiation
DAPI EGFP HNF4A ALB
[image:2.612.64.554.237.645.2]Liver differentiation
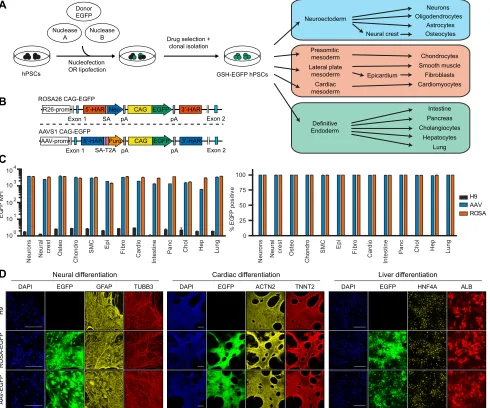
Fig. 1. Validation of theROSA26andAAVS1loci as bona fide genomic safe harbors.(A) Experimental approach behind the generation of genomic safe harbor (GSH) EGFP reporter hPSCs to test GSH expression during differentiation. Neurons, oligodendrocytes and astrocytes were obtained in bulk cultures containing a mixture of these cell lineages, whereas all other cell types were individually generated. (B)ROSA26andAAVS1EGFP reporter transgenic alleles. R26-prom,ROSA26locus promoter; AAV-prom,AAVS1locus promoter; 5′-HAR/3′-HAR, upstream/downstream homology arm; SA, splice acceptor; T2A, self-cleaving T2A peptide; Neo, neomycin resistance; Puro, puromycin resistance; pA, polyadenylation signal; CAG, CAG promoter. (C) Summary of EGFP flow cytometry quantification experiments in the indicated cell types generated from GSH EGFP reporter hPSCs (abbreviations indicate the lineages described in A). The percentage of EGFP-positive cells and the EGFP median fluorescence intensity (MFI) are reported. Wild-type hESCs (H9) were used as negative controls, and results are from two independent cultures per lineage. (D) Representative immunofluorescent stainings for lineage-specific markers in three of the mature cell types analyzed. EGFP fluorescence from the reporter lines is in green, and DAPI (blue) shows nuclear staining. Scale bars: 200μm.
DEVEL
O
fluorescent protein (EGFP) transgene from the ROSA26 locus in hESCs (Fig. S1A,B). The highest and most homogenous EGFP expression (100%) was achieved with the artificial CAG promoter (Fig. S1C-E), which was stronger by an order of magnitude than the endogenousROSA26promoter (Irion et al., 2007). Interestingly, and in contrast to previous reports (Ramachandra et al., 2011), we observed that theEF1α(EEF1A1) promoter was strongly silenced, as shown by mosaic EGFP expression (Fig. S1C-E). Similar results were obtained after EGFP targeting into theAAVS1locus (data not shown), thereby preventing the use of this promoter in subsequent experiments.
To further evaluate the robustness of the CAG promoter activity, we analyzed in detail hESCs with heterozygous or homozygous targeting of a CAG-EGFP transgene in theROSA26orAAVS1loci (Fig. 1A,B). For both GSHs EGFP was homogeneously expressed at high and comparable levels for more than 30 passages (Fig. S1F), and similar results were obtained after differentiation of hESCs into the three primary germ layers (Fig. S1G-M). Importantly, targeting did not interfere with pluripotency or differentiation, as shown by appropriate expression of lineage markers (Fig. S1N,O). We further differentiated these EGFP-hESC lines into fifteen different cell types (Fig. 1A), and both GSHs allowed homogeneous and strong EGFP expression in all cell types analyzed (Fig. 1C,D, Fig. S2). Overall, these results validate
the ROSA26 and AAVS1 loci as suitable for robust transgene
expression in both hPSCs and their derivatives.
Development of an optimized inducible knockdown platform in hPSCs
Having demonstrated the suitability of theROSA26andAAVS1loci for transgene expression, we developed a TET-ON inducible knockdown system based on dual GSH targeting (Fig. 2A, Fig. S3A). To simplify knockdown evaluation and method optimization we generated hESC lines in which an EGFP transgene could be silenced in an inducible fashion (Fig. 2B). To achieve this we targeted: (1) a CAG-tetR expression cassette into the
ROSA26locus; and (2) a CAG-EGFP transgene plus an inducible
EGFP shRNA cassette into the AAVS1 locus (Fig. 2A,B). Interestingly, we observed a strong and homogeneous decrease in EGFP fluorescence following tetracycline treatment for 5 days (>95%; Fig. 2C), thereby confirming efficient knockdown. However, a decrease in EGFP expression was also noticed in the absence of tetracycline (Fig. 2C), suggesting a significant leakiness in the expression of the shRNA and thus confirming previous reports (Henriksen et al., 2007).
We then hypothesized that this limitation could be bypassed by expressing higher levels of the tetR protein to more strongly repress shRNA expression in the absence of tetracycline. We performed a multi-parameter RNA and codon optimization of the bacterial tetR cDNA (Fath et al., 2011) and used the resulting codon-optimized tetR (OPTtetR) to generate new EGFP inducible knockdown hESC lines (Fig. 2B). This modification achieved a tenfold increase in tetR expression compared with the standard sequence (STDtetR; Fig. 2D). Furthermore, homozygous expression of OPTtetR was sufficient to completely prevent shRNA leakiness while fully preserving efficient knockdown induction (Fig. 2C, Fig. S3B). Of note, the inducible knockdown was rapid, reversible and dose responsive (Fig. 2E,F, Fig. S3C-E). Finally, inducible hESCs displayed a normal karyotype (data not shown), demonstrating that the genome engineering necessary to create these lines did not alter their genetic stability.
Based on these encouraging results, we further validated this method in the context of endogenous genes by generating hESCs carrying inducible shRNAs against OCT4 (POU5F1) or B2M
(Fig. S3F). Remarkably, all the sublines analyzed (six for each gene) showed robust inducible knockdown with no significant shRNA leakiness (Fig. S3G,H). Tetracycline titration identified optimal concentrations to partially or fully knockdown OCT4 (Fig. 2G, Fig. S3I,J). As expected, a strong decrease in OCT4specifically resulted in loss of pluripotency and induction of neuroectoderm and definitive endoderm markers (Fig. 2H, Fig. S3I,J) (Thomson et al., 2011; Wang et al., 2012). Similar results were obtained with 20 additionalOCT4inducible knockdown hESC sublines, confirming the robustness and reproducibility of this method (Fig. S3K). Importantly, the generation of hESCs with strong and tightly regulated knockdown was so efficient that phenotypic analyses could be performed immediately after antibiotic selection on a mixed population of cells, thereby entirely bypassing the need to pick individual colonies for clonal isolation (Fig. S3K).
Overall, these results establish that dual targeting of GSHs with an optimized inducible knockdown system is a powerful method to control gene expression in hPSCs. This approach is hereafter named optimized inducible knockdown, or OPTiKD (Fig. 2A, Fig. S3F).
Single-step generation of optimized inducible knockdown hPSCs
We then sought to further improve the OPTiKD system by developing an all-in-one targeting approach that would facilitate the rapid and scalable generation of inducible knockdown hPSCs. We constructed a singleAAVS1targeting vector to carry both the inducible shRNA and the CAG-tetR expression cassette (Fig. 3A), and validated this approach by knocking down the expression of an EGFP transgene targeted in the ROSA26 locus (Fig. S3L). Remarkably, this method shared key properties with OPTiKD, such as both the absence of shRNA leakiness (Fig. S3L,M) and rapid, reversible and dose-responsive inducible knockdown (Fig. S3N,O). Thus, this all-in-one strategy, which we named single-step optimized inducible knockdown, or sOPTiKD (Fig. 3A), is as efficient as our original dual targeting approach.
To further demonstrate the versatility of sOPTiKD, we generated both hESC and hiPSC lines carrying an inducible shRNA against OCT4 or B2M. Generation of sOPTiKD hPSCs following lipofection was rapid (2 weeks) and extremely efficient, as all the sublines generated showed robust inducible knockdown (Fig. 3B,C). qPCR analyses confirmed that knockdown ofOCT4 using sOPTiKD induced differentiation of both hESCs and hiPSCs, whereas knockdown ofB2Mhad no effect (Fig. 3D). Overall, these experiments show that sOPTiKD provides an efficient system to knock down gene expression that can be easily applied to a large number of hPSC lines.
Finally, we explored whether sOPTiKD could enable simultaneous knockdown of multiple genes (Fig. 3E). We focused on the cyclin D family (CCND1,CCND2andCCND3). These cell cycle regulators are functionally redundant, and thus their study in hESCs has previously required laborious multiple rounds of stable shRNA transfection in order to achieve double or triple knockdown (Pauklin and Vallier, 2013). We developed a method to easily combine multiple shRNAs into the same targeting vector using a one-step Gibson assembly, and generated sOPTiKD plasmids carrying one, two or three shRNAs against cyclin D genes or scrambled control shRNAs (Fig. 3E). These vectors were tested in hESCs without isolation of clonal sublines, and inducible knockdown proved highly efficient and comparable with single, double and triple shRNA constructs (Fig. 3F). Interestingly, prolonged knockdown of one or two cyclin Ds was compatible with hESC self-renewal (Fig. 3G), whereas triple knockdown
DEVEL
O
D
TUBA4A tetR H9 Rand. Int. STD tetR ROSA26 STDtetR HOM ROSA26 OPTtetR HET 30% 100% 100%Loading: 100% 100% 30% 10% 100% 30% 10% ROSA26 OPTtetR HOM
F
G
1
0 2 4 8
16 32 64
125 250 500
1000 0% 25% 50% 75% 100%
tet (ng/ml) tet (ng/ml)
IC50 = 25ng/ml (56nM) EG F P M F I r e la ti v e to n o t e t
H
1 2 3 no tet OCT4 T MESP1 SOX2 NANOG SOX1 PAX6 SOX17 GSC GATA4 EOMES
1 2 3 tet 16ng/ml
OCT4 OPTiKD
tet 1000ng/ml
1 2 3 -1.5 0
Z-score +2
E
-5 -4 -3 -2 -1 0 1 2 3 4 5 6 7
0% 20% 40% 60% 80% 100% EG F P expression re la ti v e t o no tet (EGFP OPTiKD) MFI mRNA
tet NO tet
Experimental day
B
5’-HAR
Exon 1 SA pA pA
3’-HAR Neo CAG tetR
R26-prom ROSA26 tetR
EGFP inducible knockdown
Exon 2
5’-HAR
Exon 1 pA
EGFP shRNA
pA 3’-HAR
Puro CAG EGFP
AAV-prom AAVS1 iEGFP Exon 2 SA-T2A H1 TO
C
0% 20% 40% 60% 80% 100% 120% EG F P M F I r e lat iv e t o no shRNA -tet: tetR: shRNA: + - - + - + EGFP shRNA -STD HOM + - + - + OPT HET OPT HOM STD HOM OPT HET OPT HOM No shRNA tetR expression**
***
n.s. n.s.***
***
A
hPSCs tetR hPSCs iKD hPSCs KD hPSCs
Nucleofection Cas9n guide A
Cas9n guide B
Neo selection + clonal isolation
Puro selection + clonal isolation 2-3 weeks tet ROSA26 tetR Lipofection ZFN left ZFN right AAVS1 i-shRNA 2-3 weeks tetR CAG H1 TO TO tetR tetR CAG H1 shRNA tetR T T T 0 16 64 125 1000 0.0 0.2 0.4 0.6 0.8 1.0 1.2 OCT4 e x p re s s ion r e la tiv e t o no tet
OCT4 OPTiKD
[image:4.612.77.536.55.586.2]EGFP OPTiKD
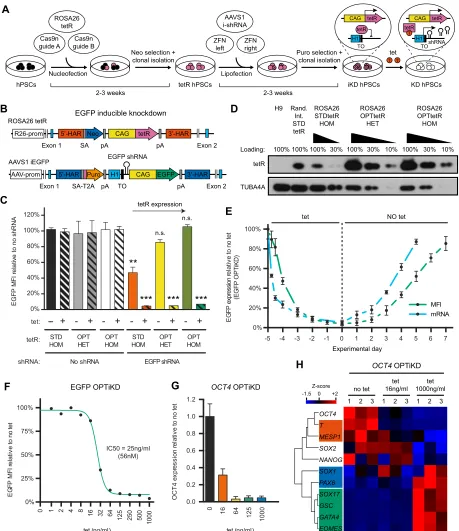
Fig. 2. Development of an optimized inducible knockdown system (OPTiKD) based on dual GSH targeting of hPSCs.(A) Experimental approach for the generation of inducible knockdown (iKD) hPSCs. H1, H1 promoter; TO, tet operon; tetR, tetracycline-controlled repressor; ZFN, zinc-finger nuclease. (B) Transgenic alleles generated to obtain hESCs expressing an EGFP reporter transgene that could be silenced using an inducible EGFP shRNA. (C) EGFP expression in the absence or presence of tetracycline for 5 days in hESCs targeted with the indicated combinations of inducible EGFP shRNA and tetR [wild-type standard tetR (STDtetR) or codon-optimized tetR (OPTtetR)]. Double-targeted hESCs that did not carry the EGFP shRNA were used as negative controls. Results are from two or three individual lines per condition (see Table S1). n.s.,P>0.05 (non-significant), **P<0.01, ***P<0.001 versus the same tetR line no tet and no shRNA (ANOVA with post-hoc Holm-Sidak comparisons). (D) Representative western blot for tetR inROSA26-targeted hESCs expressing STDtetR or OPTtetR. HET, heterozygous targeting; HOM, homozygous targeting. hESCs with STDtetR random integration (Rand. Int.) are shown as a positive reference, while wild-type H9 hESCs are negative controls. Various amounts of protein were loaded to facilitate semi-quantitative comparison. TUBA4A (α-tubulin) provided a loading control. (E) EGFP knockdown and rescue kinetics in EGFP OPTiKD hESCs measured by flow cytometry (MFI) and qPCR (mRNA). Results are from two independent cultures per time point. (F) Tetracycline dose-response curve for EGFP knockdown in EGFP OPTiKD hESCs. The half-maximal inhibitory concentration (IC50) is reported. Results are from two independent cultures per dose, and the mean is shown. (G,H) qPCR analysis ofOCT4OPTiKD hESCs in the absence of tetracycline, or following treatment with different doses of tetracycline for 5 days. (H) Genes are clustered by complete Euclidean distance, and genes specific for pluripotency or for the primary germ layers are in color-coded boxes: no color, hPSCs; red, mesoderm; green, endoderm; blue, neuroectoderm. Z-scores indicate differential expression measured in the number of standard deviations from the average level. Results are from three independent cultures.
DEVEL
O
resulted in definitive endoderm differentiation (Fig. 3G,H), as previously reported (Pauklin and Vallier, 2013; Pauklin et al., 2016). Collectively, these results demonstrate that sOPTiKD can be used to simultaneously decrease the expression of several genes with redundant functions.
Validation of the optimized inducible knockdown platforms in differentiated progenies of hPSCs
The capacity to knock down genes in a variety of differentiated cells would represent a significant advance over existing systems for inducible gene knockdown. To thoroughly test this possibility, we
analyzed the efficacy of the OPTiKD and sOPTiKD platforms to knock down an EGFP transgene in hPSCs differentiated into the three germ layers, as well as in a panel of 13 fully differentiated cell types (Fig. 1A). For both methods, qPCR analyses demonstrated strong and inducible knockdown of EGFP transcripts in all lineages tested (Fig. 4A). Microscopy observations confirmed a robust decrease in EGFP protein expression (Fig. 4B), and flow cytometry showed a decrease in EGFP fluorescence of more than 70% for most lineages (Fig. S4A-G).
Interestingly, EGFP was less reduced in cell types with slower proliferation rates (Fig. S4A). Since EGFP has an extended half-life
B
A
D
E
F
G
H
C
5’-HARExon 1 pA pA
3’-HAR Puro
AAV-prom AAVS1
single-step OPTiKD (sOPTiKD)
Exon 2 SA-T2A OPTtetR H1 TO CAG 5’-HAR
Exon 1 pA pA
3’-HAR Puro
AAV-prom AAVS1
Multiple-gene sOPTiKD
CYCLIN Ds multiple sOPTiKD
Exon 2 SA-T2A OPTtetR H1 TO H1 TO H1 TO CAG
OCT4 sOPTiKD
hESCs
B2M sOPTiKD OCT4 sOPTiKD
hiPSCs
B2M sOPTiKD
OCT4 sOPTiKD B2M sOPTiKD OCT4 sOPTiKD B2M sOPTiKD
0.00 0.25 0.50 0.75 1.00 1.25 1.50 mRNA ex p re s s io n r e la ti v e to OCT4 sOPTiKD C T R mRNA ex p re s s io n r e la ti v e to B2M sOPTiKD CT R OCT4 CTR TET
1 2 3 4 5 6 7 8 9 10 11 12 13 14 15 16 17 18 19 20 21 22 23 24
hESCs hiPSCs
1 2 3 4 5 6 7 8 9 10 11 12 13 14 15 16 17 18 19 20 21 22 23 24
CTR TET CTR TET 0.00 0.25 0.50 0.75 1.00 1.25 1.50 B2M hESCs OCT4 TET hESCs OCT4 TET hESCs OCT4 TET hiPSCs OCT4 TET hiPSCs OCT4 TET hiPSCs OCT4 TET hiPSCs B2M TET hiPSCs B2M TET hESCs B2M TET hESCs B2M TET hESCs B2M TET hiPSCs B2M TET hiPSCs OCT4 CTR hiPSCs B2M CTR hiPSCs OCT4 CTR hiPSCs OCT4 CTR hESCs OCT4 CTR hESCs OCT4 CTR hESCs B2M CTR hiPSCs B2M CTR hESCs B2M CTR hESCs OCT4 CTR hESCs B2M CTR hiPSCs B2M CTR SOX2 OCT4 NANOG B2M SOX17 EOMES GSC Z-score 0 -1.5 +1.5 0.0 0.5 1.0 1.5 2.0 2.5 m R N A e x p re ssi o n r e la ti ve t o SCR controls SCR 2X SCR 3X SCR D1 D2 D3 D1/D2 CTR TET CCND1 CTR TET CCND2 CTR TET CCND3 D1/D3 D1/D2/D3 CCND1/D2/D3 sOPTiKD shRNA
sh 1 sh 2 sh 3
H1 TO
sh n
TET
CTR
DAPI OCT4 SOX17
0 10 20
D1/D2/D3 D1/D3
SOX17+
OCT4-% of cells
*
0 25 50 75 100
OCT4+
SOX17-***
[image:5.612.53.563.57.498.2]% of cells
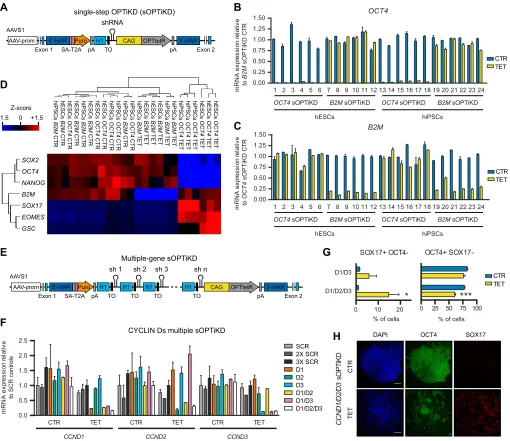
Fig. 3. Single-step optimized inducible knockdown (sOPTiKD) of individual and multiple genes in hESCs and hiPSCs.(A) The transgenic allele behind the single-step generation of OPTiKD hPSCs. (B,C) qPCR ofOCT4andB2MsOPTiKD hESCs and hiPSCs in the absence (CTR) or presence of tetracycline for 5 days (TET). Individual clonal lines were analyzed in duplicate. (D) Heatmap summarizing qPCR analysis of cells treated as in B,C. Results are from three clonal lines per condition. Samples and genes were clustered by complete Euclidean distance, and Z-scores indicate differential expression measured in number of standard deviations from the average level. (E) The transgenic allele behind the generation of hPSCs with inducible knockdown of multiple genes. (F) qPCR analysis of sOPTiKD hESCs for individual or multiple cyclin D genes (D1, D2 and D3 in the key indicating inducible shRNAs againstCCND1,CCND2and
CCND3, respectively). Cells were analyzed in the absence or presence of tetracycline for 10 days, and sOPTiKD hESCs carrying one, two or three copies of a scrambled shRNA (SCR, 2X SCR and 3X SCR, respectively) were used as negative controls. For each condition, results are from two clonal pools obtained after gene targeting. (G,H) Flow cytometry quantifications (G) and representative immunostainings (H) for the pluripotency marker OCT4 and the definitive endoderm marker SOX17 in cells treated as in F. *P<0.05, ***P<0.001 versus CTR in the same line (ANOVA with post-hoc Holm-Sidak comparisons). DAPI shows nuclear staining. Scale bars: 100μm.
DEVEL
O
of more than 24 h, protein loss upon transcriptional or post-transcriptional inhibition relies heavily upon its gradual dilution following cell division (Li, 1998). Considering the strong decrease in EGFP mRNA, we concluded that residual EGFP fluorescence
was likely to be a consequence of the relatively short tetracycline treatment performed to trigger knockdown (5 days). To test this, we induced prolonged EGFP knockdown in postmitotic cardiomyocytes, and we indeed observed a slow but constant
A
Pluri Neur o
Mes o
End o
Neuron s
Neuralcrest Osteo Chondr o
SMC Epi Fibro Card io
Intesti ne
Panc Cho l
Hep Lung
0.00 0.25 0.50 0.75 1.00
E
G
F
P
m
R
N
A
r
e
la
ti
v
e
to
C
T
R
OPTiKD TET OPTiKD CTR
sOPTiKD CTR sOPTiKD TET
B
CTR
TET
CTR
TET
CTR
TET
CTR
TET
NGFR (p75)
DAPI EGFP
Neural crest
DAPI EGFP WT1
INS
DAPI EGFP
Epicardium
Pancreatic beta cells
DAPI EGFP SOX1
Neuroectoderm
BGLAP
DAPI EGFP
DDR2
DAPI EGFP
KRT19
DAPI EGFP
Osteocytes
Fibroblasts
Cholangiocytes
DAPI EGFP NKX2-5
Lateral plate mesoderm
TAGLN
DAPI EGFP
DAPI EGFP VIL
DAPI EGFP SFTPC
Smooth muscle cells
Intestinal epithelium
Lung epithelium
DAPI EGFP TUBB3
Neurons
ACAN
DAPI EGFP
Chondrocytes
DAPI EGFP SOX17
TNNT2
DAPI EGFP
ALB
DAPI EGFP
Definitive endoderm
Cardiomyocytes
[image:6.612.52.562.55.603.2]Hepatocytes
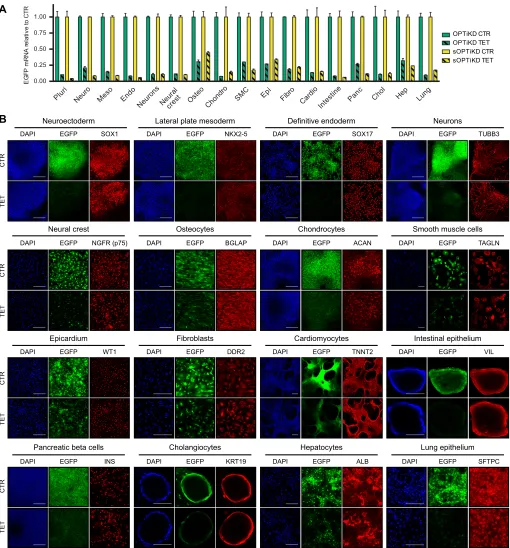
Fig. 4. Validation of the optimized inducible knockdown platforms following hPSC differentiation.(A) EGFP expression measured by qPCR in the absence (CTR) or presence of tetracycline for 5 days (TET) in the indicated cell types derived from EGFP OPTiKD and sOPTiKD hESCs. EGFP levels are reported relative to control conditions in the same line for each individual lineage. Abbreviations indicate the lineages described in Fig. 1A ( pluri indicates undifferentiated). Results are from two independent cultures per condition. (B) Representative immunofluorescent stainings for lineage-specific markers in the three germ layers and in the indicated mature cell types derived from EGFP sOPTiKD hESCs and treated as in A. EGFP fluorescence is in green, and DAPI shows nuclear staining. Similar results supporting the same conclusions were obtained for EGFP OPTiKD hESCs (data not shown). Scale bars: 100μm for intestinal epithelium and cholangiocytes; 200μm for all other lineages.
DEVEL
O
decrease in protein expression for up to 20 days, at which point the EGFP was decreased by more than 75% (Fig. S4H,I). To reinforce these observations, we performed similar experiments using a
ROSA26-targeted EGFP reporter transgene fused to a
destabilization domain (EGFPd2; Li et al., 1998), which avoids confounding effects due to the long half-life of standard EGFP (Fig. S4J-M) (Wahlers et al., 2001). Remarkably, EGFPd2 inducible knockdown in cardiomyocytes using the sOPTiKD method resulted in >90% protein knockdown after 5 days of tetracycline treatment (Fig. S4N,O). Considered together, these results establish that OPTiKD and sOPTiKD allow efficient manipulation of gene expression even after differentiation of hPSCs.
Inducible knockdown of T (brachyury) during mesendoderm differentiation of hPSCs
We then sought to exemplify the use of OPTiKD and sOPTiKD to rapidly and efficiently evaluate endogenous gene function in a variety of cell types and at different stages of hPSC differentiation related to embryonic development. First, we focused on the master developmental regulator T (brachyury), which plays an essential role in mesoderm formation and, in particular, during the development of posterior mesoderm, notochord and somites (Martin, 2015; Papaioannou, 2014). Indeed, mice carrying a heterozygous mutation in Texhibit a short tail phenotype, while homozygous mutations are embryonic lethal at around 9.5 dpc (Dobrovolskaia-Zavadskaia, 1927; Gluecksohn-Schoenheimer, 1944).Tmutants also present severe cardiovascular and placental defects (David et al., 2011; Inman and Downs, 2006; King et al., 1998). Furthermore,Twas recently shown to specifically regulate mesoderm but not endoderm differentiation in hPSCs (Faial et al., 2015).
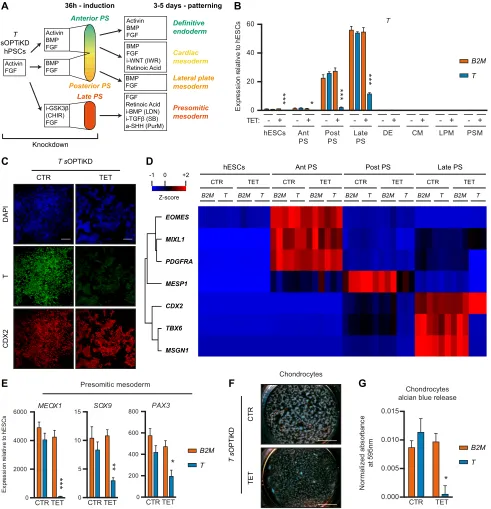
To investigate the role ofTduring the differentiation of hPSCs we combinedTsOPTiKD sublines with culture conditions known to drive the differentiation of hPSCs into subpopulations that recapitulate different portions of the primitive streak and their derived lineages (Fig. 5A) (Bernardo et al., 2011; Cheung et al., 2012; Mendjan et al., 2014; Touboul et al., 2010). Inducible knockdown ofTwas robust in all cell types analyzed (Fig. 5B,C, Fig. S5A,B), confirming the efficiency of sOPTiKD to knock down developmental genes. Decrease in T expression did not affect definitive endoderm specification, while differentiation into posterior primitive streak cells, cardiac mesoderm and lateral plate mesoderm was mildly impaired (Fig. 5D, Fig. S5C). By contrast, the generation of late primitive streak progenitors (recapitulating the onset of somitogenesis) and their further specification into presomitic mesoderm and chondrocytes were severely affected following inducible knockdown of T (Fig. 5D-G). In particular, induction ofTBX6,MSGN1andMEOX1was nearly abolished, in agreement with the established role ofTin the expression of such genes (Chapman et al., 1996; Faial et al., 2015; Martin, 2015).
Collectively, these results strikingly recapitulate the known role ofTduring early embryonic development, thereby demonstrating the versatility of OPTiKD platforms to study the mechanisms of human developmentin vitro.
Inducible knockdown ofDPY30at various stages of hPSC differentiation reveals stage- and lineage-specific functions We then aimed to demonstrate the suitability of the OPTiKD platforms to investigate the function of genes that are not only expressed during early development, but also in differentiated cells. We focused onDPY30, a ubiquitously expressed co-factor of the COMPASS histone methyltransferase complexes required for
histone H3 lysine 4 trimethylation (H3K4me3) (Jiang et al., 2011). This epigenetic modifier is necessary for mouse early embryonic development, as its knockout leads to impaired gastrulation associated with ectopic neuralization of the post-implantation epiblast (Bertero et al., 2015). Similarly, DPY30 is required for hESC pluripotency (Bertero et al., 2015), and this early role had prevented further studies of its function during differentiation. Finally, Dpy30 has been implicated in mouse ESC differentiation and in the proliferation and differentiation of hematopoietic progenitors (Jiang et al., 2011; Yang et al., 2014). Consequently, we decided to employ our inducible knockdown platform to bypass the early function of DPY30in hPSCs and specifically suppress its expression during differentiation (Fig. 6A).
First, we generatedDPY30OPTiKD hESC sublines (Fig. S6A), and confirmed that inducibleDPY30knockdown in undifferentiated hESCs impaired the expression of pluripotency genes and triggered neuroectoderm differentiation (Fig. 6B, Fig. S6B), as shown previously (Bertero et al., 2015). We then analyzed the function
of DPY30during lineage specification by differentiating DPY30
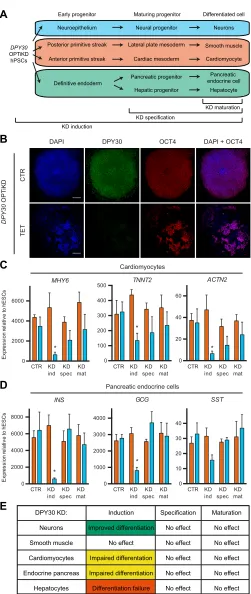
OPTiKD hESCs into five different cell types while inducingDPY30 knockdown from the induction, specification or maturation stages (Fig. 6A). qPCR confirmed the decrease inDPY30expression in all the cells generated (Fig. S6C-H). Interestingly, phenotypic analyses demonstrated thatDPY30knockdown from the early induction of cardiac specification impaired cardiomyocyte differentiation, as shown by the decrease in contractile markers (Fig. 6C). However, knockdown at later stages had no significant effects (Fig. 6C). A similar result was observed for the hepatocyte lineage, since decrease of DPY30 expression in endoderm progenitors led to extensive cell death at the anterior foregut stage thereby preventing further differentiation (Fig. S6I). Similarly, specification of pancreatic endocrine cells was also impaired by knockdown of
DPY30in the initial stage of differentiation (Fig. 6D). However,
neither hepatocyte nor pancreatic endocrine cell specification was significantly affected by knockdown of DPY30 in maturing progenitors or differentiated cells (Fig. 6D,E, Fig. S6I). By contrast, neuronal differentiation was promoted followingDPY30 knockdown during the induction of neuroepithelial progenitors (Fig. S6J). Finally,DPY30knockdown at any stage during smooth muscle cell differentiation had no effect on the expression of key lineage markers (Fig. S6K).
Considered together, these data confirm a key role for DPY30 during germ layer specification while suggesting that the requirement for DPY30 expression could vary during the differentiation and maturation of specific lineages (Fig. 6E). Overall, these experiments illustrate how the optimized inducible knockdown platform can be easily applied to acquire novel information about developmental mechanisms by performing functional studies at different steps of hPSC differentiation into multiple cell types.
Development of an optimized inducible CRISPR/Cas9 knockout platform in hPSCs
Having established an optimized inducible knockdown platform, we turned our attention to developing a complementary inducible knockout approach. Current inducible CRISPR/Cas9 methods rely on conditional overexpression of Cas9 in the presence of a constitutively expressed gRNA (González et al., 2014; Mandegar et al., 2016). In this case, control of Cas9 overexpression is achieved by a TET-ON method in which, following doxycycline treatment, a tetracycline-controlled reverse transactivator (rtTA) activates a Pol
DEVEL
O
II-dependent tetracycline-responsive element (TRE) promoter (a fusion between multiple TET operons and a minimal CMV promoter). Although this TET-ON platform has been successfully applied to certain human cell types (Qin et al., 2010), we observed
that this inducible system is silenced during hPSC differentiation into multiple lineages (including cardiomyocytes, hepatocytes and smooth muscle cells), even after targeting into the AAVS1 GSH (Fig. S7). These observations reinforce previous reports
A
C
E F G
D
B
T sOPTiKD
hPSCs
Activin FGF
Definitive endoderm
Lateral plate mesoderm Cardiac mesoderm
Presomitic mesoderm Late PS
Anterior PS
36h - induction 3-5 days - patterning
Posterior PS
Knockdown
B2M T
B2M T
B2M T
CTR TET 0
2000 4000 6000
E
x
pr
es
s
ion r
e
la
ti
v
e t
o hE
S
C
s
MEOX1
***
CTR TET 0
5 10 15 SOX9
Presomitic mesoderm
Chondrocytes alcian blue release Chondrocytes
**
CTR TET 0
200 400 600 800 PAX3
* TET
CTR
DAPI
T
CDX2
T sOPTiKD
CTR 0
Z-score +2 -1
T B2M
hESCs
TET
T B2M
CTR
T B2M
Ant PS
TET
T B2M
CTR
T B2M
Post PS
TET
T B2M
CTR
T B2M
Late PS
TET
T B2M
EOMES MIXL1
PDGFRA MESP1 CDX2
TBX6 MSGN1
CTR TET 0.000
0.005 0.010 0.015
Normalized a
b
s
o
rb
a
n
c
e
at
595nm
*
TET
C
TR
T s
OPT
iKD
Activin BMP FGF
Activin BMP FGF
BMP FGF i-WNT (IWR) Retinoic Acid BMP
FGF
BMP FGF
FGF Retinoic Acid i-BMP (LDN) i-TGFβ (SB) a-SHH (PurM) i-GSK3β
(CHIR) FGF
hESCs Ant PS
Post PS
Late PS
DE CM LPM PSM
0 20 40 60
E
x
pr
e
ssi
on r
e
lat
iv
e
t
o
h
ESC
s T
***
*
**
*
***
[image:8.612.62.553.58.567.2]TET: - + - + - + - + - + - + - + - +
Fig. 5. Functional analysis of T (brachyury) during mesendoderm specification of hPSCs.(A) The experimental approach.Tknockdown was induced for 2 days in pluripotent cells and maintained throughout differentiation. PS, primitive streak-like cells; i-, inhibitor; a-, activator; CHIR, CHIR99021; LDN, LDN193189; SB, SB431542; PurM, purmorphamine. (B) qPCR forTin the indicated lineages derived fromTorB2M(control) sOPTiKD hESCs as described in A. Ant/Post/Late PS refer to anterior/posterior/late primitive streak; DE, definitive endoderm; CM, cardiac mesoderm; LPM, lateral plate mesoderm; PSM, presomitic mesoderm. (C) Representative immunofluorescent staining demonstrating inducible knockdown of T in late primitive streak cells expressing the marker CDX2. DAPI shows nuclear staining. (D) Heatmap summarizing qPCR results for various mesendoderm markers in primitive streak cells from the experiment described in A,B. Genes were clustered by complete Euclidean distance, and Z-scores indicate differential expression measured in number of standard deviations from the average level. (E) qPCR results for lineage-specific markers in presomitic mesoderm cells from the experiment described in A,B. (F,G) Representative Alcian Blue staining (F) and quantification of Alcian Blue release (G) in chondrocytes differentiated from presomitic mesoderm cells generated as described in A,B. (B,E,G) *P<0.05, **P<0.01, ***P<0.001 versusB2Min the same condition (two-way ANOVA with post-hoc Sidak comparisons), and results are from three independent clonal lines per condition. Scale bars: 100μm in C; 4 mm in F.
DEVEL
O
(Haenebalcke et al., 2013; Mandegar et al., 2016; Ordovas et al., 2015) and demonstrate that recently described systems for inducible CRISPR/Cas9 (González et al., 2014; Mandegar et al., 2016) are unlikely to work in a diversity of hPSC-derived cell types. For this reason, we explored the possibility of developing an alternative and improved method by combining a constitutively expressed CAG promoter-driven Cas9 with an inducible gRNA cassette based on
that developed for inducible shRNA expression in sOPTiKD (Fig. 7A,B).
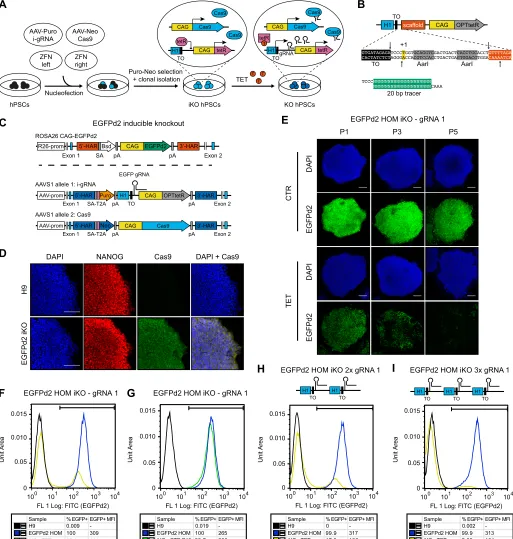
We generated hESC lines in which a fluorescent reporter gene could be knocked out in an inducible fashion (Fig. 7C). For this, we targetedROSA26-EGFPd2 reporter hESCs (Fig. S4J,K) with both an inducible EGFP gRNA and a constitutive Cas9 in the AAVS1 locus, each transgene being integrated into one of the two alleles (Fig. 7C,D). This dual targeting approach was rapid (<2 weeks) and efficient (>90% of lines containing both transgenes; Table S1). Remarkably, when individual clonal sublines were grown in the presence of tetracycline we observed decreased EGFPd2 expression in all of the targeted lines, and EGFPd2 homozygous cells showed near-homogeneous loss of at least one copy of the reporter gene as early as 5 days following tetracycline induction (as demonstrated by 50% reduction in EGFPd2 fluorescence, Fig. S8A). Prolonged treatment with tetracycline progressively led to the complete loss of EGFPd2 fluorescence in up to 75% of EGFPd2 homozygous cells (Fig. 7E,F, Fig. S8A,B). Interestingly, co-expression of either two or three copies of the same EGFP gRNA cassette from the sameAAVS1 locus was sufficient to significantly increase the speed and efficiency of inducible EGFPd2 knockout in all the clonal sublines analyzed (Fig. 7H,I, Fig. S8A). For instance, simultaneous induction of three copies of the same gRNA resulted in a remarkable 95% knockout efficiency following tetracycline treatment (Fig. 7I). Importantly, inducible EGFPd2 knockout hESCs did not show any significant decrease in the proportion of EGFPd2-positive cells nor in their fluorescence after prolonged culture in the absence of tetracycline, even when several gRNA copies were used (Fig. 7G, Fig. S8C,D). This demonstrated that the inducible gRNA expression was tightly controlled. Finally, testing of additional gRNAs against EGFPd2 revealed that the speed and efficiency of the inducible knockout strongly relied on the gRNA. Indeed, an optimal sequence allowed up to 90% knockout after only 2 days of induction (Fig. S8E,F,K). Of note, the most efficient gRNA also resulted in uncontrolled EGFPd2 knockout (Fig. S8G), but this limitation was avoided by simply adding a second TET operon to the inducible H1 promoter to ensure even more stringent transcriptional control (Fig. S8H-K).
Collectively, these results show that the sOPTiKD system could be readily repurposed to support inducible gRNA expression and allow tightly controlled activity of CRISPR/Cas9 over a broad range of gRNA potency (Fig. S8L). To the best of our knowledge, this is the first conditional CRISPR/Cas9 approach based on inducible gRNA expression. We named this method single-step optimized inducible gene knockout, or sOPTiKO.
Validation of the optimized inducible CRISPR/Cas9 platform in differentiated progenies of hPSCs
Having demonstrated that sOPTiKO allows efficient control of CRISPR/Cas9 activity in undifferentiated hPSCs, we thoroughly
A
D
C
E
CTR KD ind KD spec KD mat CTR KD ind KD spec KD mat CTR KD ind KD spec KD mat 0 2000 4000 6000 8000 E x p re s s io n r e la ti v e to h ESC s INS *Pancreatic endocrine cells
0 1000 2000 3000 4000 GCG * CTR KD ind KD spec KD mat CTR KD ind KD spec KD mat CTR KD ind KD spec KD mat 0 2000 4000 6000 E x pr es s ion r e la ti v e to h E S C s MHY6 * 0 100 200 300 400 500 TNNT2 * 0 20 40 60 ACTN2 * 0 10 20 30 40 SST Cardiomyocytes DPY30 OPTiKD hPSCs Smooth muscle Neurons Neural progenitor
Lateral plate mesoderm
Cardiac mesoderm
Pancreatic progenitor
Hepatic progenitor Definitive endoderm
Posterior primitive streak Neuroepithelium
Early progenitor Maturing progenitor Differentiated cell
Anterior primitive streak Cardiomyocyte
Pancreatic endocrine cell Hepatocyte KD maturation KD specification KD induction DPY30 KD: Neurons Smooth muscle Cardiomyocytes Endocrine pancreas Hepatocytes Induction Improved differentiation No effect Impaired differentation Impaired differentiation Differentiation failure Specification No effect No effect No effect No effect No effect Maturation No effect No effect No effect No effect No effect
B
DAPI CTR DPY30 OPT iKD TET [image:9.612.49.300.50.644.2]DPY30 OCT4 DAPI + OCT4
Fig. 6. Functional analysis ofDPY30during hPSC differentiation.(A) The experimental design to investigate the role ofDPY30at various stages of hPSC differentiation. (B) Representative immunofluorescent staining for DPY30 and the pluripotency marker OCT4 in undifferentiatedDPY30OPTiKD hESCs in the absence (CTR) or presence of tetracycline for 10 days (TET). DAPI shows nuclear staining. Scale bars: 200μm. (C,D) qPCR-based analyses ofDPY30
(blue) andB2M(orange) OPTiKD hESCs after differentiation into mature lineages. CTR, no knockdown; KD ind/spec/mat refer to knockdown from induction/specification/maturation, respectively. Results are from three independent cultures per condition. *P<0.05 versusB2Min the same condition (two-way ANOVA with post-hoc Sidak comparisons). (E) Summary of the lineage- and stage-specific phenotypic effects followingDPY30knockdown during hESC differentiation.
DEVEL
O
EGFPd2 HOM iKO - gRNA 1 EGFPd2 HOM iKO - gRNA 1
Sample % EGFP+ EGFP+ MFI
H9 0.009
EGFPd2 HOM 100 -309
iKO - TET 25.9 161
Sample % EGFP+ EGFP+ MFI
H9 0.019
EGFPd2 HOM 100 iKO - CTR P10 99.7
-265 230
Sample % EGFP+ EGFP+ MFI
H9 0
EGFPd2 HOM 99.9 -317
iKO - TET 17.9 136
Sample % EGFP+ EGFP+ MFI
H9 0.002
EGFPd2 HOM 99.9 -313
iKO - TET 5.02 101
C
E
F
G
H
I
D
5’-HAR
Exon 1 pA
EGFP gRNA
pA 3’-HAR Puro
AAV-prom AAVS1 allele 1: i-gRNA
EGFPd2 inducible knockout
Exon 2 SA-T2A
OPTtetR H1
TO CAG
5’-HAR
Exon 1 pA pA
3’-HAR AAV-prom
AAVS1 allele 2: Cas9
Exon 2 SA-T2A
Cas9 CAG 5’-HAR
Exon 1 SA pA pA
3’-HAR Bsd
Neo
EGFPd2 CAG R26-prom
ROSA26 CAG-EGFPd2
Exon 2
DAPI
EGFPd2
CTR
DAPI
EGFPd2
P1 P3 P5
TET
DAPI
H9
EGFPd2 iKO
NANOG Cas9 DAPI + Cas9
A
B
hPSCs iKO hPSCs KO hPSCs
Puro-Neo selection
+ clonal isolation TET
Nucleofection ZFN
left
ZFN right AAV-Puro
i-gRNA
AAV-Neo Cas9
tetR CAG H1
TO tetR
Cas9
Cas9
gRNA tetR
tetR CAG H1
TO
T
Cas9 CAG
Cas9
Cas9 Cas9
CAG H1 scaffold
TO
TO AarI
20 bp tracer +1
AarI OPTtetR CAG
GTGATAGAGATCCCTGGTGCAGGTGGACTGACTCACCTGCACCTGTTTTAGA CACTATCTCTAGGGACCACGTCCACCTGACTGAGTGGACGTGGACAAAATCA
TCCCNNNNNNNNNNNNNNNNNNNN NNNNNNNNNNNNNNNNNNNNCAAA
EGFPd2 HOM iKO 2x gRNA 1 EGFPd2 HOM iKO 3x gRNA 1
H1 TO
H1 TO
H1 TO
H1 TO
H1 TO
T T
T
0.015
0.010
0.05
0 0
FL 1 Log: FITC (EGFPd2)
Unit Area Unit Area Unit Area Unit Area
100 101 102 103 104
0.015
0.010
0.05
FL 1 Log: FITC (EGFPd2) 100 101 102 103 104
0 0.015
0.010
0.05
FL 1 Log: FITC (EGFPd2) 100 101 102 103 104
0 0.015
0.010
0.05
FL 1 Log: FITC (EGFPd2) 100 101 102 103 104
[image:10.612.50.563.60.599.2]EGFPd2 HOM iKO - gRNA 1
Fig. 7. Development of an optimized inducible CRISPR/Cas9 knockout platform in hPSCs.(A) Experimental approach for the generation of inducible knockout (iKO) hPSCs. (B) The cloning procedure to generateAAVS1targeting vectors with an inducible gRNA cassette. The arrows indicate the DNA cut sites induced by digestion withAarI. (C) Transgenic alleles generated to obtain hESCs expressing an EGFPd2 reporter transgene that could be knocked out by CRISPR/Cas9 using an inducible EGFP gRNA (EGFP sOPTiKO hESCs). Bsd, blasticidin resistance; EGFPd2, destabilized EGFP. (D) Representative immunofluorescent stainings for Cas9 in EGFPd2 homozygous sOPTiKO hESCs. Wild-type hESCs (H9) were analyzed as a negative control. Cells were co-stained for the pluripotency factor NANOG, and DAPI shows nuclear staining. (E) Representative images depicting EGFPd2 fluorescence in EGFPd2 homozygous sOPTiKO hESCs in the absence (CTR) or presence of tetracycline (TET) for the indicated number of passages (P; cells were split every 5 days). (F) Representative flow cytometry for EGFPd2 expression in EGFPd2 homozygous sOPTiKO hESCs (iKO) following three passages in the presence of tetracycline. EGFPd2 homozygous cells that do not carry the inducible CRISPR/Cas9 system (EGFPd2 HOM) and wild-type hESCs were analyzed as positive and negative controls for EGFPd2 expression, respectively. The gate used to define EGFPd2-positive cells (EGFP+) is shown, and the percentage of EGFP+cells
and their MFI are reported. (G) As in F, but EGFPd2 homozygous sOPTiKO hESCs were analyzed following ten passages in the absence of tetracycline. (H,I) As in F, but EGFPd2 homozygous sOPTiKO hESCs were generated using anAAVS1targeting vector carrying two or three copies of the inducible EGFP gRNA cassette (2× and 3× gRNA, respectively). All results in this figure were obtained using EGFP gRNA 1. Scale bars: 100μm.
DEVEL
O
tested its performance following differentiation. We differentiated homozygous EGFPd2 inducible knockout cells carrying a single copy of inducible EGFP gRNA into the three primary germ layers
and into five cell types of clinical interest (neurons, cardiomyocytes, smooth muscle cells, hepatocytes and endocrine pancreatic cells). Immunostaining for lineage-specific markers demonstrated that
DAPI
CTR
TET
EGFPd2 HNF4A MERGE DAPI
CTR
TET
EGFPd2 TUBB3 Neurons
MERGE
DAPI
CTR
TET
EGFPd2 TNNT2 MERGE Cardiomyocytes
Hepatocytes
CTR
TET
DAPI EGFPd2 SOX17 MERGE
CTR
TET
DAPI DAPI
EGFPd2 NKX2.5 MERGE
A D
B E
C
G
F
CTR
TET
EGFPd2 SOX1 MERGE
Definitive endoderm Lateral plate mesoderm
Neuroectoderm
Cloning (3-5 days)
Lipofection or nucleofection
Drug selection (1-2 weeks)
sOPTiKD/KO hPSCs hESCs/hiPSCs
OPTIONAL: clonal isolation (1-2 weeks) PCR
Oligos shRNAs/gRNAs
Gibson assembly
OPTIONAL: cloning of multiple vector (3-5 days)
OPTIONAL: differentiation (variable timing )
1 2 3
1 2
3
Knockdown or knockout
EGFPd2 HOM sOPTiKO
EGFPd2 HOM sOPTiKO
EGFPd2 HOM sOPTiKO
EGFPd2 HOM sOPTiKO
EGFPd2 HOM sOPTiKO
[image:11.612.62.556.54.617.2]EGFPd2 HOM sOPTiKO
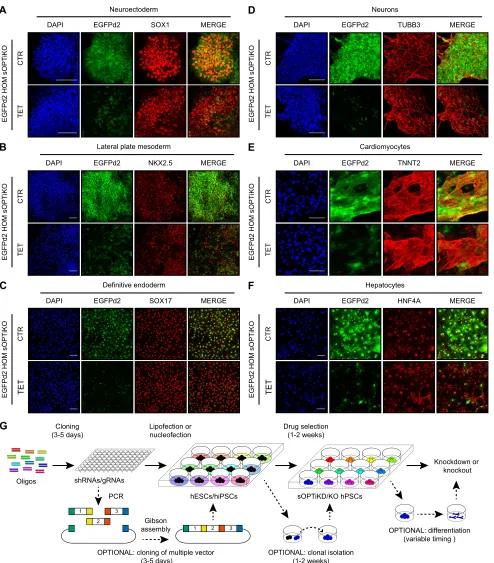
Fig. 8. Validation of the optimized inducible CRISPR/Cas9 platform following hPSC differentiation.(A-F) Representative immunofluorescent stainings for the indicated lineage-specific markers in cells derived from EGFPd2 sOPTiKO hESCs carrying a single EGFP inducible gRNA (gRNA 1). EGFPd2 knockout was induced with tetracycline for 6 days for the germ layers (A-C) and for 10 days for the mature cells (D-F). EGFPd2 fluorescence in control conditions (CTR) or after knockout (TET) is in green, and DAPI shows nuclear staining. Merged images of the EGFPd2 and lineage-specific markers are shown. Scale bars: 100μm. (G) Summary of the experimental strategy behind the generation and application of inducible knockdown or knockout hPSCs using the sOPTiKD or sOPTiKO platforms.
DEVEL
O
treatment with tetracycline resulted in strong loss of EGFPd2 expression (Fig. 8A-F, Fig. S9A,B) in all these cell types. Moreover, flow cytometry quantification confirmed that inducible knockout in differentiated cells was tightly controlled and efficient (Fig. S9C-H). For example, 85% of neuronal cells and 75% of smooth muscle cells completely lost EGFPd2 expression following tetracycline treatment (Fig. S9C,F). Considered together, these results validate that sOPTiKO allows efficient control of CRISPR/ Cas9 activity not only in hPSCs, but also into a large panel of mature cell types (Fig. 8G).
DISCUSSION
This report describes sOPTiKD and sOPTiKO – two novel platforms for inducible knockdown or knockout of gene expression that address the limitations of previous methods. Compared with alternative approaches that rely on viral transduction or random integration of inducible shRNAs (Lambeth and Smith, 2013; Zafarana et al., 2009), sOPTiKD is simpler to use ( plasmid based), quicker (2 weeks or less to generate stable lines following a single step of gene targeting by lipofection), more efficient (>95% of the resulting cells show inducible knockdown), more scalable (isolation of clonal sublines can be entirely bypassed) and significantly more robust (due to the use of GSHs and the lack of leakiness). Furthermore, sOPTiKO shares these same advantages, thus outperforming recent inducible CRISPR/Cas9 methods that rely on the conditional expression of Cas9 (González et al., 2014) or of a fusion protein between a catalytically inactive Cas9 and the transcriptional repressor KRAB (Mandegar et al., 2016). Indeed, these systems rely on the TRE promoter, which is heavily silenced upon hPSC differentiation into multiple lineages. Furthermore, these are lengthy two-step methods, and expression of the gRNA is achieved either by transient transfection, which can be poor in efficiency, or by random integration of the gRNA, which can result in mosaic expression. Finally, whereas CRISPR interference can only efficiently control gene promoter activity (Mandegar et al., 2016), sOPTiKO allows the deletion of a broader range of genomic targets, including regions outside of promoters that might not have a direct role in transcriptional regulation. Overall, sOPTiKD/KO are the first inducible shRNA and CRISPR/Cas9 technologies that enable streamlined functional studies of multiple genetic variants in hPSCs and in a diversity of differentiated cell types (Fig. 8G).
sOPTiKD and sOPTiKO each presents distinct advantages. On the one hand, the ability to control the level of knockdown using sOPTiKD allows the study of genes for which complete loss-of-function induces cell death, and facilitates the examination of gene dosage mechanisms. On the other hand, phenotypic studies following full gene knockout using sOPTiKO are more relevant in the case of genes that are still functional even when expressed at low levels. Moreover, sOPTiKO is applicable not only to genes, but also to non-coding genomic regulatory regions, which could represent a majority of disease-associated genetic traits (Cooper and Shendure, 2011).
Aside from the examples reported in this manuscript, we envision several other potential applications of the sOPTiKD/KO technologies. With regard to cellular and developmental biology, we anticipate that sOPTiKO could efficiently accommodate variants of the Cas9 gene with catalytically inactive domains (Dominguez et al., 2015). For instance, Cas9 fusion proteins with epigenetic modifiers could allow functional validations of putative genomic regulatory regions. Similarly, sOPTiKD could be repurposed to drive other types of inducible non-coding RNAs, such as antagomir or miRNA sponges to probe microRNA function (Ebert and Sharp, 2010). Remarkably, the
high targeting efficiency and scalability of sOPTiKD/KO could allow high-throughput screenings by targeting inducible shRNA or gRNA pools. Compared with viral-based approaches (Chen et al., 2012), the isogenic integration of inducible shRNAs/gRNAs would reduce heterogeneity in the targeted population, hence increasing the screening sensitivity and specificity. With regard to disease modeling applications, sOPTiKD/KO could allow the simultaneous targeting of several hiPSC lines to probe gene function in different genetic backgrounds. Such an approach could facilitate the identification of genetic disease modifiers and the discovery of novel potential drug targets in the context of personalized medicine. Multiplex inducible gene knockdown or knockout could also be used to model complex genetic disorders. Finally, sOPTiKD/KO could be easily transferred to other cell types amenable to genetic manipulation, including established cell lines and adult stem cells (Drost et al., 2015; Mandal et al., 2014), thus allowing functional studies in a multitude of systems. In conclusion, we expect that sOPTiKD/KO technologies will have a broad impact on our ability to study human development, physiology and disease.
MATERIALS AND METHODS hPSC culture and differentiation
Feeder- and serum-free hESC (H9 line; WiCell) and hiPSC (A1ATR/Rline;
Rashid et al., 2010) culture and differentiation were as previously described (Vallier, 2011). Details of media compositions and protocols are provided in the supplementary Materials and Methods.
Gene targeting
Sequences of all plasmids used in this study are provided in Appendix S1, and all cloning procedures and targeting experiments are described in detail
in the supplementary Materials and Methods. Briefly,AAVS1targeting for
OPTiKD and sOPTiKD was performed by lipofection, while AAVS1
targeting for sOPTiKO was performed by nucleofection (Bertero et al.,
2015; Vallier et al., 2004). Clonal lines were selected using 1μg/ml
puromycin (Sigma; for OPTiKD and sOPTiKD) or 25μg/ml geneticin
(G418 sulfate, Gibco) and 0.5μg/ml puromycin (for sOPTiKO).
Inducible gene knockdown and knockout
Unless otherwise described in the results or figure legends, tetracycline
hydrochloride (Sigma-Aldrich) was used at 1μg/ml to induce gene
knockdown or knockout. Refer to the supplementary Materials and
Methods for details on the timing ofDPY30inducible knockdown during
hESC differentiation.
Analysis of RNA and protein expression
Quantitative real-time PCR (qPCR), western blot, flow cytometry and immunofluorescence were performed according to standard protocols as previously described (Bertero et al., 2015). Details, including the primer sequences and antibodies used, are provided in the supplementary Materials and Methods.
Statistical analysis
Statistical analyses were performed using GraphPad Prism 6. The type and number of replicates, the statistical test used, and the test results are described in the figure legends. All statistical tests employed were two-tailed. Unless stated otherwise in the figure legends, all graphical data are presented as mean±s.e.m. No experimental samples were excluded from the statistical analyses. Sample size was not pre-determined through power calculations, and no randomization or investigator blinding approaches were implemented during the experiments and data analyses. When representative results are presented, the experiments were reproduced in at least two independent cultures.
Acknowledgements
We thank Dr Kosuke Yusa for providing the AAVS1 ZFN plasmids and Dr Andrew
Knights for technical support.
DEVEL
O
Competing interests
The authors declare no competing or financial interests.
Author contributions
A.B. conceived the study, designed, performed and analyzed experiments, and wrote the manuscript. M.P. and D.O. designed, performed and analyzed experiments. K.S., L.Y., M.C.d.B., S.B., W.G.B. and J.D.C. assisted experimental work. F.Se., E.G., L.G., N.F.R.H., D.I., F.Sa. and M.C.F.Z. (listed in alphabetical order) assisted with hESC differentiations into mature cell types. S.S. and M.K. supervised and supported the study. L.V. conceived, supervised and supported the study, wrote and gave final approval to the manuscript.
Funding
This work was supported by a European Research Council starting grant Relieve IMDs (281335 to L.V., D.O., N.R.F.H., M.C.F.Z., E.G.); the Cambridge University Hospitals National Institute for Health Research Biomedical Research Center (L.V., N.R.F.H., F.Sa.); the EU Seventh Framework Programme TISSUGEN (278955 to M.C.d.B.); the Wellcome Trust PhD program (PSAG/048 to L.Y.); a British Heart Foundation PhD Studentship (FS/11/77/39327 to A.B.); a research fellowship from the Deutsche Forschungsgemeinschaft [PA 2369/1-1 to M.P.]; and a core support grant from the Wellcome Trust and Medical Research Council to the Wellcome Trust –Medical Research Council Cambridge Stem Cell Institute (PSAG028). Deposited in PMC for immediate release.
Supplementary information
Supplementary information available online at
http://dev.biologists.org/lookup/doi/10.1242/dev.138081.supplemental
References
Avior, Y., Sagi, I. and Benvenisty, N.(2016). Pluripotent stem cells in disease modelling and drug discovery.Nat. Rev. Mol. Cell Biol.17, 170-182.
Bernardo, A. S., Faial, T., Gardner, L., Niakan, K. K., Ortmann, D., Senner, C. E., Callery, E. M., Trotter, M. W., Hemberger, M., Smith, J. C. et al. (2011). BRACHYURY and CDX2 mediate BMP-induced differentiation of human and mouse pluripotent stem cells into embryonic and extraembryonic lineages.Cell Stem Cell9, 144-155.
Bertero, A., Madrigal, P., Galli, A., Hubner, N. C., Moreno, I., Burks, D., Brown, S., Pedersen, R. A., Gaffney, D., Mendjan, S. et al. (2015). Activin/Nodal signaling and NANOG orchestrate human embryonic stem cell fate decisions by controlling the H3K4me3 chromatin mark.Genes Dev.29, 702-717.
Chapman, D. L., Agulnik, I., Hancock, S., Silver, L. M. and Papaioannou, V. E. (1996). Tbx6, a mouse T-Box gene implicated in paraxial mesoderm formation at gastrulation.Dev. Biol.180, 534-542.
Chen, T., Heller, E., Beronja, S., Oshimori, N., Stokes, N. and Fuchs, E.(2012). An RNA interference screen uncovers a new molecule in stem cell self-renewal and long-term regeneration.Nature485, 104-108.
Chen, Y., Cao, J., Xiong, M., Petersen, A. J., Dong, Y., Tao, Y., Huang, C. T.-L., Du, Z. and Zhang, S.-C.(2015). Engineering human stem cell lines with inducible gene knockout using CRISPR/Cas9.Cell Stem Cell17, 233-244.
Cheung, C., Bernardo, A. S., Trotter, M. W. B., Pedersen, R. A. and Sinha, S. (2012). Generation of human vascular smooth muscle subtypes provides insight into embryological origin-dependent disease susceptibility.Nat. Biotechnol.30, 165-173. Cooper, G. M. and Shendure, J.(2011). Needles in stacks of needles: finding disease-causal variants in a wealth of genomic data.Nat. Rev. Genet.12, 628-640. David, R., Jarsch, V. B., Schwarz, F., Nathan, P., Gegg, M., Lickert, H. and Franz, W.-M. (2011). Induction of MesP1 by Brachyury(T) generates the common multipotent cardiovascular stem cell.Cardiovasc. Res.92, 115-122.
DeKelver, R. C., Choi, V. M., Moehle, E. A., Paschon, D. E., Hockemeyer, D., Meijsing, S. H., Sancak, Y., Cui, X., Steine, E. J., Miller, J. C. et al.(2010). Functional genomics, proteomics, and regulatory DNA analysis in isogenic settings using zinc finger nuclease-driven transgenesis into a safe harbor locus in the human genome.Genome Res.20, 1133-1142.
Dobrovolskaia-Zavadskaia, N.(1927). Regarding the spontaneous mortification of the tail of a new-born mouse and the existence of a hereditary characteristic (factor).C. R. Seances Soc. Biol. Fil.97, 114-116.
Dominguez, A. A., Lim, W. A. and Qi, L. S.(2015). Beyond editing: repurposing CRISPR-Cas9 for precision genome regulation and interrogation.Nat. Rev. Mol. Cell Biol.17, 5-15.
Drost, J., van Jaarsveld, R. H., Ponsioen, B., Zimberlin, C., van Boxtel, R., Buijs, A., Sachs, N., Overmeer, R. M., Offerhaus, G. J., Begthel, H. et al.(2015). Sequential cancer mutations in cultured human intestinal stem cells.Nature521, 43-47. Ebert, M. S. and Sharp, P. A. (2010). MicroRNA sponges: progress and
possibilities.RNA16, 2043-2050.
Ellis, J.(2005). Silencing and variegation of gammaretrovirus and lentivirus vectors.
Hum. Gene Ther.16, 1241-1246.
Faial, T., Bernardo, A. S., Mendjan, S., Diamanti, E., Ortmann, D., Gentsch, G. E., Mascetti, V. L., Trotter, M. W. B., Smith, J. C. and Pedersen, R. A.(2015).
Brachyury and SMAD signalling collaboratively orchestrate distinct mesoderm and endoderm gene regulatory networks in differentiating human embryonic stem cells.Development142, 2121-2135.
Fath, S., Bauer, A. P., Liss, M., Spriestersbach, A., Maertens, B., Hahn, P., Ludwig, C., Schäfer, F., Graf, M. and Wagner, R.(2011). Multiparameter RNA and codon optimization: a standardized tool to assess and enhance autologous mammalian gene expression.PLoS ONE6, e17596.
Gluecksohn-Schoenheimer, S. (1944). The development of normal and homozygous brachy (T/T) mouse embryos in the extraembryonic coelom of the chick.Proc. Natl. Acad. Sci. USA30, 134-140.
González, F., Zhu, Z., Shi, Z.-D., Lelli, K., Verma, N., Li, Q. V. and Huangfu, D. (2014). An iCRISPR platform for rapid, multiplexable, and inducible genome editing in human pluripotent stem cells.Cell Stem Cell15, 215-226.
Haenebalcke, L., Goossens, S., Naessens, M., Kruse, N., Farhang Ghahremani, M., Bartunkova, S., Haigh, K., Pieters, T., Dierickx, P., Drogat, B. et al.(2013). Efficient ROSA26-based conditional and/or inducible transgenesis using RMCE-compatible F1 hybrid mouse embryonic stem cells.Stem Cell Rev.9, 774-785. Henriksen, J. R., Løkke, C., Hammerø, M., Geerts, D., Versteeg, R., Flaegstad, T.
and Einvik, C.(2007). Comparison of RNAi efficiency mediated by tetracycline-responsive H1 and U6 promoter variants in mammalian cell lines.Nucleic Acids Res.35, e67.
Herbst, F., Ball, C. R., Tuorto, F., Nowrouzi, A., Wang, W., Zavidij, O., Dieter, S. M., Fessler, S., van der Hoeven, F., Kloz, U. et al.(2012). Extensive methylation of promoter sequences silences lentiviral transgene expression during stem cell differentiation in vivo.Mol. Ther.20, 1014-1021.
Hockemeyer, D., Soldner, F., Beard, C., Gao, Q., Mitalipova, M., DeKelver, R. C., Katibah, G. E., Amora, R., Boydston, E. A., Zeitler, B. et al.(2009). Efficient targeting of expressed and silent genes in human ESCs and iPSCs using zinc-finger nucleases.Nat. Biotechnol.27, 851-857.
Inman, K. E. and Downs, K. M.(2006). Brachyury is required for elongation and vasculogenesis in the murine allantois.Development133, 2947-2959. Irion, S., Luche, H., Gadue, P., Fehling, H. J., Kennedy, M. and Keller, G.(2007).
Identification and targeting of the ROSA26 locus in human embryonic stem cells.
Nat. Biotechnol.25, 1477-1482.
Jiang, H., Shukla, A., Wang, X., Chen, W., Bernstein, B. E. and Roeder, R. G. (2011). Role for Dpy-30 in ES cell-fate specification by regulation of H3K4 methylation within bivalent domains.Cell144, 513-525.
King, T., Beddington, R. S. P. and Brown, N. A.(1998). The role of the brachyury gene in heart development and left-right specification in the mouse.Mech. Dev.
79, 29-37.
Lambeth, L. S. and Smith, C. A.(2013). Short hairpin RNA-mediated gene silencing.Methods Mol. Biol.942, 205-232.
Li, X., Zhao, X., Fang, Y., Jiang, X., Duong, T., Fan, C., Huang, C.-C. and Kain, S. R. (1998). Generation of destabilized green fluorescent protein as a transcription reporter.J. Biol. Chem.273, 34970-34975.
Mandal, P. K., Ferreira, L. M. R., Collins, R., Meissner, T. B., Boutwell, C. L., Friesen, M., Vrbanac, V., Garrison, B. S., Stortchevoi, A., Bryder, D. et al. (2014). Efficient ablation of genes in human hematopoietic stem and effector cells using CRISPR/Cas9.Cell Stem Cell15, 643-652.
Mandegar, M. A., Huebsch, N., Frolov, E. B., Shin, E., Truong, A., Olvera, M. P., Chan, A. H., Miyaoka, Y., Holmes, K., Spencer, C. I. et al.(2016). CRISPR interference efficiently induces specific and reversible gene silencing in human iPSCs.Cell Stem Cell18, 541-553.
Martin, B. L. (2015). Factors that coordinate mesoderm specification from neuromesodermal progenitors with segmentation during vertebrate axial extension.Semin. Cell Dev. Biol.49, 59-67.
Mendjan, S., Mascetti, V. L., Ortmann, D., Ortiz, M., Karjosukarso, D. W., Ng, Y., Moreau, T. and Pedersen, R. A.(2014). NANOG and CDX2 pattern distinct subtypes of human mesoderm during exit from pluripotency.Cell Stem Cell15, 310-325.
Ordovás, L., Boon, R., Pistoni, M., Chen, Y., Wolfs, E., Guo, W., Sambathkumar, R., Bobis-Wozowicz, S., Helsen, N., Vanhove, J. et al. (2015). Efficient recombinase-mediated cassette exchange in hPSCs to study the hepatocyte lineage reveals AAVS1 locus-mediated transgene inhibition.Stem Cell Rep.5, 918-931.
Papaioannou, V. E.(2014). The T-box gene family: emerging roles in development, stem cells and cancer.Development141, 3819-3833.
Pauklin, S. and Vallier, L.(2013). The cell-cycle state of stem cells determines cell fate propensity.Cell155, 135-147.
Pauklin, S., Madrigal, P., Bertero, A. and Vallier, L.(2016). Initiation of stem cell differentiation involves cell cycle-dependent regulation of developmental genes by Cyclin D.Genes Dev.30, 421-433.
Pourquié, O., Bruneau, B., Keller, G. and Smith, A.(2015). Looking inwards: opening a window onto human development.Development142, 1-2.
Qin, J. Y., Zhang, L., Clift, K. L., Hulur, I., Xiang, A. P., Ren, B.-Z. and Lahn, B. T. (2010). Systematic comparison of constitutive promoters and the doxycycline-inducible promoter.PLoS ONE5, e10611.
Ramachandra, C. J. A., Shahbazi, M., Kwang, T. W. X., Choudhury, Y., Bak, X. Y., Yang, J. and Wang, S. (2011). Efficient recombinase-mediated cassette