Optimal Seat and Suspension Design for a Half-Car with
Driver Model Using Genetic Algorithm
Wael Abbas1, Ashraf Emam2, Saeed Badran3, Mohamed Shebl4, Ossama Abouelatta5,6 1Engineering Physics and Mathematics Department, Faculty of Engineering (Mataria), Helwan University, Cairo, Egypt 2Automotive and Tractors Engineering Department, Faculty of Engineering (Mataria), Helwan University, Cairo, Egypt
3Electrical Engineering Department, Faculty of Engineering, Al-Baha University, Al-Baha, KSA 4Mechanical Design Department, Faculty of Engineering (Mataria), Helwan University, Cairo, Egypt
5Mechanical Engineering Department, Faculty of Engineering, Al-Baha University, Al-Baha, KSA 6Engineering and Mechanical Design Department, Faculty of Engineering, Mansoura University, Mansoura, Egypt
Email: [email protected]
Received December 27, 2012; revised January 27, 2013; accepted February 6,2013
Copyright © 2013 Wael Abbas et al. This is an open access article distributed under the Creative Commons Attribution License, which permits unrestricted use, distribution, and reproduction in any medium, provided the original work is properly cited.
ABSTRACT
This paper presents an optimal vehicle and seat suspension design for a half-car vehicle model to reduce human-body vibration (whole-body vibration). A genetic algorithm is applied to search for the optimal parameters of the seat and vehicle suspension. The desired objective is proposed as the minimization of a multi-objective function formed by the combination of seat suspension working space (seat suspension deflection), head acceleration, and seat mass accelera-tion to achieve the best comfort of the driver. With the aid of Matlab/Simulink software, a simulaaccelera-tion model is achieved. In solving this problem, the genetic algorithms have consistently found near-optimal solutions within specified parame-ters ranges for several independent runs. For validation, the solution obtained by GA was compared to the ones of the passive suspensions through sinusoidal excitation of the seat suspension system for the currently used suspension sys-tems.
Keywords: Biodynamic Response; Genetic Algorithms; Multi-Objective Optimization; Mathematical Model
1. Introduction
Recently, many people have focused their attention on the ride quality of vehicle which is directly related to driver fatigue, discomfort, and safety. As traveling in- creases, the driver is more exposed to vibration mostly originating from the interaction between the road and vehicle. Vibration will make them feel discomfort and fatigue sometimes along with injury [1]. Safety in trans- port is associated most often with solutions which help prevent accidents or minimize their effects. However, safety in case of people working professionally means also minimizing all those factors which can adversely affect the psychomotor state of the driver during the ride, as well as their subsequent health. Many researchers studies conducted in different regions of the world have shown a convincing relationship between driver health and whole-body vibration (WBV) [2].
The vibration of vehicle causes the operator’s whole body to vibrate, as opposed to just one part of their body, says their hand or foot. Harmful effects of whole-body
vibration are experienced when the exposure time is longer than the recommended standard set by ISO (ISO 2631-1, 1997) [3]. For example, vibrations between 2.5 and 5.5 Hz generate strong resonance in the vertebra of the neck and lumbar region. These situations can cause chronic musculoskeletal stress or even permanent dam- age to the effected regions. Therefore, employers should make adjustments in the light of technical progress and scientific knowledge regarding risks related to exposure to vibration, with a view to improving the safety and health protection of workers. In the case of transport, WBV controls may include the use of suspended seats, suspended cabs, vehicle suspension systems, proper tire inflation [2]. One solution to this problem is to develop an active seat and suspension systems capable of cancel- ing the vibrations felt by the operator. Several passive, semi-active, active, and fully active seats have been de- signed and built to address this problem.
comfort but also it has to control the dynamic tyre load with acceptable suspension working space to enhance the vehicle stability and safety. Thus, many researchers studies passive, active and semi-active vehicle seat and suspension design [4-11]. Some lumped-parameter mod- els were further modified to represent seated human ve- hicle’s driver with seat integrated with a vehicle model to assess the biodynamic responses of seated human-body expose to vertical vibrations in driving conditions [12- 15]. On the other hand, genetic algorithms (GA) method increases the probability of finding the global optimal solution and avoids convergence to a local minimum which is a drawback of gradient-based methods [16,17]. Therefore, genetic algorithms optimization is used to determine both the active control and passive mechanical parameters of a vehicle suspension system and to mini- mize the extreme acceleration of the passenger’s seat, subjected to constraints representing the required road- holding ability and suspension working space.
Head
m1 k1 c1
x2 x1
x3
xse x4 k2 c2
k3 c 3
c4 k4
cs ks
cse
kse V
xb
L2 L1
csf ksf
ctf ktf csr
ksr
ctr ktr
xwf xwr
xor
xof
H
Lw
L Car body: mb
This paper presents a 4-DOF human-body model de- veloped by authors [15], with linear seat suspension cou- pled with half car model. In this model, a genetic algo- rithm was applied to search for the optimal parameters of the seat and vehicle suspension to reduce human vibra- tion (whole-body vibration) and to achieve the best comfort of the driver.
2. Mathematical Model Formulations
2.1. Proposal Model
This section is devoted to the mathematical modeling of proposed model, including the biodynamic lumped hu- man linear seat model coupled with half-car model of ground vehicles as illustrated in Figure 1.
A half-car model with 4-DOF is considered, taking into account pitch motion of the vehicle’s body. The degrees of freedom are; vertical body displacement xb, vehicle body pitch angle θ, front wheel displacement xwf and rear wheel displacement xwr. The front wheel of the vehicle is represented by the mass mwf, the damping coefficient Ctf and the spring coefficient Ktf. Similarly the rear wheel is represented by the mass mwr, the damping coefficient Ctr and the spring coefficient Ktr. The suspensions of the front and rear wheels are described by the damper’s coefficients
Csf and Csr and the spring’s coefficients Ksf and Ksr, respectively. The mass mb and the inertia I represent the vehicle body sprung mass. The location of the centre of gravity is given by L1 and L2. Typical design parameters
for the half-car and seat suspension are listed in Table 1. The human-body, has a 4-DOF that proposed by Abbas et al. [15]. In this model, the seated human-body was constructed with four separate mass segments inter- connected by five sets of springs and dampers, with a total human mass of 60.67 kg. The four masses represent
, I
a
Upper torso, m2
Thi hs (Pelvic), m4
Lower torso, m3
g
Seat, mse
Rear wheel, mtr
Rear wheel, mtf
Front Road input
[image:2.595.310.534.85.396.2]Rear
[image:2.595.310.538.451.663.2]Figure 1. Schematic diagram of biodynamic lumped hu-manseat coupled with a half-car model.
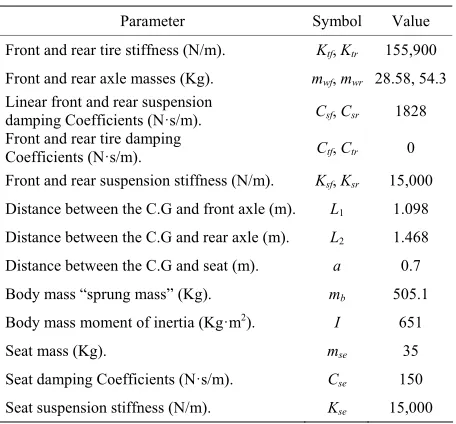
Table 1. Half-car and seat suspension model parameters.
Parameter Symbol Value
Front and rear tire stiffness (N/m). Ktf, Ktr 155,900 Front and rear axle masses (Kg). mwf, mwr 28.58, 54.3 Linear front and rear suspension
damping Coefficients (N·s/m). Csf, Csr 1828 Front and rear tire damping
Coefficients (N·s/m). Ctf, Ctr 0
Front and rear suspension stiffness (N/m). Ksf, Ksr 15,000 Distance between the C.G and front axle (m). L1 1.098
Distance between the C.G and rear axle (m). L2 1.468
Distance between the C.G and seat (m). a 0.7 Body mass “sprung mass” (Kg). mb 505.1 Body mass moment of inertia (Kg·m2). I 651
Seat mass (Kg). mse 35
Seat damping Coefficients (N·s/m). Cse 150 Seat suspension stiffness (N/m). Kse 15,000
the following body segments: head and neck (m1), upper
torso (m2), lower torso (m3), and thighs and pelvis (m4).
(k4) and (c4), upper torso are (k2, k3) and (c2, c3), and head
[image:3.595.62.290.198.613.2]are (k1) and (c1). The schematic of the model is shown in
Figure 1, and biomechanical parameters of the model are listed in Table 2.
2
2
wf wf tf of sf b sf b sf tf of
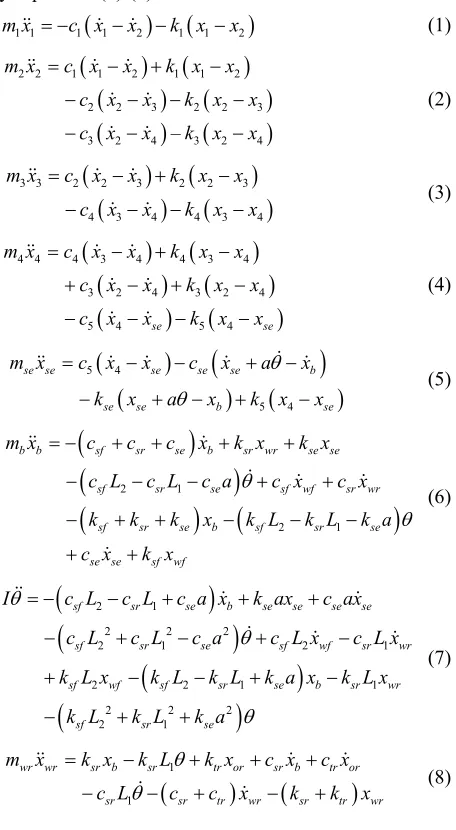
2.2. Equations of Motion
The different motions of a nine degree-of-freedom of the resulting half-car and seat suspension modelare governed by Equations (1)-(9).
1 1 1 1 2
m x c x x k x1 1x2 (1)
2 2 1 1 2
2 2 3
3 2 4
m x c x x
c x x
c x x
1 1 2
2 2 3
3 2 4
–
k x x
k x x
k x x
(2)
3 3 2 2 3
4 3 4
m x c x x
c x x
2 2 3
4 3 4
k x x
k x x
4 3 4
3 2 4
5 4
(3)
4 4 4 3 4
3 2 4
5 4 se se
x x
k x x
k x x
5 4 bm x c x x k
c x x
c x x
(4)
5 4se se se se se
se se b
k x a x
b b sf sr se b
m x c c c x
se
c x a x
k x x
2 1sr wr se se
sr wr
sr se
k x k x
c x
k L k a
m x c x x
(5)
2 1
sf sr se sf wf
sf sr se b sf
se se sf wf
c L c L c a c x
k k k x k L
c x k x
(6)
2 2 2
2 1
2 2 1
2 2 2
2 1
2 1
sf sr se b se se
2 1
1
se se
sf sr se sf wf sr wr
sf wf sf sr se
sf sr se
c L c L c a c L
k L x k L k L k a
k L k L k a
1
wr wr sr b sr tr or sr b
b sr wr
x c ax
x c L x
x k L x
tr orI c L c L c a x k a
(7)
1
sr sr tr
c L c c x
wr sr tr wr
c x
k k x
m x k x k Lk x c x
[image:3.595.58.287.635.736.2] (8)
Table 2. Biomechanical parameters of Abbas model.
Mass (kg) Damping Coefficient (N·s/m) Spring constant (N/m)
m1 = 4.17 C1 = 310 k1 = 166,990
m2 = 15.0 C2 = 200 k2 = 10,000
m3 = 5.5 C3 = 909.1 k3 = 144,000
m4 = 36 C4 = 330 k4 = 20,000
- C5 = 2475 k5 = 49,340
sf tf wf sf sf tf wf
m x c x c x k x k L k x
k k x c L c c x
(9)2.3. Input Profile Excitations
In this work, the sinusoidal road profiles excitation is adopted to evaluate the proposed system. The sinusoidal road equations are listed below:
sin ,
of B
x H t
sin or B
x H t
(10)
(11)
where, ωis the radian frequency of the road and is equal to πV LB.
Mathematical model of road profile can be derived as the follows: vehicle with wheelbase Lw passing over each hump with speed V will have front ground displacement
xof. The rear ground xor follows the same track as the front with a given time delay , (wheelbase correlation) and that is equal to the wheelbase divided by vehicle speed w . This study assumed that the vehicle model travels with the constant velocity of 20 km/h (5.5 m/s), HB (0.035 m) is the hump height, and LB (1 m) is the width of the hump.
L V
3. Optimal Linear Seat Suspension Design
3.1. Numerical Simulations
The displacement, velocity, and acceleration for the model in terms of time domain are obtained by solving equations of motion represented by Equations (1)-(9), us- ing Matlab/SimulinkTM software (R2012b). The initial
conditions are assumed at equilibrium position. In this assumption, the driver is seated, where the input excita- tion has not been provided to the seat. Therefore, the initial velocity and displacement for each mass are equal to zero.
3.2. Optimization via Genetic Algorithms
Genetic algorithm is a stochastic global search method which is based on the metaphors of natural biological evolution, according to Darwin (1809-1882) evolution theory. Genetic algorithm has abilities that differ sub- stantially from more traditional search and optimization methods. Genetic Algorithms (GAs) are employed to search for the optimal linear parameters of the seat and vehicle suspension to achieve the best comfort of the driver. The upper and lower boundaries of seat and vehi- cle suspension parameters are selected based on previous studies. Table 3 shows the genetic algorithm parameters and its values.
3.2.1. Objective Function
bility of the car, the desired objective is proposed as the minimization of a multi-objective function formed by the combination of not only seat suspension working space (seat suspension deflection “ssws”) but also the head ac- celeration
x1 , and seat mass acceleration
xse
. Theclassical weighted sum approaches has been used to solve a multi-objective optimization problem as shown in Equation (12).
1 1 2 s w3 xse
OBJ w x w sw (12)
where, w1, w2 and w3 are weighting factors to emphasize
the relative importance of the terms. Table 4 shows weighting factors that used in excitation inputs.
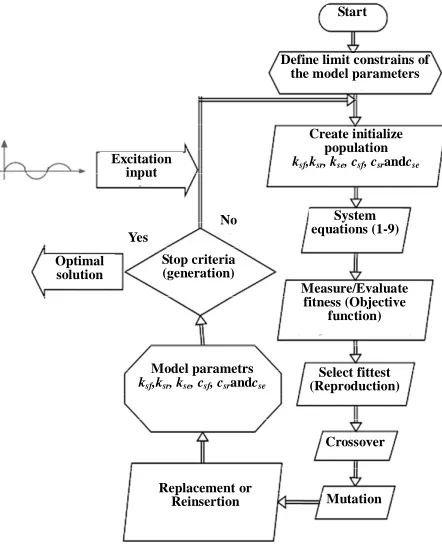
3.2.2. Optimization Procedure
[image:4.595.314.535.367.646.2]Genetic algorithms initialize seat and suspension design variables ksf ,ksr, kse, csf, csr and cse (Initial Population). The initial populations are passed into the proposal model to solve the dynamic responses (displacement and acceleration) of the system. The population is then coded into chromosomes, a binary representation of a solution. An evaluation function rates solutions in terms of their fitness. Here, fitness is a numerical value describing the probability for a solution (genome) to survive and repro- duce. Only a portion of the population (survivors or solu- tions with higher fitness values) is selected for creating a new population. This new population is created by using a crossover operator. Crossover is a procedure for ex- changing pieces of chromosome data with one another. Crossover allows genes that generate good fitness to be preserved and enlarged in a new generation of the popu-
Table 3. Genetic algorithm parameters.
GA parameter Value
Population size 50
No of generations 1000
Fitness scaling Rank
Crossover technique Heuristic
Probability of crossover 0.8
Mutation technique Uniform
Generation gap 0.9
Lower boundaries 200-9000-1000-9000-1000-9000
Upper boundaries 1000-60000-3000-60000-3000-60000
[image:4.595.59.285.485.694.2]Objective function accuracy 1e−15
Table 4. Weighting factors.
Weightfactor w1 w2 w3
Weight value 0.5 0.3 0.2
lation. Mutation is a genetic operator and it randomly flips the bits of an offspring’s genotype. This is equiva- lent to perturbing the mated population stochastically. Mutation prevents the population from homogenizing in a particular set of genes such that any gene in a genera- tion has a certain probability of being mutated in future generations. The new population is being mixed up to bring some new information into this set of genes, and this needs to happen in a well-balanced way.
Once the new generation is created, the aforemen- tioned steps are repeated until some convergence criteria are satisfied, such as running time or fitness. The overall technique is summarized in the flowchart as illustrated in Figure 2.
4. Results and Discussion
The optimal seat and vehicle suspension parameters of the present model are determined by genetic algorithms, compared with current passive parameters, andlisted in Table 5.
Figures 3 and 4 present the history of the some selec- ted response components of the human model in case of
Start
Define limit constrains of the model parameters
Create initialize population
ksf,ksr, kse, csf, csrandcse
Excitation input
System equations (1-9) No
Yes
Crossover
Mutation Optimal
solution
Stop criteria (generation)
Measure/Evaluate fitness (Objective
function)
Model parametrs
ksf,ksr, kse, csf, csrandcse
Select fittest (Reproduction)
Replacement or Reinsertion
Figure 2. Design process using GA.
Table 5. The design results from the GA program.
Seat suspension setting
Kse (N/m)
Cse (N·s/m)
Ksf (N/m)
Csf (N·s/m)
Ksr (N/m)
Csr (N·s/m) Passive 15000 150 15000 1828 15000 1828
[image:4.595.310.536.681.736.2]0 1 2 3 4 5 -0.4
-0.3 -0.2 -0.1 0 0.1 0.2
0.3 0.3
Time (sec)
H
e
ad
d
is
p
lac
em
en
t
(m
)
Passive Genetic
0 1 2 3 4 5
-0.4 -0.3 -0.2 -0.1 0 0.1 0.2
Time (sec)
U
ppe
r t
o
rs
o di
s
pl
a
c
e
m
e
nt
(
m
) PassiveGenetic
(a) (b)
0 1 2 3 4 5
-0.4 -0.3 -0.2 -0.1 0 0.1 0.2
0.3 0.3
Time (sec)
L
o
w
e
r to
rs
o
d
isp
lacem
en
t (m
) PassiveGenetic
0 1 2 3 4 5
-0.4 -0.3 -0.2 -0.1 0 0.1 0.2
Time (sec)
P
e
lv
ic
d
is
p
la
c
e
m
e
n
t
(m
)
Passive Genetic
[image:5.595.120.475.89.390.2](c) (d)
Figure 3. Human displacement histories obtained: (a) Head; (b) Upper torso; (c) Lower torso; and (d) Pelvic.
20
0 1 2 3 4 5
-20 -15 -10 -5 0 5 10 15 20
Time (sec)
H
e
a
d
accel
er
ati
o
n
(m
/s
2)
Passive Genetic
0 1 2 3 4 5
-20 -15 -10 -5 0 5 10 15
Time (sec)
U
p
p
er
t
o
rso
a
cceler
at
io
n
(m
/s
2)
Passive Genetic
(a) (b)
0 1 2 3 4 5
-20 -15 -10 -5 0 5 10 15
20 20
Time (sec)
L
o
w
er
t
o
rso
ac
celer
at
io
n
(
m
/s
2)
Passive Genetic
0 1 2 3 4 5
-20 -15 -10 -5 0 5 10 15
Time (sec)
P
elvi
c
a
cceler
a
tio
n
(
m
/s
2)
Passive Genetic
(c) (d)
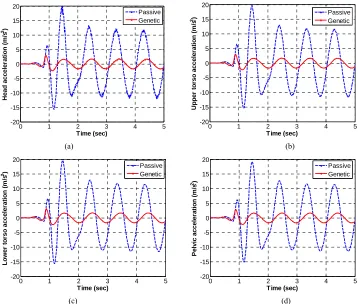
[image:5.595.118.476.415.719.2]sinusoidal excitation. In particular, the results in Figure 3 shows the displacement histories obtained for head, up- per torso, lower torso, and pelvis respectively. Figure 4 depicts the acceleration histories obtained from the hu- man-body model. The obtained results by genetic algo- rithms method were compared with passive model.
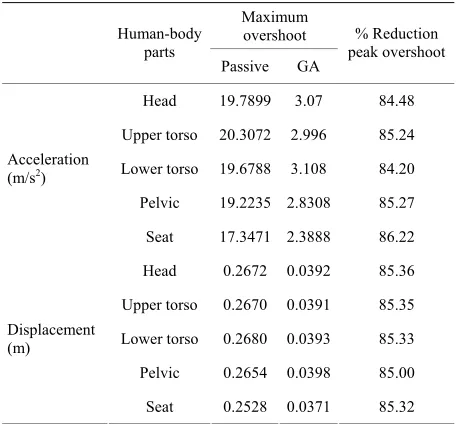
On the other hand, Figure 5 presents seat acceleration, seat displacement and vehicle body acceleration. Table 6 lists the reduction of the human’s vertical acceleration and displacement peaks. It can be observed that the re- duction of the human’s vertical peak acceleration is about85% in case of GA suspension as compared with passive suspension. The reduction of the human’s vertical displacement peak is about85% in case of GA suspension
0 1 2 3 4 5
-15 -10 -5 0 5 10 15 20
Time (sec)
P
as
sen
g
er
s
eat
acceler
at
io
n
(
m
/s
2) Passive
Genetic
(a)
0 1 2 3 4 5
-0.4 -0.3 -0.2 -0.1 0 0.1 0.2 0.3
Time (sec)
S
eat di
sp
la
cem
ent (m
)
Passive Genetic
(b)
0 1 2 3 4 5
-10 -5 0 5 10
Time (sec)
V
eh
icle b
o
d
y
ver
ticle ac
cel
e
ra
tio
n
(m
/s
2) Passive
Genetic
(c)
Figure 5. (a) Seat acceleration; (b) Seat displacement; and (c) Vehicle body acceleration.
[image:6.595.88.256.265.703.2]as compared with passive suspension. Also, the reduction of the seat vertical peak acceleration is 86.22% and the reduction of the seat vertical displacement peak is 85.32% of GA suspension as compared with passive suspension.
Table 7 shows a comparison between the RMS results obtained from GA compared to those passive results in terms. From this table, the percentage improvement for head acceleration is 85.24%, for upper torso acceleration is 85.18%, for lower torso acceleration is 85.19%, and for pelvic acceleration is 85.23%. On the other hand, the percentage improvement for seat acceleration is 85.27%.
5. Conclusions
[image:6.595.309.537.407.619.2]Genetic algorithm optimization is a global optimization technique, searching for a design that minimizes an ob- jective function subject to constraints. Genetic algorithm was used to design the seat and vehicle suspension sys- tem via a half-car suspension model. The desired objec- tive is proposed as the minimization of a multi-objective function formed by the combination of seat suspension working space, head acceleration, and seat mass for the best reduction of human vibration (whole-body vibration) and to achieve the best comfort of the driver. In all simu- lation runs, it can be observed that:
Table 6. Reduction in peak values for half-car model.
Maximum overshoot Human-body
parts
Passive GA
% Reduction peak overshoot
Head 19.7899 3.07 84.48
Upper torso 20.3072 2.996 85.24
Lower torso 19.6788 3.108 84.20
Pelvic 19.2235 2.8308 85.27 Acceleration
(m/s2)
Seat 17.3471 2.3888 86.22
Head 0.2672 0.0392 85.36
Upper torso 0.2670 0.0391 85.35
Lower torso 0.2680 0.0393 85.33
Pelvic 0.2654 0.0398 85.00
Displacement (m)
[image:6.595.310.536.647.733.2]Seat 0.2528 0.0371 85.32
Table 7. RMS improvement results for half-car model.
RMS acceleration
Head Upper torso Lower torso Pelvic Seat
Passive 8.076 8.067 8.110 7.990 7.479
GA 1.192 1.195 1.201 1.180 1.102
The genetic algorithm has been able to find optimal suspension systems which are similar to those found with local optimization search methods.
The results of optimal seat and vehicle suspensions system by using genetic algorithms has successfully managed improving for all the dynamic performance parameters.
The numerical results and the plots indicate that op- timal system is less oscillatory, and have lower values of maximum over shoots than passive suspension system. This is directly related to driver fatigue, dis- comfort, and safety.
These results are encouraging and suggest that genetic algorithm can be easily used in other complex and realis- tic designs often encountered in the engineering.
7. Acknowledgements
This research is a part of a project titled “Optimal seat suspension design for a quarter-car with human-body model using genetic algorithms”. This project was sup- ported by the Deanship of Scientific Research, Al-Baha University, KSA (Grant No. 3/1433).The assistance of Faculty Deanship of Scientific Research is gratefully ac- knowledged.
REFERENCES
[1] W. Abbas, O. B. Abouelatta, M. El-Azab, M. Elsaidy and A. A. Megahed, “Optimal Seat Suspension Design Using Genetic Algorithms,” Journal of Mechanics Engineering
and Automation, Vol. 1, No. 1, 2011, pp. 44-52.
[2] A. Gągorowski, “Simulation Study on Stiffness of Sus- pension Seat in the Aspect of the Vibration Assessment Affecting a Vehicle Driver,” Logistics and Transport, Vol. 11, No. 2, 2010, pp. 55-62.
[3] ISO 2631-1, “Mechanical Vibration and Shock Evalua- tion of Human Exposure to Whole-Body Vibration—Part 1: General Requirements,” International Organization for Standardization, 1997.
[4] L. Sun, “Optimum Design of ‘Road-Friendly’ Vehicle Suspension Systems Subjected to Rough Pavement Sur- faces,” Applied Mathematical Modelling, Vol. 26, No. 5, 2002, pp. 635-652. doi:10.1016/S0307-904X(01)00079-8 [5] M. Bouazara, M. J. Richard and S. Rakheja, “Safety and
Comfort Analysis of a 3-D Vehicle Model with Optimal Non-Linear Active Seat Suspension,” Journal of Terra-
mechanics, Vol. 43, No. 2, 2006, pp. 97-118.
doi:10.1016/j.jterra.2004.10.003
[6] L. Sun, X. Cai and J. Yang, “Genetic Algorithm-Based Optimum Vehicle Suspension Design Using Minimum Dynamic Pavement Load as a Design Criterion,” Journal
of Sound and Vibration, Vol. 301, No. 1-2, 2007, pp.
18-27. doi:10.1016/j.jsv.2006.08.040
[7] Ö. Gündoğdu, “Optimal Seat and Suspension Design for
a Quarter Car with Driver Model Using Genetic Algo- rithms,” International Journal of Industrial Ergonomics, Vol. 37, No. 4, 2007, pp. 327-332.
doi:10.1016/j.ergon.2006.11.005
[8] H. S. Hassanin, A. M. Rabeih, S. M. El-Demerdash and K. Y. Younes, “Active Suspension of Highway Truck Seat Using Genetic Algorithms,” SAE International, Paper No. -01-1458, 2008. doi:10.4271/2008-01-1458
[9] M. Brogioli, M. Gobbi, G. Mastinu and M. Pennati, “Pa- rameter Sensitivity Analysis of a Passenger/Seat Model for Ride Comfort Assessment,” Experimental Mechanics, Vol. 51, No. 8, 2011, pp. 1237-1249.
doi:10.1007/s11340-010-9460-1
http://link.springer.com/content/pdf/10.1007%2Fs11340-010-9460-1
[10] M. El-Kafafy, S. M. El-Demerdash and A. M. Rabeih, “Automotive Ride Comfort Control Using MR Fluid Damper,” SCIRP Journal of Engineering, Vol. 4, 2012, pp. 179-187.
www.scirp.org/journal/PaperDownload.aspx?paperID=18 818
[11] J. J. Zhang, R. Z. Gao, Z. Y. Zhao and W. S. Han, “Fuzzy Logic Controller Based Genetic Algorithm for Semi-Ac- tive Suspension,” Journal of Scientific and Industrial Re-
search, Vol. 71, 2012, pp. 521-527.
http://nopr.niscair.res.in/bitstream/123456789/14520/1/JS IR%2071%288%29%20521-527.pdf
[12] M. K. Patil, M. S. Palanichamy and N. G. Dhanjoo, “Mi- nimization of the Vertical Vibrations Sustained by a Trac- tor Operator, by Provision of a Standard-Type Tractor Seat Suspension,” Annals of Biomedical Engineering, Vol. 6, No. 2, 1978, pp. 138-153. doi:10.1007/BF02584540 http://link.springer.com/content/pdf/10.1007%2FBF0258 4540
[13] F. Amirouche, L. Palkovics and J. Woodrooffe, “Optimal Driver Seat Suspension Design for Heavy Trucks,” Inter-
national Journal of Heavy Vehicle Systems, Vol. 2, No. 1,
1995, pp. 18-45.
[14] C. Papalukopoulos and S. Natsiavas, “Nonlinear Biody- namics of Passengers Coupled with Quarter Car Models,”
Journal of Sound and Vibration, Vol. 304, No. 1-2, 2007,
pp. 50-71. doi:10.1016/j.jsv.2007.01.042
[15] W. Abbas, O. B. Abouelatta, M. El-Azab, M. Elsaidy and A. A. Megahed, “Optimization of Biodynamic Seated Hu- man Models Using Genetic Algorithms,” SCIRP Journal
of Engineering, Vol. 2, 2010, pp. 710-719.
www.scirp.org/journal/PaperDownload.aspx?paperID=27 96
[16] A. E. Baumal, J. J. McPhee and P. H. Calamai, “Applica- tion of Genetic Algorithms to the Design Optimization of an Active Vehicle Suspension System,” Computer Meth-
ods in Applied Mechanics and Engineering, Vol. 163, No.
1, 1998, pp. 87-94. doi:10.1016/S0045-7825(98)00004-8 [17] R. Alkhatib, G. N. Jazar and M. F. Golnaraghi, “Optimal