Original Article
Elevated blood pressure variability is associated with
incidence of sepsis-associated encephalopathy
Zhichao Xie1,2,3, Xuelian Liao3, Yan Kang3, Xiaoqi Xie3, Xiaoli He1,2,3
1West China Second University Hospital, Sichuan University, China; 2Key Laboratory of Birth Defects and Related Diseases of Women and Children (Sichuan University), Ministry of Education, China; 3Department of Critical Care Medicine, West China Hospital, Sichuan University, China
Received June 14, 2017; Accepted October 25, 2018; Epub March 15, 2019; Published March 30, 2019
Abstract: Background: Cerebral microcirculation disorder is associated with the pathophysiology of sepsis-asso-ciated encephalopathy (SAE). Blood pressure variability could be involved in the altered cerebral microcirculation due to dysfunctional cerebral autoregulation in septic patients. Methods: In this prospective study, blood pressure was monitored to analyze its variability in septic patients. The cognitive ability of these patients was assessed daily using the Confusion Assessment Method for the Intensive Care Unit (CAM-ICU) test. Survivors were followed-up for a 12-month period. Results: Forty percent of sepsis patients (n = 45) presented with delirium. The cut-off value (8.94 mmHg) of BP variability was detected by ROC curve analysis. Patients with high BP variability (> 8.94 mmHg) presented with a greater degree of delirium (60.7% vs. 19.6%, P < 0.001) with higher Sequential Organ Failure Assessment (SOFA) scores (10.29 ± 4.82 vs. 7.7 ± 3.48, P = 0.014) and mortality (41.1% vs. 23.2%, P < 0.05). Multivariate logistic regression analysis showed that BP variability was related to delirium (OR: 1.17, 95% CI: 1.02-1.33, P = 0.02), and death following within 28 days (OR: 1.17, 95% CI: 1.00-1.37, P < 0.05), independent of mean BP and vasoactive drug usage. Conclusions: Elevated BP variability is positively related to clinical signs of SAE and mortality in septic patients.
Keywords: Blood pressure, variability, sepsis-associated encephalopathy
Introduction
Sepsis is one of the most intractable syn-dromes in the setting of an intensive care unit (ICU) and has perplexed critical care physicians for decades. In addition to the continuing high mortality despite the implementation of Sur- viving Sepsis Campaign (SSC) bundles, the so- cial function and quality of life of many survi-vors are still extensively impaired by the long-term complications of sepsis [1]. As one of the most challenging complications, sepsis-associ-ated encephalopathy (SAE) is defined by dif-fuse cerebral dysfunction during the course of sepsis in the absence of direct CNS infection or other types of encephalopathy [2]. SAE is char-acterized by an acute-onset diffuse cerebral dysfunction and a variety of clinical manifesta-tions such as delirium, seizures, coma, and altered mental status. It occurs in more than half of patients with sepsis, and is associated with increased mortality or long-term cognitive dysfunction [3].
The pathophysiology of SAE has not been es- tablished, but several potential mechanisms have been proposed, including altered cerebral microcirculation. Cerebral autoregulation (CA) plays an important role in the intricate process by which stable cerebral perfusion is main-tained against changes in arterial blood pres-sure (BP) [4]. However, in patients with sepsis, CA is impaired due to excessive systemic inflam-mation [5], with consequential influences on cerebral blood flow due to the variation in BP. Therefore, we conducted this study to investi-gate if variation of BP is a risk factor which con-tributes to the development and progression of SAE in septic patients.
Materials and methods
Subjects
2014 to December 2015. Patients admitted or diagnosed with sepsis in the ICU were included in the study. Sepsis was defined according to standard international criteria [6]. Severe sep-sis was defined by the presence of two or more diagnostic criteria of the systemic inflammatory response syndrome, proven or suspected infec-tion, and dysfunction of at least one organ. The Ethics Committee of the West China Hospital approved the study protocol.
Patients with one or more of the following con-ditions were excluded: 1) aged less than 18 years, 2) known cerebral lesions (ischemic or
od. The severity of illness was assessed ac- cording to the Acute Physiology and Chronic Health Evaluation (APACHE) II score and the Sequential Organ Failure Assessment (SOFA) score.
Delirium assessment
We evaluated patients twice daily to detect neurological dysfunction, inattention or altered level of consciousness using the Confusion As- sessment Method for the Intensive Care Unit (CAM-ICU), which is the most valid and reliable evaluation tool in delirium assessment [7]. Se- dated patients were evaluated at least 4 h af- ter the cessation of medication.
BP measurement
All the patients underwent 24-h BP monitoring after admission using a non-invasive monitor (IntelliVue MP60, Philips, Netherlands). The BP cuff was fitted to one of the participant’s arms; the cuff size was determined by the upper arm circumference. BP measurements were record-ed at 60-min intervals. BP variability (BPV) was calculated as the standard deviation (SD) of mean arterial pressure (MAP) on the first study day. The mean BP was calculated as an overall 24-h average of MAP for each patient.
Statistical analysis
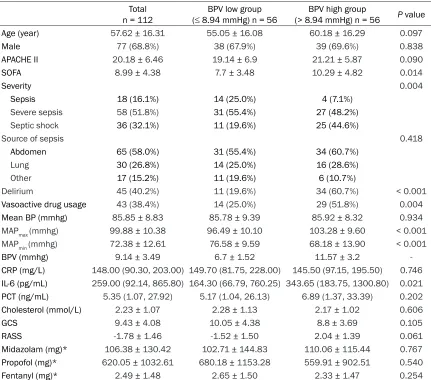
Statistical analysis was performed with SPSS software (IBM, USA). Receiver operating char-acteristic (ROC) curve analysis was used to Figure 2. ROC curve analysis. ROC curve for the
blood pressure variability to separate patients who
presented with delirium from those who didn’t.
hemorrhagic cerebrovascular event, neoplasm), 3) cerebral infection, 4) after cardiopulmo-nary resuscitation, 5) expected ICU stay less than 72 h, and 6) pregnancy.
Data collection
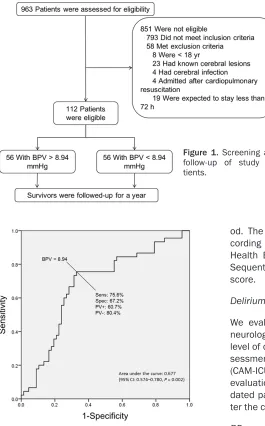
We collected demographic in-formation, as well as length of stay in the ICU, duration of me-chanical ventilation, source of sepsis, and sedative drug us-age. Clinical and laboratory data concerning organ failure and inflammation were also compiled. Survivors were fol-lowed-up for a 12-month peri-Figure 1. Screening and
[image:2.612.94.359.73.499.2]assess the BPV on the first day to predict delir-ium and determine a cut-off value with optimal sensitivity and specificity. Patients were divided into two groups according to the cut-off value. For continuous variables, Student’s t-test was used for normally distributed data and the Mann-Whitney U-test was used for skewed
vari-Results
A total of 112 patients with sepsis were includ-ed in this study, while 58 patients who met the exclusion criteria were excluded. Figure 1
[image:3.612.91.522.83.463.2]shows the basis for inclusion of the patients. Abdominal infection was the major source of
Table 1. Characteristics and laboratory results in the high and low BPV groups Total
n = 112 (≤ 8.94 mmHg) n = 56BPV low group (> 8.94 mmHg) n = 56BPV high group P value
Age (year) 57.62 ± 16.31 55.05 ± 16.08 60.18 ± 16.29 0.097
Male 77 (68.8%) 38 (67.9%) 39 (69.6%) 0.838
APACHE II 20.18 ± 6.46 19.14 ± 6.9 21.21 ± 5.87 0.090
SOFA 8.99 ± 4.38 7.7 ± 3.48 10.29 ± 4.82 0.014
Severity 0.004
Sepsis 18 (16.1%) 14 (25.0%) 4 (7.1%)
Severe sepsis 58 (51.8%) 31 (55.4%) 27 (48.2%)
Septic shock 36 (32.1%) 11 (19.6%) 25 (44.6%)
Source of sepsis 0.418
Abdomen 65 (58.0%) 31 (55.4%) 34 (60.7%)
Lung 30 (26.8%) 14 (25.0%) 16 (28.6%)
Other 17 (15.2%) 11 (19.6%) 6 (10.7%)
Delirium 45 (40.2%) 11 (19.6%) 34 (60.7%) < 0.001
Vasoactive drug usage 43 (38.4%) 14 (25.0%) 29 (51.8%) 0.004
Mean BP (mmhg) 85.85 ± 8.83 85.78 ± 9.39 85.92 ± 8.32 0.934
MAPmax (mmhg) 99.88 ± 10.38 96.49 ± 10.10 103.28 ± 9.60 < 0.001
MAPmin (mmhg) 72.38 ± 12.61 76.58 ± 9.59 68.18 ± 13.90 < 0.001
BPV (mmhg) 9.14 ± 3.49 6.7 ± 1.52 11.57 ± 3.2
-CRP (mg/L) 148.00 (90.30, 203.00) 149.70 (81.75, 228.00) 145.50 (97.15, 195.50) 0.746 IL-6 (pg/mL) 259.00 (92.14, 865.80) 164.30 (66.79, 760.25) 343.65 (183.75, 1300.80) 0.021 PCT (ng/mL) 5.35 (1.07, 27.92) 5.17 (1.04, 26.13) 6.89 (1.37, 33.39) 0.202
Cholesterol (mmol/L) 2.23 ± 1.07 2.28 ± 1.13 2.17 ± 1.02 0.606
GCS 9.43 ± 4.08 10.05 ± 4.38 8.8 ± 3.69 0.105
RASS -1.78 ± 1.46 -1.52 ± 1.50 2.04 ± 1.39 0.061
Midazolam (mg)* 106.38 ± 130.42 102.71 ± 144.83 110.06 ± 115.44 0.767 Propofol (mg)* 620.05 ± 1032.61 680.18 ± 1153.28 559.91 ± 902.51 0.540
Fentanyl (mg)* 2.49 ± 1.48 2.65 ± 1.50 2.33 ± 1.47 0.254
*, the data of Midazolam, Propofol and Fentanyl are the total dose during the first three days. BPV: blood pressure variability;
CRP: C-reactive protein; IL-6: Interleukin 6; PCT: Procalcitonin; GCS: Glasgow Coma Score; RASS: Richmond Agitation-Sedation Scale.
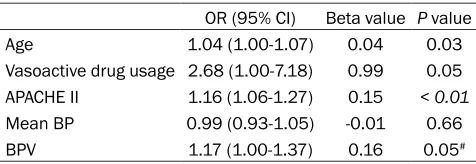
Table 2. Multivariable logistic regression analysis with delirium as the dependent variable
OR (95% CI) Beta value P value
Age 1.00 (0.97-1.03) 0.00 0.98
Vasoactive drug usage 0.96 (0.40-2.28) -0.05 0.92
APACHE II 1.11 (1.03-1.19) 0.10 0.01
Mean BP 1.04 (0.99-1.09) 0.04 0.14
BPV 1.17 (1.02-1.33) 0.15 0.02
BPV: blood pressure variability.
[image:3.612.92.336.543.624.2]sepsis (58%). Forty five patients (40.2%) pre-sented with delirium (positive CAM-ICU test), of which 38 tested positive in the first three days.
ROC analysis
ROC curve analysis indicated that the area under the curve (AUC) for BPV to predict the presence of delirium was 0.677 (95% confi-dence intervals (CI), 0.57-0.78, P < 0.01). A cut-off value of 8.94 was set with sensitivity of 76% and specificity of 67% (Figure 2).
Higher BPV is related to worse outcome
Demographic characteristics and laboratory results of the patients are presented in Table 1. Patients with high BP variability (> 8.94 mmHg) presented a higher prevalence of deliri-um (60.7% vs. 19.6%, P < 0.001) with higher SOFA scores (10.29 ± 4.82 vs. 7.7 ± 3.48, P = 0.014). The prevalence of septic shock was greater in patients with high BP variability (44.6% vs. 19.6%, P = 0.004). Vasoactive drugs were administered more frequently in the pa- tients with high BPV (51.8% vs. 25.0%, P = 0.004).
Multivariate logistic regression analysis showed that BPV was related to delirium (OR (odds ratio): 1.17, 95% CI: 1.02–1.33, P = 0.02; Table 2, Table S1), and death within 28 days (OR: 1.17, 95% CI: 1.00-1.37, P < 0.05; Table 3, Table S2). The performance of mean BP in pre-dicting delirium and death was poor.
Follow-up data analysis
The length of mechanical ventilation-free ICU stay, hospital stay and ICU stay were similar between the BPV high and BPV low groups. The same situation was found in the usage of con-tinuous renal replacement therapy. The 28 day-mortality was much higher in the BPV high group (41.1% vs. 23.2%, P < 0.05; Table 4).
suggests that instability and variability in BP are also important [8]. Autoregulation of the cardiovascular, neural and endocrine systems allows maintenance of relatively constant BP, and physiological variation with circadian rhy- thm. BPV can be measured in the short-term over minutes or hours, or in long-term over weeks and months. The 24-h BPV, which is the result of both external stimulation and cardio-vascular control, is believed to provide eviden- ce of cardiovascular complications and possi-ble end-organ damage [9]. In patients with sep-sis, we found a higher incidence of delirium in those with high BPV. Increased BPV was also associated with higher mortality after adjusting for age, APACHE II score, vasoactive drug usage and mean BP.
[image:4.612.90.328.95.177.2]Several studies have reported that 24-h BPV is associated with target-organ damage, indepen-dent of mean BP [10-12]. Acute increases in BP, for example, may cause injury to cerebral ves-sels, then sometimes lead to hemorrhage. In patients with dysfunctional autoregulation of small cerebral vessels, constriction of these vessels due to a huge increases in BP might reduce the already poor perfusion of subcorti-cal or border zone areas, especially if BP then falls. The clinical correlations between BPV and cerebral dysfunction are thought to underlie several pathophysiological mechanisms of sep-sis; however, the exact mechanisms have not yet been elucidated clearly. Patients with sep-sis have excessive systemic inflammation char-acterized by high levels of C-reactive protein, cytokines and pro-calcitonin. The inflammatory cascade in microglia is activated by mediators passing from the serum through the damaged blood-brain barrier [13]. The resulting distur-bances in CA are probably due to endothelial dysfunction mediated by the excessive inflam-mation in the brain [5]. Variations in BP can cause spasms in large cerebral arteries, alth- ough the repeated expansion and contraction
Table 3. Multivariable logistic regression analysis with death (28 day) as the dependent variable
OR (95% CI) Beta value P value
Age 1.04 (1.00-1.07) 0.04 0.03
Vasoactive drug usage 2.68 (1.00-7.18) 0.99 0.05 APACHE II 1.16 (1.06-1.27) 0.15 < 0.01 Mean BP 0.99 (0.93-1.05) -0.01 0.66
BPV 1.17 (1.00-1.37) 0.16 0.05#
#, P < 0.05. BPV: blood pressure variability.
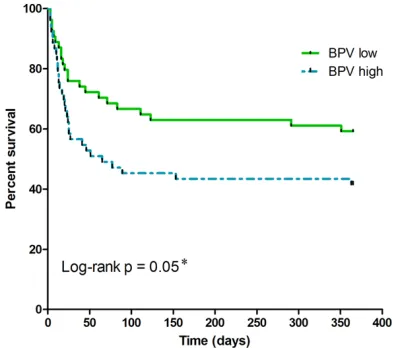
Three survivors in BPV high group and two in BPV low group were lost to follow-up. The disparity in mortality between the BPV high and low groups narrowed over time, but the clinical significance was maintained (Figure 3).
Discussion
of small vessels due to fluctuations in BP is a more likely cause of altered cerebral microcir-culation, which is a critical pathological feature of cerebral dysfunction during sepsis. In this study, we identified a significant correlation be- tween BPV and delirium in patients with sepsis.
A plurality of large sample surveys have shown that increased BPV is positively associated with cardiovascular events and death [14-16]. A re-cent meta-analysis [17] of 77, 299 patients supported the relationship between BPV and mortality. After adjusting for age and mean BP, the relative risk of all-cause mortality and car-diovascular event-related mortality associated with BPV was 1.03 (95% CI, 1.02-1.04; P < 0.001) and 1.10 (95% CI, 1.02-1.17; P < 0.001). In a small survey [18] conducted in patients
with sepsis, a significant correlation was found between BPV and APACHE II score (r = 0.732, P
< 0.001), making it a potential risk factor for predicting the survival rate of patients with sep-sis. In our study, BPV was identified as an inde-pendent predictor of mortality in patients with sepsis.
Mean BP was not found to be related to deliri-um or death in our study. Similarly, mortality did not differ significantly among patients with sep-tic shock who were treated to reach target MAPs of 80 mmHg or 65 mmHg [19]. When the MAP is in a reasonable range (i.e. greater than 65 mmHg), patients with sepsis seem to be more sensitive to BPV rather than mean BP. We found that 24-h BPV was associated with clini-cal signs of SAE and death in patients with sep-sis, independent of mean BP. Therefore, clini-cians should focus on stabilizing BP in the man-agement of patients with sepsis.
The vasoactive drugs that are frequently admin-istered to sepsis patients, not only cause fluc-tuations in BP, but are also related to increased mortality. Vasopressor therapy indicates the development of septic shock, which is associ-ated with extremely high mortality (mean mor-tality, 46.5% [95% CI, 42.7%-50.3%], with a variation from 23.0% to 81.8%) [20]. Therefore, the use of vasoactive drugs is an important confounder in inv estigations of the correlation between BPV and mortality in patients with sepsis. Multivariate logistic regression reveal- ed that BPV was an independent predictor of delirium and death in sepsis patients after adjusting for vasoactive drug use and other confounders.
[image:5.612.91.524.84.197.2]Our study has some limitations. First, the study was not blinded: the researcher who adminis-tered the CAM-ICU test was aware of the BP
Table 4. Outcomes in the high and low blood pressure variability groups
Total n = 112 8.94 mmHg) n = 56BPV low group (≤ 8.94 mmHg) n = 56BPV high group (> P value
Mechanical ventilation free ICU stay (day) 1 (0, 5) 2 (0, 7.5) 1 (0, 3.75) 0.071
CRRT 20 (17.9%) 8 (14.3%) 12 (21.4%) 0.324
ICU stay (day) 12 (5, 23.75) 10 (5, 28.75) 12 (6, 21.5) 0.998
Hospital stay (day) 18 (11, 37.75) 18.5 (11, 47.25) 17 (10.25, 30.5) 0.270
Death (28 day) 36 (32.1%) 13 (23.2%) 23 (41.1%) 0.043
Death (180 day) 50 (46.7%) n = 107 20 (37.0%) n = 54 30 (56.6%) n = 53 0.043
Death (a year) 53 (49.5%) n = 107 22 (40.7%) n = 54 31 (58.5%) n = 53 0.066
BPV: blood pressure variability; CRRT: continuous renal replacement therapy.
Figure 3. Survival curves of the high and low blood pressure variability groups. The Kaplan-Meier analy-sis of the probability of death at a year for patients
with BPV high and low; BPV low group (BPV ≤ 8.94
[image:5.612.90.288.230.404.2]level of the patient. Nevertheless, since BPV was calculated subsequently by a statistician, it is unlikely that knowledge of the patient’s BP could affect the judgment of the researcher. Second, although invasive arterial pressure monitoring was performed for some of the pa- tients, non-invasive BP data was used in this study. Non-invasive blood pressure monitoring has been shown to be as effective in detecting BP fluctuations as invasive blood pressure monitoring in clinical practice [21]; therefore, it can be assumed that this method has little influence on our results. Third, we only assess- ed the clinical symptoms associated with SAE, without any neuroradiological or neurophysio-logical results (e.g., electroencephalograms or magnetic resonance imaging). Furthermore, patients included in present study were diag-nosed as sepsis, severe sepsis and septic sh- ock, that has been revised by the third interna-tional definitions for sepsis and septic shock which were published after wise [22]. However, we believe that patients diagnosed with “old” sepsis went through the similar pathophysio-logical process and were still representative to a certain degree.
The results of our study show that BPV is cor-related with the clinical signs of SAE, probably by altering cerebral microcirculation in the early stage of sepsis. A cut-off value of BPV > 8.94 mmHg could be used in clinical practice to pre-dict the risk of delirium in patients with sepsis. Increased BPV is also independently associat-ed with increasassociat-ed mortality. Further studies are warranted to confirm the results of our study and evaluate the value of monitoring BPV in the clinical management of sepsis patients.
Acknowledgements
This work was supported by the National Na- tural Science Foundation of China (No. 8170 1880).
Disclosure of conflict of interest
None.
Address correspondence to: Zhichao Xie, West China Second University Hospital, Sichuan Univer- sity, No. 20, Section 3, South Renmin Road, Chengdu 610041, China. Tel: +86 28 8550 1513; Fax: +86 28 8550 1513; E-mail: [email protected]
References
[1] Theodore JI, Wesley E, Dylan MS and Kenneth ML. Long-term cognitive impairment and func-tional disability among survivors of severe sep-sis. JAMA 2010; 304: 1787-1794.
[2] Eidelman LA, Putterman D, Putterman C and Sprung CL. The spectrum of septic
encepha-lopathy. Definitions, etiologies, and mortali -ties. JAMA 1996; 275: 470-473.
[3] Gofton TE and Young GB. Sepsis-associated encephalopathy. Nat Rev Neurol 2012; 8: 557-566.
[4] Tzeng YC and Ainslie PN. Blood pressure regu-lation IX: cerebral autoreguregu-lation under blood pressure challenges. Eur J Appl Physiol 2014; 114: 545-559.
[5] Taccone FS, Castanares ZD, Peres BD, Vincent
JL, Berre’ J and Melot C. Cerebral autoregula
-tion is influenced by carbon dioxide levels in
patients with septic shock. Neurocrit Care 2010; 12: 35-42.
[6] Bone RC, Balk RA, Cerra FB, Dellinger RP, Fein AM, Knaus WA, Schein RM and Sibbald WJ.
Definitions for sepsis and organ failure and
guidelines for the use of innovative therapies in sepsis. The ACCP/SCCM consensus confer-ence committee. American college of chest physicians/society of critical care medicine. Chest 1992; 101: 1644-1655.
[7] Barr J, Fraser GL, Puntillo K, Ely EW, Gélinas C, Dasta JF, Davidson JE, Devlin JW, Kress JP, Joffe AM, Coursin DB, Herr DL, Tung A, Robinson BR, Fontaine DK, Ramsay MA, Riker RR, Sessler CN, Pun B, Skrobik Y, Jaeschke R. American college of critical care medicine. Clinical practice guidelines for the manage-ment of pain, agitation, and delirium in adult patients in the intensive care unit. Crit Care Med 2013; 41: 263-306.
[8] Rothwell PM. Limitations of the usual blood-pressure hypothesis and importance of vari-ability, instvari-ability, and episodic hypertension. Lancet 2010; 375: 938-948.
[9] Frattola A, Parati G, Cuspidi C, Albini F and Mancia G. Prognostic value of 24-hour blood pressure variability. J Hypertens 1993; 11: 1133-1137.
[10] Mancia G, Parati G, Hennig M, Flatau B, Omboni S, Glavina F, Costa B, Scherz R, Bond G, Zanchetti A; ELSA Investigators. Relation be-tween blood pressure variability and carotid artery damage in hypertension: baseline data from the european lacidipine study on athero-sclerosis (ELSA). J Hypertens 2001; 19: 1981-1989.
target-organ damage in hypertension. J Hyper- tens 1987; 5: 93-98.
[12] Tatasciore A, Renda G, Zimarino M, Soccio M, Bilo G, Parati G, Schillaci G and De Caterina R. Awake systolic blood pressure variability corre-lates with target-organ damage in hyperten-sive subjects. Hypertension 2007; 50: 325-332.
[13] Burkhart CS, Siegemund M and Steiner LA. Cerebral perfusion in sepsis. Crit Care 2010; 14: 215.
[14] Kikuya M, Hozawa A, Ohokubo T, Tsuji I, Michimata M, Matsubara M, Ota M, Nagai K, Araki T, Satoh H, Ito S, Hisamichi S and Imai Y.
Prognostic significance of blood pressure and
heart rate variabilities: the ohasama study. Hypertension 2000; 36: 901-906.
[15] Hansen TW, Jeppesen J, Rasmussen S, Ibsen H and Torp-Pedersen C. Ambulatory blood pressure and mortality: a population-based study. Hypertension 2005; 45: 499-504. [16] Kikuya M, Ohkubo T, Asayama K, Metoki H,
Obara T, Saito S, Hashimoto J, Totsune K, Hoshi H, Satoh H and Imai Y. Ambulatory blood pressure and 10-year risk of cardiovascular and noncardiovascular mortality: the ohasama study. Hypertension 2005; 45: 240-245. [17] Tai C, Sun Y, Dai N, Xu D, Chen W, Wang J,
Protogerou A, van Sloten TT, Blacher J, Safar
ME, Zhang Y and Xu Y. Prognostic significance
of visit-to-visit systolic blood pressure variabili-ty: a meta-analysis of 77,299 patients. J Clin Hypertens (Greenwich) 2015; 17: 107-115. [18] Pandey NR, Bian YY and Shou ST. Significance
of blood pressure variability in patients with sepsis. World J Emerg Med 2014; 5: 42-47.
[19] Asfar P, Meziani F, Hamel JF, Grelon F, Megarbane B, Anguel N, Mira JP, Dequin PF, Gergaud S, Weiss N, Legay F, Le Tulzo Y, Conrad M, Robert R, Gonzalez F, Guitton C, Tamion F, Tonnelier JM, Guezennec P, Van Der Linden T, Vieillard-Baron A, Mariotte E, Pradel G, Lesieur O, Ricard JD, Hervé F, du Cheyron D, Guerin C, Mercat A, Teboul JL, Radermacher P; SE- PSISPAM Investigators. High versus low blood-pressure target in patients with septic shock. N Engl J Med 2014; 370: 1583-1593.
[20] Shankar HM, Phillips GS, Levy ML, Seymour CW, Liu VX, Deutschman CS, Angus DC, Ru-
benfeld GD, Singer M; Sepsis Definitions Task Force. Developing a new definition and assess -ing new clinical criteria for septic shock: for the
third international consensus definitions for
sepsis and septic shock (Sepsis-3). JAMA 2016; 315: 775-787.
[21] Lakhal K, Macq C, Ehrmann S, Boulain T and Capdevila X. Noninvasive monitoring of blood pressure in the critically ill: reliability according to the cuff site (arm, thigh, or ankle). Crit Care Med 2012; 40: 1207-1213.
[22] Singer M, Deutschman CS, Seymour CW, Shankar-Hari M, Annane D, Bauer M, Bellomo R, Bernard GR, Chiche JD, Coopersmith CM, Hotchkiss RS, Levy MM, Marshall JC, Martin GS, Opal SM, Rubenfeld GD, van der Poll T, Vincent JL and Angus DC. The third
internation-al consensus definitions for sepsis and septic
Table S1. Univariate analysis of patients with and without delirium
Total n = 112 Delirium n = 45 Non-delirium n = 67 P value
Age (year) 57.62 ± 16.31 59.31 ± 16.47 56.48 ± 16.23 0.370
Male 77 (68.8%) 30 (66.7%) 47 (70.1%) 0.697
APACHE II 20.18 ± 6.46 22.29 ± 5.77 18.76 ± 6.55 0.004
SOFA 8.99 ± 4.38 10.69 ± 4.35 7.85 ± 4.05 0.001
Severity 0.007
Sepsis 18 (16.1%) 2 (4.4%) 16 (23.9%)
Severe sepsis 58 (51.8%) 23 (51.1%) 35 (52.2%)
Septic shock 36 (32.1%) 20 (44.4%) 16 (23.9%)
Vasoactive drug usage 43 (38.4%) 20 (44.4%) 23 (34.3%) 0.280
Mean BP (mmhg) 85.85 ± 8.83 86.79 ± 8.33 85.22 ± 9.16 0.358
BPV (mmhg) 9.14 ± 3.49 10.14 ± 3.68 8.46 ± 3.22 0.012
CRP (mg/L) 148.00 (90.30, 203.00) 148.00 (84.50, 204.50) 150.00 (92.00, 204.00) 0.574 IL-6 (pg/mL) 259.00 (92.14, 865.80) 221.25 (84.59, 904.28) 275.80 (110.60, 519.80) 0.844 PCT (ng/mL) 5.35 (1.07, 27.92) 5.12 (1.04, 27.60) 7.02 (1.27, 28.57) 0.423
GCS 9.43 ± 4.08 8.07 ± 3.61 10.34 ± 4.14 0.003
Death (28 day) 36 (32.1%) 22 (48.9%) 14 (20.9%) 0.002
BPV: blood pressure variability; CRP: C-reactive protein; IL-6: Interleukin 6; PCT: Procalcitonin; GCS: Glasgow Coma Score.
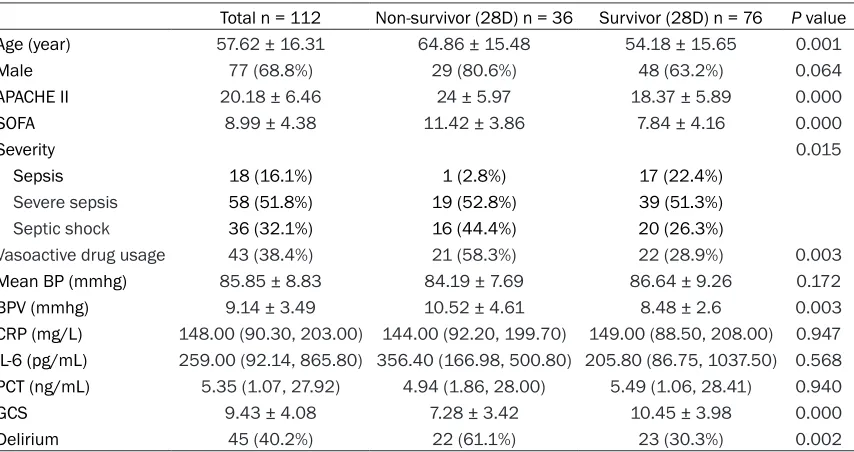
Table S2. Univariate analysis of survival and non-survival patients
Total n = 112 Non-survivor (28D) n = 36 Survivor (28D) n = 76 P value
Age (year) 57.62 ± 16.31 64.86 ± 15.48 54.18 ± 15.65 0.001
Male 77 (68.8%) 29 (80.6%) 48 (63.2%) 0.064
APACHE II 20.18 ± 6.46 24 ± 5.97 18.37 ± 5.89 0.000
SOFA 8.99 ± 4.38 11.42 ± 3.86 7.84 ± 4.16 0.000
Severity 0.015
Sepsis 18 (16.1%) 1 (2.8%) 17 (22.4%)
Severe sepsis 58 (51.8%) 19 (52.8%) 39 (51.3%)
Septic shock 36 (32.1%) 16 (44.4%) 20 (26.3%)
Vasoactive drug usage 43 (38.4%) 21 (58.3%) 22 (28.9%) 0.003
Mean BP (mmhg) 85.85 ± 8.83 84.19 ± 7.69 86.64 ± 9.26 0.172
BPV (mmhg) 9.14 ± 3.49 10.52 ± 4.61 8.48 ± 2.6 0.003
CRP (mg/L) 148.00 (90.30, 203.00) 144.00 (92.20, 199.70) 149.00 (88.50, 208.00) 0.947 IL-6 (pg/mL) 259.00 (92.14, 865.80) 356.40 (166.98, 500.80) 205.80 (86.75, 1037.50) 0.568 PCT (ng/mL) 5.35 (1.07, 27.92) 4.94 (1.86, 28.00) 5.49 (1.06, 28.41) 0.940
GCS 9.43 ± 4.08 7.28 ± 3.42 10.45 ± 3.98 0.000
Delirium 45 (40.2%) 22 (61.1%) 23 (30.3%) 0.002
[image:8.612.95.522.352.578.2]