Abstract—IP core mapping for Network-on-Chip (NoC) at system level significantly impacts the communication energy consumption of the system. Optimization of IP mapping can lead to significant energy savings. In this paper, a new mapping algorithm named GA-MMAS is proposed based on Genetic Algorithm (GA) and MAX-MIN Ant System Algorithm (MMAS), to optimize energy consumption for NoC. Firstly in this algorithm, we improve MMAS. We obtain the elicitation information via priority mapping of IP core with larger communication volume, instead of using heuristics, to improve the optimal solution of MMAS. Then with the combination of MMAS and GA, the advantage of speed in GA makes compensation to the lack of pheromone in the early stage of MMAS, and in turn enhancing the accuracy of optimal solution, which leads to lower energy consumption. The experiments performed on various random benchmarks and a complex video/audio application to conform the efficiency of the algorithm. Experimental results show that the algorithm saves about 36%-60% of energy consumption compared to random mapping, and saves about 3%-25%, 10%-30% and 3%-30% compared to algorithm GA, Ant Colony Algorithm (ACA) and MMAS respectively.
Index Terms — energy consumption, hybrid algorithm, mapping, NoC
I. INTRODUCTION
ETWORK-on-Chip (NoC) mapping is a very important step in NoC design. The result of mapping has a significant impact on execution time, communication delay and communication energy consumption of the system[1].
NoC mapping is essentially a quadratic assignment problem which belongs to NP-complete problem. It is difficult to find an algorithm in reasonable time for an optimal result. In [2, 3, 4], Genetic Algorithm (GA) is applied to optimize execution time or communication energy consumption. However GA will make some useless iteration in later period because of the underutilization of the feedback information. Ant Colony Algorithm (ACA) in [5] and
Manuscript received July 15, 2011; revised August 10, 2011. This work was supported in part by the National Natural Science Foundation of China (61076019), Jiangsu province scientific support plan (BE2010003) and China Postdoctoral Science Foundation (20100481134).
Ning Wu is with the College of Electrical and Information Engineering, Nanjing University of Aeronautics and Astronautics (NUAA), Nanjing 210016, China (e-mail: [email protected]).
Yifeng Mu is with the College of Electrical and Information Engineering, NUAA, Nanjing 210016, China (e-mail: [email protected]).
Fang Zhou is with the College of Electrical and Information Engineering, NUAA, Nanjing 210016, China (e-mail: [email protected]).
Fen Ge is with the College of Electrical and Information Engineering, NUAA, Nanjing 210016, China (e-mail: [email protected]).
MAX-MIN Ant System Algorithm (MMAS) in [6] are applied to optimize the energy consumption for IP mapping. However ACA or MMAS will find the solution very slowly because of the lack of initial pheromone.
In this paper, an algorithm named GA-MMAS is proposed for the problem of low energy consumption IP mapping based on researching on GA and MMAS. GA-MMAS firstly improves MMAS. Then it combines MMAS with GA to make compensation to their disadvantages by their advantages. Several experiments are carried out to verify the efficiency of the algorithm.
The rest of the paper is organized as follows: Section II describes the problem of IP core mapping; Section III illustrates the improved MMAS. Section IV illustrates our algorithm; Section V presents the experimental results; and finally, Section VI concludes the paper and outlines some directions for future work.
II. PROBLEM DESCRIPTIONS
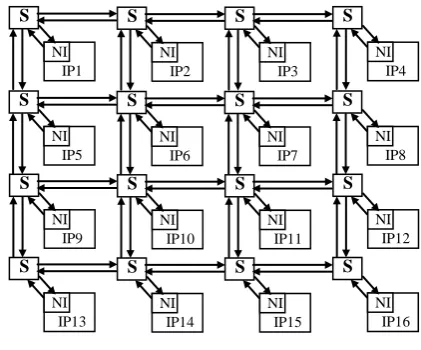
The problem of energy-aware mapping for NoC defines as follow: given the IP communication graph and NoC topology architecture, the designer decides which tile each IP should be placed to minimize the communication energy of system. In this paper, we focus on 2D mesh network and use static XY routing for data transmission. Fig.1 shows 2D mesh network architecture.
Each switch connects four resource nodes and each resource node places one IP core.
And we use the energy model presented in [7] by Hu et al:
,
( 1)
i j
bit switch Sbit switch Lbit
E =n ×E + n − ×E (1)
GA-MMAS: an Energy-aware Mapping
Algorithm for 2D Network-on-Chip
Ning Wu, Yifeng Mu, Fang Zhou, and Fen Ge
N
S
NI IP1
S
NI IP2
S
NI IP3
S
NI IP4
S
NI IP5
S
NI IP6
S
NI IP7
S
NI IP8
S
NI IP9
S
NI IP10
S
NI IP11
S
NI IP12
S
NI IP13
S
NI IP14
S
NI IP15
S
[image:1.595.321.532.521.696.2]NI IP16
whereEbiti j, represents the energy consumed by one bit of data transported from tile i to tile j, ESbit the energy consumed by
one bit of data transported a switch, ELbit the energy consumed
by one bit of data on the link between two switch and nswitch the
number of switch one bit of data encounters when it is transported from tile i to tile j. Note that, for the 2D mesh network with XY routing, Eq.(1) shows that the average energy consumption of sending one bit of data from tile i to tile j is determined by the Manhattan distance between these two tiles.
To formulate the IP mapping problem in a more formal way, we need to introduce the following concepts:
Definition 1: An IP communication Characterization Graph (APCG) Ω=G(C,A) is a directed graph, where each vertex ci represents one IP, and each directed arc ai,j represents the communication from ci to cj. The following quantities are associated with each ai,j as arc properties:
v(ai,j): arc volume from vertex ci to cj, which stands for the communication volume from ci to cj.
b(ai,j): arc bandwidth requirement from vertex ci to cj, which stands for the minimum bandwidth that should be allocated by the communication network.
Definition 2: An Architecture Characterization Graph(ARCG) Π = G(T,P) is a directed graph, where each vertex ti represents one tile in the architecture, and each directed arc pi,j represents the routing path from ti to tj. The following quantities are associated with each pi,j as arc properties:
e(pi,j): arc cost from vertex from ti to tj, which represents the average energy consumption of sending one bit of data from ti to tj.
L(pi,j): the set of links that make up the path pi,j.
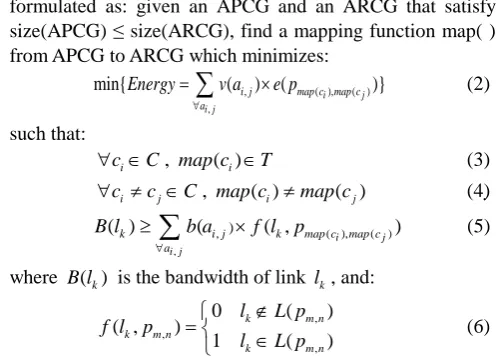
Using the above graph representations, the problem of minimizing the communication energy consumption can be formulated as: given an APCG and an ARCG that satisfy size(APCG) ≤ size(ARCG), find a mapping function map( ) from APCG to ARCG which minimizes:
,
, ( ), ( )
min{ ( ) ( i j )}
i j
i j map c map c a
Energy v a e p
∀
=
∑
× (2)such that: i
c C
∀ ∈ , map c( )i ∈T (3)
i j
c c C
∀ ≠ ∈ , map c( )i ≠map c( )j (4)
,
, ) ( ), ( )
( ) ( ( , i j )
i j
k i j k map c map c a
B l b a f l p
∀
≥
∑
× (5)where B l( )k is the bandwidth of link lk, and:
, ,
,
0 ( )
( , )
1 ( )
k m n
k m n
k m n
l L p
f l p
l L p
∉
= ∈
(6)
Conditions (3) and (4) mean that each IP should be mapped to one tile exactly and no tile can host more than one IP. Equation (5) guarantees that the load of any link will not exceed its bandwidth.
III. IMPROVED MMAS
In MMAS, the elicitation information is obtained by using heuristics (η). And the heuristics is calculated by (7).
,
i i j
j f
d
η = (7)
where fi stands for the total communication volume between
ith IP core and others, di the total distance between ith IP and
others. The heuristics shows the IP core with larger communication volume should be placed to the center of NoC architecture. But when we construct the solution for mapping problem, we map the IP core one by one. So the fi is a fixed
value, and η would indicate that each IP core should be mapped to the centre. Hence, the convergence rate of the algorithm gets slower, even we could find the best solution.
Consequently we obtain the elicitation information via priority mapping of IP core with larger communication volume instead of using heuristics.
IV. GA-MMASALGORITHM
The basic idea of GA-MMAS Algorithm is that: in the beginning, it uses such kind of GA, which reserves the best ones, with the advantage of speediness and randomness. Then it initializes the pheromone for MMAS using the results of GA. Finally, it uses improved MMAS because of its precision and forward feedback to get the final results.
A. GA in GA-MMAS
We first use GA to get some better results. The key steps of our GA are as follows:
1) Generate a random population of valid solutions. Here each individual member of the population is a chromosome, which represents a concrete design plan of vertex mapping on IPs. A chromosome is constructed as follows:
(a) Every chromosome is a series of genes.
(b) Every gene represents an IP core. Its concrete value is the vertex number in ARCG. Every chromosome, consisting of genes, should satisfy (5). Fig.2 shows one chromosome.
The lenth of the chromosome is 9, so there are 9 IP cores in APCG. The 0th number ‘5’ represents the 0th IP core is mapped to vertex 5.
The number of individuals in one generation is 100. 2) Calculate the fitness function of every member as the reciprocal of its system communication energy.
, ( ), ( )
,
1
( i j) map c map c
i j
ai j fitness
v a e
∀
=
×
∑
(8)3) Generate a better population from the old population. We use improved order-crossover method and mutation method to generate the next new population and ensure that the best individual of current population is saved for the next new population. Fig.3 shows the improved order-crossover method.
A and B are two old chromosomes and A* and B* are two new ones.
The probability of crossover is 0.95 and the one of mutation is 0.05.
[image:2.595.42.291.478.657.2]5 1 3 4 0 2 8 7 6
4) GA stops when the number of generation reaches at 1000.
B. initializing the pheromone
We chose the best x×y/2 individual members in the population of last generation to form matrix T1. And form another matrix T2 by individual members generated randomly. Then form matrix P using T1 and T2 [8].
Assume that pi,jin the matrix P represents the mapping
times of ith IP to jth node. So the element τi,j of pheromone matrix τ, which represents the pheromone of ith IP mapping to jth node, is pi,j /(x×y). For example, assume the architecture of
NoC is 2D mesh of 2×2.The best two individuals in the last generation of GA are 2013 and 2031. 1302 and 1230 are generated randomly, so 1 2 0 1 3
2 0 3 1
T =
and
1 3 0 2 2
1 2 3 0
T =
.
Then we can get P and τ, that is: 2 0 1 3
2 0 3 1 1 3 0 2 1 2 3 0 P
=
,
0 0.5 0.5 0 0.5 0 0.25 0.25 0.25 0.25 0 0.5 0.25 0.25 0.25 0.25 τ
=
.
C. MMAS in GA-MMAS
Finally, we use MMAS to get the final results
In our MMAS, each ant in the ant system has a path-table which represents a concrete design plan of vertex mapping on IPs. The location of path-table represents the number of IP and the value is vertex number in ARCG. Each ant also has a state-table which notes the unmapped nodes. The number of ants is the number of IP cores.
The key steps of our MMAS are as follows:
1) Calculate the total communication volume of each IP from or to other IPs.
2) Assume Q is a queue which is made of IPs order by total communication volume of IP.
3) Pick the IP orderly from Q and map to a node according to the rules as follows.
Assume q is a random number between 0 and 1, q0 a constant between 0 and 1. If q < q0,the mapping node is given by (9)
arg maxs allowedk( is)
j= ∈ τα (9)
where α, a parameter, determines the relative importance of pheromone which is set to 0.8 and allowedk is the state-table of Ant k.
Otherwise if q ≥ q0, assume r is a random between 0 and 1. Then compute the probability given by (10) with which ith IP is mapped to jth node and accumulate the probability to s until s>r. Then the corresponding node is the mapping node.
,
( ( )) ( ( )) ( )
0 ij k
ir i j
r allowed t
j allowed t
p t
j allowed α
α τ
τ
∈
∈
=
∉
∑
(10)4) Put the node into path-table and delete it from the state-table when the node is selected for an IP core.
5) Do step (3) and (4) until all IPs are mapped. Then one mapping result is gotten.
6) Do step (3), (4) and (5) for all ants to complete one cycle and each ant is one result.
7) Calculate the fitness function of every ant using (8). Then use 2-Opt method for local search for the best ant.
8) Update pheromone just for the best ant when one cycle completes using (11) where ρ is a pheromone decay parameter which is set to 0.8 and (12) where fitness(best solution) is the fitness of the best ant.
, ( 1) , ( )
i j t i j t
τ + = ×ρ τ + ∆τ (11)
( )
fitness bestsolution τ
∆ = (12)
To avoid search stagnation, the pheromone is increased proportionally to the difference between τmin and τmax given by
(13) and (14). max
1
( )
1 fitness bestsolution
τ
ρ =
− (13)
min max
1 5
τ = τ (14) 9) MMAS stops when the number of cycle reaches at 1000. The best result is the best one in last cycle.
V. EXPERIMENTAL RESULTS
We have carried out various experiments to verify the efficiency of our algorithm. We use GA, ACA and MMAS for comparison. All of the algorithms are complied by C++ and run on Windows XP in a computer with Intel P IV 3.4 GHz CPU and 1 GB memory.
[image:3.595.337.518.51.102.2](1) Random benchmark experiments
Table I shows the detail of the experiments. All tasks are generated by TGFF [9].
TABLEI EXPERIMENTS DETAIL
Task-No IP-No directed arc-No
Total volume of
communication NoC Size
1 10 12 1634 4 × 3
2 12 12 3466 4 × 3
3 16 33 609257 4 × 4
4 20 24 2640 5 × 4
5 20 24 2640 5 × 5
6 20 37 4176 5 × 4
7 20 37 4176 5 × 5
8 25 33 684271 5 × 5
9 40 72 80951 7 × 6
10 48 95 98840 7 × 7
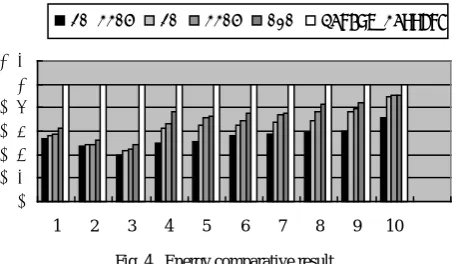
Fig.4 shows the communication energy comparative result standard on random mapping.
Experimental results show that the communication energy consumption is saved when we use those kinds of algorithm for different tasks. However GA-MMAS saves the most. The algorithm can save about 60% of energy consumption at best and 45% on average compared to random mapping.
5 1 3 4 0 2 8 7 6
A
0 1 2 3 4 5 6 7 8
B
5 6 7 8 1 3 4 0 2
A*
2 8 7 6 0 1 3 4 5
[image:3.595.61.282.55.159.2]B*
[image:3.595.304.549.555.683.2]Compared to GA, the algorithm can save about 25% of energy consumption at best and 20% on average. Compared to ACA, the algorithm can save about 30% of energy consumption at best and 20% on average. And compared to MMAS, the algorithm can save about 30% of energy consumption at best and 20% on average.
Table II shows the compute time comparative result.
TABLEII TIME COMPARATIVE RESULT
Task-No GA ACA MMAS GA-MMAS
1 1.8s 1.8s 8.5s 10s
2 2s 2s 9s 11s
3 3s 5.5s 10s 12s
4 3s 5s 13s 14s
5 5s 7s 20s 21s
6 7s 10s 25s 27s
7 6s 8s 21s 23s
8 7s 12s 30s 31s
9 18s 72s 198s 168s
10 24s 132s 368s 321s
Experimental results show that the computing time of GA-MMAS algorithm is more than the one of GA and ACA, but is similar to the one of MMAS. With the number of IP increasing, the compute time of GA-MMAS is growing much more. Then we carried out one experiment with a task of 96 IPs. The time is about 20 minutes and we could accept.
(2) Application
In this paper, we carried one experiment for a multi-media system (MMS) which is consisted by H.263 video encoder/decoder and MP3 audio encoder/decoder. The multi-media system can be divided into 25 IP cores. Fig.5 shows the communication volume between the IP cores.
In 0.18μm technology, assuming that the link length of 2mm, the total line capacitance 0.5fF/μm and voltage swing is 3.3v, ELbit is 5.445pJ and ESbit is 0.43pJ [10]. Based on the
above parameters, energy consumption is calculated by GA-MMAS and other algorithms respectively as showed in table III.
TABLEIII
ENERGY COMPARATIVE RESULT FOR MMS
Algorithm Energy consumption(μJ) ratio
GA-MMAS 35.32 1
Random mapping 59.58 1.69
GA 40.98 1.15
ACA 49.55 1.39
MMAS 45.69 1.29
In this experiment, the computing time of GA-MMAS is 40s and GA-MMAS can save about 41%, 14%, 29% and 23% compared to random mapping, GA, ACA and MMAS respectively.
VI. CONCLUSIONS AND FUTURE WORK
In this paper, we have presented a GA-MMAS algorithm aiming at the problem of low energy IP mapping for Network-on-Chip with the 2D mesh architecture. This algorithm use GA to initialize the pheromone for MMAS, making compensation to the lack of pheromone in the early stage of MMAS. And the heuristics is not used in the computation of probability. Instead of it, a new method is used for better results in which the IP core with lager communication volume is mapped firstly. Several experiments are carried out to verify the efficiency of the algorithm. Experimental results show that the algorithm saves about 36%-60% of energy consumption compared to random mapping, and saves about 3%-25%, 10%-30% and 3%-30% compared to GA, ACA and MMAS, respectively.
We plan to advance this research in several directions: such as the mapping of multi-objective optimization.
REFERENCES
[1] OGRAS U Y, HU Jingcao and MARCHLESCU R. “Key research problems in NoC design: a holistic perspective,” in Proc. 3rd IEEE Int. Conf. Hardware/Software Codesign and System Synthesis, Jersey City, 2005,pp. 69–74.
[2] T. Lei and S. Kumar, “A Two-step Genetic Algorithm for Mapping Task Graphs to Network on Chip Architecture,” in Proc. 3rd Euromicro Symposium.Digital System Design, Turkey, Sept. 2003, pp. 180–187.
[3] Zhou W B, Zhang Y and Mao Z G. “An application specific NoC mapping for optimized delay,” in Proc. IEEE Int. Conf. DTIS,2006, pp. 184–188
[4] Gen fen and Wu ning. “Co-Mapping Algorithm for Network on Chip with Optimal Power Consumption,” Journal of Applied Sciences, vol. 26, no. 6, 2008, pp.606–216.
[5] Yanhua Liu, Ying Ruan, Zongsheng Lai and Weiping Jing, “Energy and Thermal Aware Mapping for Mesh-based NoC Architectures Using Multi-objective Ant Colony Algorithm,” in Proc. 3rd International Conf. Computer Research and Development, 2011, pp.407–411
[6] Ganmin Zhou, Yongsheng Yin, Yonghua Hu and Minglun Gao. “NoC mapping based on ant colony optimization algorithm,” Journal of Computer Engineering and Applications, no. 18, pp. 7–10, 2005 [7] HU Jingcao, MARCHLESCU R. “Energy-aware mapping for
tile-based NoC architectures under performance constraints,” in Proc. Asia South Pacific Conf. Design Automation, Kitakyushu, 2003, pp. 233–239.
0 0.2 0.4 0.6 0.8 1 1.2
1 2 3 4 5 6 7 8 9 10
[image:4.595.49.278.131.263.2]GA-MMAS GA MMAS ACA Random Mapping
Fig. 4. Energy comparative result
1
5 3
6 2
9
116873 H.263 coder
4
7 8
12
10 11 13
14
15
16
17
18
19
21
20
25
24 23
22 38016
33848 197
75205 38016 16691
16691 33848
33848 764
640 640
25 80 28248
26924 7061 7061
38016 75584 3672 3672
144
3672 3672
641
28265 80 25 38016
7065 7065
H.263 decoder
[image:4.595.57.279.590.750.2]MP3 coder MP3 decorder
[8] Wu Jiao-feng. “Research on improved performance of Ant Colony Algorithm by Genetic Algorithm,” MA.Eng. dissertation, Taiyuan University of Technology, 2007
[9] Dick R P, Rhodes D L and Wolf W. “TGFF: task graphs for free,” in
Proc. 6th International Workshop on Hardware/Software Codesign, Seattle, Wahsington, 1998, pp. 97–101.