Video vs. text: Assessing the effectiveness of a video tutorial on the
procedural-‐ and factual knowledge of production workers and its potential
benefits over a tutorial with text and still graphics.
A Quasi-‐Experimental Study Conducted at a Global Manufacturing Company
Master Thesis
Nick Scheurwater
Acknowledgement
This master thesis accounts for the completion of the master programme of Educational Science and Technology, with the focus on Human Resource Development, at the University of Twente. I conducted this study in combination with an internship at Apollo Vredestein, a global tyre manufacturer based in Enschede. First of all, I would like to express my gratitude to all the production workers and production coordinators that participated in this study. Although you had to deal with a daily production quota and the corresponding workload, you still managed to facilitate several tests, which stand as a basis for my research. Furthermore, my special appreciation goes out the department of education at Apollo Vredestein (George Sanders, Herman Steunenberg and Hylle de Beer) and specifically to Klaas Woudstra. Klaas was a constant, positive and valued contact who guided me and my study through the entire organization and helped me encounter several obstacles in gathering the data I needed in reaching a successful ending. There were some real struggles in getting the involvement of a sufficient amount of participants, however with our combined creativity and effort we managed to create the support we needed to bring this study to the finish line. Additionally, I would like to say thank you to my supervisor Bas Kolloffel who guided me through the study and was always there to provide me with the critical feedback I needed to maintain the quality. Finally, thank you to my second supervisor Hans van der Meij, for taking the time to critically review my study and provide me with the feedback I needed to improve where needed.
Nick Scheurwater February, 2017
Abstract
The aim of this study was to provide and add clarity on the topic of the effectiveness and efficiency of video as a learning tool and media for training employees. Specifically, if video as a learning tool is more effective and efficient than using text and still graphics (PDF), for production workers in becoming acquainted with an online system within a global manufacturing company. A sample group of 190 production workers were part of a quasi-‐experimental design in which they followed a pre-‐test, intervention and post-‐test process.
Additionally, from the sample group 57 participants conducted a third and final test to measure the retention rate of the participants. The sample group was divided into two conditions. One hundred participants were trained on an online software program via a video tutorial and ninety participants were trained on the same topic however through a PDF tutorial containing the same theory.
Results revealed that within this context, video proved itself as an effective learning tool for the participants to significantly improve themselves in factual-‐ and procedural knowledge about interpreting and using an online system called QMS. However, multiple data analysis failed to provide evidence that benefits video as a learning tool over PDF. Furthermore, the data revealed no significant difference between groups on the mean post-‐test results, procedural knowledge, factual knowledge, learning gains and retention rate. On the contrary, there was a significant difference found on the training time between groups in favor of the PDF condition. Meaning that the PDF –group needed significantly less time to follow the training and finish the test than the video-‐group, producing similar results.
Key words: Video learning, Procedural knowledge, Factual knowledge, Production workers
Table of Contents
Acknowledgement ... 2
Abstract ... 3
Introduction ... 5
Effects of video learning on learning outcomes. ... 6
Cognitive processes in learning. ... 8
Cognitive advantages pinpointed by theory of video-‐ and paper-‐based tutorials . ... 9
Defining factual and procedural knowledge. ... 10
Production workers and their view on learning. ... 11
Method ... 13
Research design ... 13
Participants ... 14
Materials ... 15
Pre-‐test, Post-‐test and retention-‐test. ... 15
Video. ... 17
Text including still graphics (PDF). ... 19
Procedure ... 20
Data analysis ... 22
Results. ... 23
Correlations. ... 24
Hypotheses testing. ... 24
Retention rate. ... 26
Discussion & Conclusion ... 28
Reference: ... 34
Introduction
Organizations providing employees sufficient knowledge needed for a successful job performance, contributes to the overall organizational performance of manufacturing firms (Epple, Argote & Murphy, 1990) and provides a basis for competitive advantage in firms (Argote & Ingram, 2000). Although providing employees with sufficient knowledge through training and education stands as a central pillar in many organizations, the effectiveness of these training methods varies considerably (Argote, 1999). Effective training might eventually lead to higher productivity, improved work quality, higher motivation, higher commitment, higher morale and fewer errors leading to a stronger competitive position (Salas et al., 2006). A possible method to train employees and offer them the knowledge that is required is through online and digital tools. Digital learning or E-‐learning is defined as instruction that is delivered on a digital device and is intended to support learning. Digital learning generates more personalisation for students and thus
contributes to deeper learning and provides students with motivation and persistence (VanderArk & Schneider, 2012).
Modern day multimedia offers teachers, coaches, and trainees a wide variety of digital and textual opportunities for knowledge accumulation. However, a question arises concerning what medium is most effective for what situation. Within the field of education and business, organizations use training tools varying from video, written papers to online tools. Looking more closely at these tools, scholars have
presented the effectiveness of (interactive) instructional videos as a tool that benefits the learning process of students worldwide in various disciplines and sectors (Schwan & Ramp, 2004; Zhang et al, 2006). Video in general is seen as a rich and powerful medium that consistently presents information in an attractive way (Zhang, Zhou, Briggs & Nunamaker, 2006), and offers opportunities to distribute information realistically by combining motion with audio, visual and textual information (Wetzel, Radtke & Stern, 1993). Subsequently, students who use video for learning, experience them as a helpful tutoring resource that gives the students control by pausing the video when needed, learning at their own pace and accessing the information in the preferred environment (Bridge, Jackson & Robinson, 2009; Simpson, 2006).
learning through video in comparison with a more traditional tool like learning through text and still graphics (PDF), in a business setting amongst actual production workers. Specifically, production workers being trained on how to find, understand and use a software system they had to work with in daily practise.
Effects of video learning on learning outcomes.
Looking more closely at the ongoing debate of the topic in hand, the question remains on what previous research has found about the effect video learning actually had on the learning outcomes. Examining the diversity of the results of various studies on this topic, it is a question that is not simply answered. First, Lewis (1995) explored the influence video learning has on the impact on students’ grade and attitudes by replacing standard tutor instructions to video instructions. The videos had the identical content as the standard tutor instructions and failed to present itself as an improvement. Furthermore in line with Lewis (1995), Kim, Yoon, Whang, Tversky and Morrison (2007) examined the impact on student learning about bicycle pumps by presenting the theory in still graphics and animation. Data showed that the animation did affect the students’ perception but failed to improve the test scores. Other studies showed similar results by studying graphics vs. animation (Jolly, 2003) and text plus static graphics vs. text plus animated graphics (Morrison and Tversky, 2001).
Examining studies that specifically measured a possible effect of video tutorials on software learning outcomes in educational settings, similar varying results were found. First, multiple studies did not reveal a significant difference between the video-‐ and paper-‐based condition concerning a software drawing program on the Macintosh (Payne, Chesworth & Hill, 1992), an experiment in which participants were instructed on how to find articles in an online system (Mestre,2012), and an empirical study in which participants were instructed on how to use word in a software system and creating table of contents (Alexander, 2013). Based on these researches one might conclude that scholars failed to provide evidence that benefits the likes of video learning over more traditional methods. However, the results are too diverse and complicated making this a bold statement.
the topic to be learned and if they presented an adequate level of realism. Furthermore a statement was made that “the advantage of animations becomes particularly evident under specific combinations of relevant circumstances” (p.6). Meaning that video might be effective if the context optimally addresses and strengthens the learning tool. These findings were in line with several studies that did find a significant difference between video and paper-‐based tutorial. First, van der Meij and van der Meij (2014) found evidence that clearly favored video instruction over paper instruction where the participant had to conduct several software tasks. Secondly, Palmiter and Elkerton (1993) found similar results in a similar context as they stated that participants who viewed the video tutorial completed the training faster and more accurately.
Conclusively, there seems to be a lack of consistency between researchers leading to a ‘generalization problem’ of the topic in hand. Furthermore, it is of critical essence to keep in mind that these studies not just lacked to provide unambiguous results, but also lacked generalizable conditions. Meaning that although video is used as a learning tool in all of these studies, the goals and contexts of the studies differed, varying from learning how to use a bicycle pump to learning a software drawing program. In the remainder of this thesis there will be more focus on the possible effects of disparate learning tools and contrasting contexts.
Looking for reasons that might explain this ‘generalization problem’, Muller (2008) builds upon the statement Hoffler and Leutner (2007) made about specific combinations and relevant circumstances. First, his research focuses on the increased motivation the students demonstrated in experiments while watching videos instead of more traditional methods. Muller (2008) claims that due to the novelty, methodological cofounds, not ensuring socioeconomic statuses and even a Hawthorne effect likely account for most of the success in these articles. Second, and perhaps most important he mentioned that different methods of instructional media could be made equally effective in contrasting contexts. Leading to research results that are impossible to generalize over contrasting learners and contexts. Clark (1983) symbolically illustrated this with the metaphor “Media are mere vehicles that deliver instruction but do not influence student
achievement any more than the truck that delivers our groceries causes changes in our nutrition,”(p.445). This research article will specifically focus on using video learning as a tool for training and measuring its effect on learner outcomes within a production company, versus a traditional paper-‐based training. Aiming to provide evidence that could be of added value for the overarching topic of the effectiveness of learning though multimedia.
Cognitive processes in learning.
Video and other learning methods can be tools to develop trainees’ knowledge and lead to an effective learning process. However, within this learning process there should be multiple variables
considered concerning cognitive processes. These variables are essential to understand in discussing possible explanations for the potential effectiveness and efficiency of video as a learning tool and what competences a learner has which can be addressed by video as a learning tool.
In his article on multimedia learning, Mayer (2001) claims that the learners’ ‘information system’ is responsible for effective multimedia learning. The information system is defined as the learners’ separate channels for visual and verbal processing. This information system requires a coordinated processing system for each channel. Structuring these systems requires an effective training adapted specifically to the
cognitive processes of the trainee (Mayer,2001). Meaning that the training in which the theory is offered should be designed in a way that the learner can coop with the pace and it is presented in an understandable manner according to the cognitive level and competences of the learner. Specifically by selecting relevant words and images, a coherent organization of verbal presentations and pictures, and integrating these with each other and prior knowledge.
Mayer (2001) addresses these cognitive processes by relating them with concrete practical learning applications. A number of these applications can be relevant for the current study on understanding why video might be an effective tool for the learning process. He states that people learn better when the information presented by multimedia is designed consistent with the way the mind works and according to certain ‘research-‐based principles’. According to these research-‐based principles, there are several
guidelines that can be used towards developing successful multimedia learning designs. First, the multimedia principle states that pictures are more effective in the learning process than words alone. Secondly, he claims that people learn more effectively when they can pace the presentation according to their own learning, in other research adopted as ‘cognitive pace’ (Wetzel, Radtke & Stern, 1993). Furthermore, the modality principle states that animation in combination with narration is more effective then animation with on screen text (Mayer, 2001), which is supported by Van der Meij and Van der Meij (2013). Shepard (2003) also highlights the importance of narration as support for visualizations and states that videos can be a genuine reflection of real-‐life situations. Additionally Zhang et al., (2006) state that video provides the student more flexibility in its learning and fosters self-‐directed and self-‐paced learning. Summarizing these findings, one might claim that making videos more effective through narration, student control and adapting content to the cognitive pace of the learner might be beneficial for improving the learning process.
Cognitive advantages pinpointed by theory of video-‐ and paper-‐based tutorials .
Within this study there is a focus on possible differences between the learning effects of a video tutorial and learning through a PDF tutorial. While Clark and Mayer (2001) elaborated comprehensively on the way learning should be adjusted to the students’ cognitive processes, it might be relevant to inquire how video and paper-‐based learning addresses these processes. First, in their study on knowledge development for software tasks, Van der Meij and Van der Meij (2014) compared the effects of a video tutorial versus a paper-‐based tutorial on the learning outcomes of fifth and sixth graders. They stated that a paper-‐based tutorial might be favoured over a video tutorial for procedural knowledge development due to its accessibility, control of pace, active processing and if the paper-‐based tutorial is structured such that provides the user with a clear overview of the contents of the training. Additionally, they state a rather important claim for the current research. It is stated that the speed in which the student processes the information is not dictated by a paper-‐based tutorial but completely by the user who is in control of his own learning pace. This element seems to address the claim of Mayer (2001) that states that learning is most effective when the theory is presented according to the students’ cognitive pace.
Furthermore, van der Meij and van der Meij (2014) state that a paper-‐based tutorial also invites the student into active processing. A paper-‐based tutorial is adapted to the student and his tendency to act and calls upon self-‐explanatory processes. Which might be in line with the study of Clark and Mayer (2012) and addresses the claim in which they emphasize on the importance of active learning as they claim that learners are more likely to understand information when being engaged in relevant cognitive processing.
emphasize on congruity and modelling. Meaning that a video can be displayed through auditory and visual information, which might strengthen each other, and that video displays certain tasks identical as the student experiences in the practical context. Furthermore, they state when students specifically learn about software from video instructions they can easily mimic the observed actions.
Defining factual and procedural knowledge.
Within this research, two types of knowledge were trained and assessed in order to measure possible effects the type of training had on the learning outcomes. Multiple research articles explicitly focused on the effect a video tutorial had on the procedural knowledge of the participants through software tasks (Mestre, 2012; Payne, Chesworth and Hill, 1992), instruction on performing certain acts in practice (Kim et al., 2007) and by using a grading system (Lewis, 1995). However within the current study there was an equal focus on procedural knowledge as factual knowledge due to the fact that the participants need to understand certain concepts in order to perform certain procedures. First, participants were simply required to memorize certain information that was revealed to them in the training. In the remaining article this type of knowledge is referred as ‘factual knowledge’ or ‘declarative knowledge’. Secondly, participants were required to find information in an online system by following a sequence of steps that was demonstrated to them in the training. In the remaining part of the article this type of knowledge is referred as ‘procedural knowledge’.
Factual knowledge or declarative knowledge represents awareness of some object, event or idea (Jonassen, 2000). Procedural knowledge is defined in theory in two steps. First, a procedure is a number of steps that has to be accomplished in reaching a goal and secondly, knowledge of these procedures is defined as procedural knowledge (Rittle-‐Johnson, 2012). Furthermore, the sequential nature of the procedures is what distinct procedural knowledge from other types of knowledge (Hiebert & Lefevre, 1986). There seems to be a general consensus that defines procedural knowledge as the ability to execute action sequences to solve problems (Rittle-‐Johnson, 2012). In recent history, specifically on software users, paper-‐based tutorials have been a dominant tool in procedural knowledge development. However, nowadays video is challenging this dominance due to the overtaking of technical barriers to its production and distribution (van der Meij, Karreman & Steehouder, 2009).
answer in which the answer can only be acquired by executing the correct procedure. For factual knowledge the method is often more straightforward for the student. Factual knowledge can be measured simply by memorization and is often less complex than procedural or conceptual knowledge.
Production workers and their view on learning.
Contrary to a large number of other studies covering the effectiveness of video learning, this study was not situated in an educational context but within a global manufacturing company. Consequently, leading to the assessment of actual workers instead of students. To gain more insight in the perspective of production workers Timma (2007) conducted a qualitative study in which workers, active in a food manufacturing company were interviewed on their perspective about learning. She found that the majority of workers demonstrated an eager interest in pursuing learning opportunities. They do so with the ultimate goals of developing their skills, understanding for the job, personal fulfillment and self-‐improvement. Furthermore, the study revealed that most of the workers prefer on-‐the-‐job assessments instead of written assessments because of its realistic nature. The workers preferred assessment that closely matched the activity of the work and skills training and helped them to understand their work better (Timma, 2007). These findings seem to support the statement of a wide variety of studies (Grossman & Salas, 2000; Mayer, 2001; Shepard, 2003; Wetzel, Radtke & Stern, 1993; Zhang et al., 2006) that emphasize on the importance of realistic training scenarios. However, it might be important to consider that the preferred context of the production workers might influence their perception but the effect on the eventual outcomes remains unknown.
Conclusively, Timma (2007) demonstrated that the workers consciously connected their learning and training with the activities of their job and taking responsibility of their own learning. Additionally it was specifically stated that by drawing on the workers’ perception and understanding it, a training could be designed accordingly leading to a more effective training. Which might ultimately lead to an adequately skilled and knowledgeable workforce, leading to an efficiently operating company (Riding & Mortimer, 2000). These findings might indicate that workers within this study positively perceive video as a learning tool. Furthermore, by addressing realistic training scenarios through video might influence the learning outcomes benefitting video over a PDF-‐tutorial.
state that inquiry learning is assumed to be too challenging for these students, as it enables them to use a more scientific approach. Although this claim addresses a different type of learning than the current study, it indicates that production workers might have more difficulty in acquiring deeper learning concerning their procedural knowledge than simply memorizing theory in their factual knowledge. Subsequently, Vreman-‐de Olde (2006) describes these kind of students as do-‐ers and that they prefer the practical application of their knowledge due to the fact that they are visually oriented. Therefore, in enabling the secondary vocational students to connect reality and theory, he suggests using realistic visualizations in computer simulations. These findings seem to be in line with the perception study of Timma (2007) and support the claim that production workers might learn more effectively when use realistic learning tools, such as a video tutorial.
Research Question
The aim of the study is to investigate to what extent video is an effective learning tool for production workers within a global manufacturing organization. Additionally, examining if video learning is significantly more efficient then learning through PDF, in training them how to use and understand an online system. An important question in this topic is, how does video optimally addresses the learning goals for the workers? The workers had to become acquainted with the system by knowing how to follow certain procedures in order to find the information that was needed. Additionally, memorizing the meaning of certain phrases and abbreviations. Therefore, the participants were assessed specifically on procedural knowledge and factual knowledge enabling to possibly observe what condition is more beneficial to these types of knowledge. Consequently, ideally conclusions can be drawn about whether video is an effective and efficient learning tool for production workers in a global organization, using an online software system.
The research question derived from these topics is:
Is video a more effective and efficient learning tool than PDF among production workers within a global organization, in training them on understanding and using an online system?
be paid to the (training) time it took the participants to finish the test in both the video and text condition. Based on these topics, this study aims to provide empirical evidence for the following hypotheses:
Hypothesis 1: Test results demonstrate that the participants using video as a learning tool score significantly higher on the test results than the participants using PDF. Which would support the findings of Hoffler and Leutner (2007) and van der Meij and van der Meij (2014).
Hypothesis 2: The participants using video as a learning tool need significant less time to complete the test than the participant using PDF. Which is in line with the findings of Palmiter and Elkerton (1993)
Finally, this study aims to provide new insights on the possible difference between conditions on the retention rate. Leading to the last hypotheses.
Hypothesis 3: The participants using video as a learning tool reveal a significant higher retention rate than the participants using PDF.
Method
Research design
For this study an intervention-‐based quasi-‐experimental design was constructed. Aiming to measure and analyze possible differences between the effectiveness and efficiency of video learning versus learning through PDF, focusing specifically on the learning outcomes of factual-‐ and procedural knowledge and retention rate. Achieving this goal, requires a distribution of all participants into two contrasting samples. The first sample group followed a pre-‐test-‐ intervention-‐ post-‐test process containing a video tutorial as the intervention, ideally demonstrating the effects of the video on the learning process. The second sample group followed the same routine as the first, however using PDF as a substitute for the video. Ideally demonstrating the effects of learning through text and still graphics on the learning process.
Participants were randomly assigned across the first and second sample group. In order to test the retention rate of the first and second sample group, eighty reliable participants were selected and assigned to the retention-‐test. Both groups consisted of group 1 and group 2 participants, ideally demonstrating the retention-‐rate of sample group 1 and sample group 2.
Table 1. Research design
Pre-‐test PDF-‐training Video-‐training Post-‐test Retention-‐test
Sample group1 O X O O
Sample group 2 O X O O
Participants
Apollo Vredestein B.V., research facilitator, harbors around 1257 production employees containing the occupations mechanics, operators, instructors, coordinators and process engineers. The production
employees vary from background, age and qualifications. Although the amount of differentiation within the production industry is high, producing different products for varying industries and using contrasting processes, the total population (100.000+) reveals similarities on the level of education, gender and background (ROA & CBS, 2014). Due to the fact the study focused on a particular subset of people, namely production workers, a purposive sampling method was used, targeting all 1257 production workers within the company of Apollo Vredestein B.V. For the pre-‐test all production workers were approached, revealing a response rate of 40.1 % (N=504) from which the test results of 368 participants were considered as reliable. Due to the fact this study specifically investigates possible changes in the learning gain of the participants, the participants scoring 100% on the pre-‐test were excluded from the analysis. Furthermore, participants were expected to conduct both the pre-‐test and the post-‐test. Revealing a conclusive sample group of 191 participants.
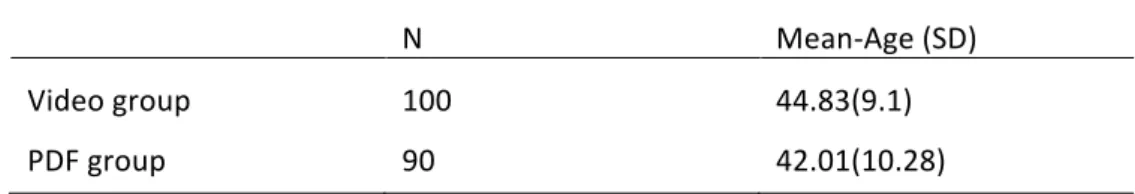
Within this group 12.4% had VMBO as their highest education level, .9% had HAVO as their highest education level, 19.7 % had MBO-‐2 as their highest education level, 30 % had MBO-‐3 as their highest education level, 25.3% had MBO-‐4 as their highest education level and 5.2% had HBO as their highest level. The residual participants educational level were either unknown or not significant to be representative. The group revealed a mean age of 43,44 (N=190, SD= 9.9), varying from 18 years till 62 years old.
Table 2. Distribution Sample groups reliable for data analysis.
N Mean-‐Age (SD)
Video group 100 44.83(9.1)
PDF group 90 42.01(10.28)
Materials
Conducting the experiment necessary for this study required the development and implementation of several instruments. In the context of an upcoming audit, Apollo Vredestein had to meet certain specific criteria regarding an online quality management system (QMS). In order to provide all the production
workers the requisite knowledge applying QMS, a custom-‐made training was designed. This study utilized the opportunity to adopt this training and guided it towards the requirements of a scientific research, including a pre-‐test, two interventions, post-‐test and retention-‐test.
Pre-‐test, Post-‐test and retention-‐test.
The goal of the pre-‐test was to measure the current knowledge the participants had on QMS, this would provide a baseline on which possible differences in learning methods and learning gains could eventually be measured. Because the training was custom-‐made, aiming to provide the production workers with the necessary knowledge to reach the requirements of the upcoming audit, there was no appropriate existing testing format available that could be applied in this context. Leading to a self-‐designed ,custom-‐made test focused specifically on the knowledge and procedures the production workers were desired to know about QMS. More specifically, the participants were assessed on factual questions concerning abbreviations they were required to know and trough what media they could find QMS. Additionally, they were desired to understand the structure of the system and how to apply specific steps to gather relevant information about their daily routines and machines. Although the test was custom-‐made, the designing of the test was guided by best practices pinpointed by Piontek (2008). A multiple-‐choice test was designed with the advantages that it can measure various kinds of knowledge. In designing the questions, special attention was focused on writing clearly, keeping the options short with only the information that is needed and plausible yet completely wrong distractors (McMillan, 2001). This would ensure the reliability and validity of the test.
divided into five factual (E.g. What does the abbreviation Q.M.S stand for?) questions and five procedural questions (E.g. How often, does the process ‘transport to cutter’ needs to be applied at the machine Bias 7 in the C.P. ?) adapted to the cognitive skill and level of the participants, that was tested during multiple test-‐ assessments and designed in cooperation with the organizations’ education department. Due to the fact that the sample group demonstrated a large amount of differentiation regarding to background and education level, this study utilized the same testing system the workers usually were assessed by. Via the online system, Question mark Perception, a multiple-‐choice test was constructed and data was collected. Both the post-‐test and retention-‐test were parallel tests from the pre-‐test, tested in the same program, containing ten parallel questions. Before analyzing the data, a Cronbach’s Alpha test was constructed to measure the reliability of the pre-‐ and post-‐test. Results revealed that the Pre-‐test lacked a sufficient Cronbach’s Alpha level for it to be considered as reliable (α=.59), it improved when question three was deleted (α=.63), however not improving enough to be considered as completely reliable. Contrasting results were found for the reliability of the Post-‐test (α=.7) and when question three was deleted (α=.71) . Due to the limited sample size of the retention-‐test and the fact that all the questions came from the pre-‐test and post-‐test no internal consistency test was conducted.
Video.
Using video as a learning and intervention tool required the development of a video that specifically contained the content needed to provide the production workers the appropriate knowledge concerning QMS. In guidance of developing the video the ‘eight guidelines for the design of instructional videos for software training’ (van der Meij & van der Meij, 2013) article was used and implemented to assure its scientific quality (Figure 2). The video covered a length of eight minutes, following a step-‐by-‐step explanation on the usage of QMS and the practical application of it. Furthermore, it explained the practical relevance of the system and necessity in the context of the upcoming audit. The goal of the training was to present the usage of the online system in the real-‐life practical context. All the procedures the participant needed to know in order to optimally use the system, was presented in a sequential way. The video training differs from the PDF training due to the fact it contains a continuous video process, explaining the procedures step by step through a spoken narration.
Guideline 1: Provide Easy access 1.1: Craft the title carefully
Guideline 5: Provide procedural rather than conceptual information
Guideline 2: Use animation with narration Guideline 6: Make tasks clear and simple 2.1: Be faithful to the actual interface in the
animation
2.2: Use a spoken human voice for narration 2.3: Action and voice must be in synch
6.1: Follow the user’s mental plan in describing an action sequence
6.2: Draw attention to interconnection of user actions and system reactions
6.3: Use highlighting to guide attention
Guideline 3: Enable functional interactivity
3.1: Pace the video carefully Guideline 7: Keep videos short 3.2: Enable user control
Guideline 4: Preview the task 4.1: Promote the goal
4.2: Use a conversational style to enhance perceptions of task relevance
4.3: Introduce new concepts by showing their use in context
Figure 2. Eight Guidelines for the Design of Instructional Videos for Software Training. Adapted from Eight Guidelines for the Design of Instructional Videos for Software Training by H.van der Meij & J. van der Meij (2013)
Derived from the eight guidelines the video was called ‘QMS training video’. The video contained a spoken narration that guided the animation, which is in line with Guideline two of van der Meij and van der Meij (2013). The video was shot in the actual factory the workers were active and used the same computers the workers used in their daily practice. In line with the third guideline the video was paced carefully providing the workers enough time to process the offered theory. Furthermore, the participants were able to pause and rewind the video and the goal was promoted verbally at the beginning of the video. Finally, within the video highlighting was used to focus on specific topics and the theory was presented step-‐by-‐step according to the participants’ mental plan.
Although the video covered almost every guideline, a lot of theory and procedures had to be explained to the participants eventually leading to an overall length of eight minutes. Leading that the video did not meet the seventh guideline, which stated that the video should be kept short and compact.
Figure 4. Scene where a procedure is explained through highlighting.
Text including still graphics (PDF).
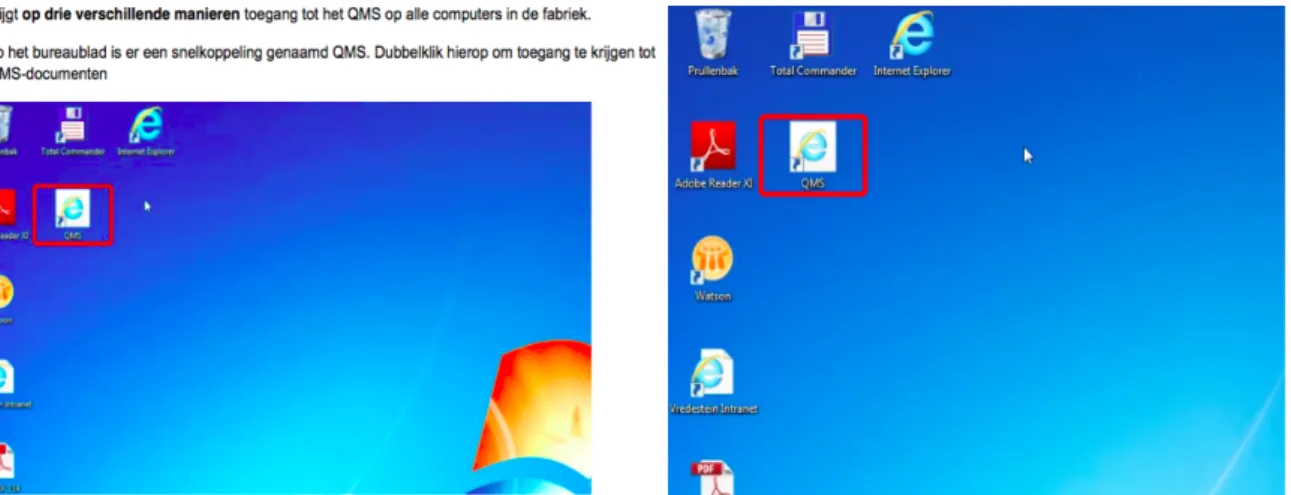
In order to measure the effects of the video in comparison with a traditional learning tool, a PDF-‐file was designed. To assure that there would be no inconsistencies between the content of the video and the PFD-‐ file benefitting one over the other, the original script of the video was used as a basis for the PDF learning tool. The text the narrator used was copied in the PDF in combination with screenshots from the video in which the same relevant items were explained. The PDF-‐file contained fifteen pages, following a step-‐by-‐step explanation of QMS including a practical application. The PDF training differs from the video training through its written instructions and still graphics.
Figure 6. PDF-‐page explaining a concept by highlighting (left) same concept explained in video (right)
Procedure
Before conducting this research, the research process was reviewed and approved by ethical committee of the University of Twente. The environment selected for this study is the organization Apollo Vredestein B.V. Apollo Vredestein is a global company that manufactures and sells tyres. The factory in Enschede, which facilitated the study, harbors around 1600 employees from which 1257 work in the production department. The production workers are required to use online systems guiding them through daily processes. The knowledge of the workers about these systems was prior to the training not sufficient, having consequences on the production quality. Providing these workers the necessary knowledge requires specified training. One of these systems concerns the Quality Management System (QMS), which contains essential procedures and specifications the employee has to follow in their daily routines and responsibilities. Within QMS, every single machine has a PDF-‐document containing an explanation on the related procedure and certain machine and material specifications. Because the knowledge prior to the training on how to find QMS and how to use it is not sufficient and is an important part of an upcoming audit, the organization decided to design a training specifically for this problem addressing al production workers. This training is designed in relation with this study and stands as a basis on which this research is build.
Phase 1.
participants were obliged by the organization to follow it. However, in being part of the research the
participants had the opportunity to refuse and if so, their results would not be used in the data collection. No objections were made. A total of 504 participants responded and made the pre-‐test, from the residual participants a total of 575 responded and made only the post-‐test, the participants that revealed reliable data were assigned to the post-‐test only group.
The test was available in an online testing-‐program called ‘Question mark Perception’. Every single participant possessed his own unique login code that would direct them towards the pre-‐test. Trying to ensure control over the reliability of the test, the program was only accessible within the factory and internal coordinators were responsible for the facilitation and control of the process. The tests were mostly
conducted at the office of the coordinator or instructor. Multiple preliminary tests revealed that if a participant was already familiar with the system and knew (some) questions by heart, the test would still have a minimum duration of two minutes and forty seconds. The testing-‐program collected data on the test-‐ results, duration of the test and at what time the test took place. However, it was ensured that, due to privacy reasons, the participants were assigned a unique number replacing his or her name. Furthermore, the number did reveal information about the level of education and age of the participant. The data was exported into excel and imported into SPSS to conduct relevant tests.
Around 45 coordinators received an e-‐mail instructing them what was expected from them in the testing and training process. It was expected that they facilitated the training including the tests and provided control over it, meaning that ideally someone would be available to guide the training and tests. In assistance of the coordinators the researcher’s help was available during office hours. The pre-‐test was open for a period of fifteen days, providing all the production workers sufficient time to execute it. At the end of the fifteenth day, the test was closed and data was exported into an excel file.
Phase 2.
The participants that conducted the pre-‐test were equally and randomly divided into two groups. Group 1 was assigned to the video-‐training including test and group 2 was assigned to the PDF-‐training including test. 36 hours after the pre-‐test was closed, the coordinators and production workers received an e-‐mail
participants had multiple attempts to pass the test. Only the first attempt the participant completed was used in the data for this study. Due to the importance of the test, all the production workers were provided sufficient time to complete the training, leading to the training and test to be open during a period of four weeks. After exactly four weeks, the test was closed and data was exported into an excel file.
Phase 3.
The last part of the research consisted of the completion of the retention test. Forty participants from both group 1 and 2 were handpicked and assigned to the retention group. However, due to practical limitations the sample group for the retention tests revealed a response rate of in total 57 participants. The
coordinators that were concerned with these specific participants were personally approached to emphasize the fact, that because of the sample group size it was of most importance that the test would be controlled optimally. Similar to the previous tests, the tests were completed in the office of the coordinator or
instructor. The retention test was open during a period of exactly one month, that was needed to test a sufficient amount of workers from all the selected participants. After the test was closed, data was exported into an excel file
Data analysis
Before performing analyses on the data revealing possible differences between the learning tools, a Cronbach’s Alpha test was constructed to measure the reliability of the pre-‐ and post-‐test. Additionally, means were compared focusing on the learning outcomes and the duration of the tests via a repeated measures test. Correlations concerning possible relations between age, level of education, time and test scores were measured using a regression analysis. Furthermore, to provide evidence for the hypotheses several ANOVA and t-‐tests were conducted focusing on possible significant differences among the disparate learning methods. Within the data there were a number of demands the participants would have to
Results.
Aiming to provide support for the aforementioned hypotheses, several statistical analyses were conducted through SPSS 24. A repeated measures ANOVA test revealed that participants scored significantly higher on the Post-‐test than on the Pre-‐test for both the Video group (P=.001, F=1.87) and the PDF group (P=.001, F=1.252), as demonstrated in table 4.
Table 4. Analysis of sample size, mean score (SD) Pre-‐test, mean score (SD) Post-‐test for Video group, PDF group. A maximum of 9 points could be scored.
N Mean score Pre-‐
test (SD)
Mean score Post-‐ test (SD)
Video 100 6.51(1.75) 8.34(1.34)
PDF 90 6.91(1.34) 8.26(1.08)
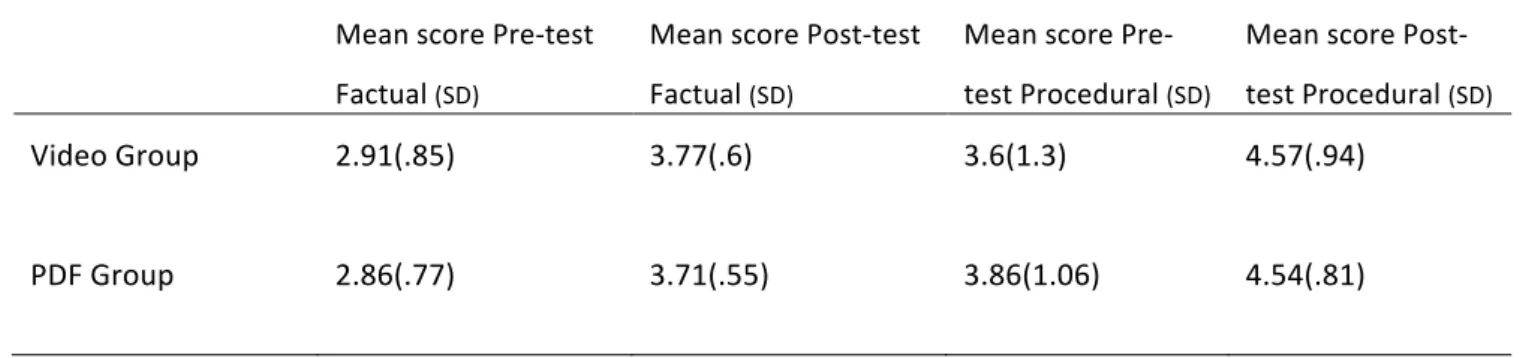
A similar test was conducted concerning the mean scores of the factual-‐ and procedural questions that were included as a variable in the several tests (Table 5). Results demonstrated that participants scored
significantly higher on the factual questions in the Post-‐test for the Video group as well as the PDF group (P=.00, F=118.67) then the pre-‐test. Similar results were found concerning the procedural questions for the Video group and the PDF group (P=.00, F=56.441).
Table 5. Mean scores on factual and procedural questions and standard deviation regarding the Video-‐ and PDF group for both the Pre-‐test and Post-‐test. A maximum score of 4 points could be scored for the factual questions, and a maximum of 5 for the procedural questions.
Mean score Pre-‐test Factual (SD)
Mean score Post-‐test Factual (SD)
Mean score Pre-‐ test Procedural (SD)
Mean score Post-‐ test Procedural (SD)
Video Group 2.91(.85) 3.77(.6)
3.6(1.3) 4.57(.94)
PDF Group 2.86(.77) 3.71(.55)
Correlations.
Additionally, results were analyzed to measure possible correlations between the age of the participants, education level, the time they took to finish the test and the test results. However, results revealed no significant correlations between any of the variables.
Hypotheses testing.
Aiming to provide support for the aforementioned hypotheses, results were analyzed to possibly reveal if the participants conducting the video-‐training and PDF-‐training significantly differed in the test scores and the time (in seconds) it took them to conduct the test. Exploring these topics, repeated measures ANOVA tests were conducted.
Before executing the analysis and exploring possible differences in the test results, a Levene’s test was conducted to test the homogeneity of variance revealing no significant difference between groups (P=.18). Furthermore, an analysis of variance revealed no significant difference between the Pre-‐test scores for the Video-‐group and the PDF-‐group (P= .08).
Although the mean post-‐test results of the video-‐group differed from the PDF-‐group as demonstrated in table 4, ANOVA analysis revealed no significant difference between the Video-‐group and the PDF group (P= .096 F=2.805) for the post-‐test results.
Figure 7. Graphic containing mean scores Pre-‐test and Post-‐test for both conditions
A similar analysis was conducted concerning the duration of the post-‐test. A Levene’s test was conducted to test the homogeneity of variance revealing no significant difference between groups (P=.18). Furthermore,
6 6,5 7 7,5 8 8,5
Pre-‐Test Post-‐Test
Video
an analysis of variance revealed no significant difference between the Pre-‐test scores for the Video-‐group and the PDF-‐group (P= .356).
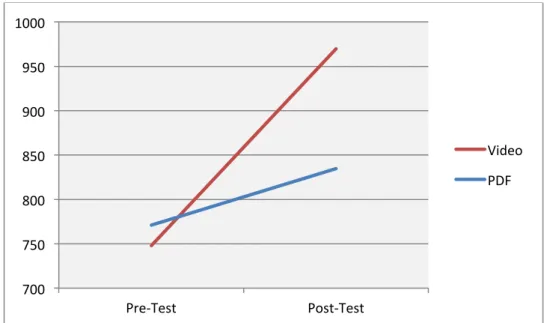
In contradiction with the test results there was a significant difference found between the Video-‐group and PDF-‐group concerning the time it took for the participants to execute the Post-‐test (P= .007, F=7.505).
Table 7. Mean time in seconds (SD) for the Video-‐Group, PDF-‐Group and Video-‐Only-‐Group concerning the Post-‐test.
N Mean(sec) SD
Video-‐Group
100
969.61
354.42
PDF-‐Group
90
834.83
378.88
Figure 8. Graphic containing mean time in seconds Pre-‐test and Post-‐test for both conditions.
In order to measure possible differences concerning procedural-‐ and factual knowledge via an ANOVA test, again a number of assumptions had to be met. First an analysis of variance revealed no significant difference between the Pre-‐test scores for the Video-‐group and the PDF-‐group on factual questions (P= .221). Secondly the data was tested for the homogeneity of variance revealing no significant difference (P=.88), also meeting
700 750 800 850 900 950 1000
Pre-‐Test Post-‐Test
Video
the second assumption. ANOVA tests results revealed no significant difference between the Video-‐group and the PDF group concerning factual knowledge (P= .143, F=2.160).
Additionally a similar process was conducted concerning the procedural knowledge. First an analysis of variance revealed no significant difference between the Pre-‐test scores for the Video-‐group and the PDF-‐ group on procedural questions (P= .142). However, the data was tested for the homogeneity of variance revealing a significant difference(P=.04), violating the second assumption. Consequently meaning that the analysis was conducted with a Welch test. The robust test of equality of means demonstrated no significant difference between the groups (P=.205, F=1.621).
Retention rate.
Conclusively, this study aims to provide evidence for the final hypothesis stating that it is expected that the retention rate for the video-‐group is significantly higher than the PDF-‐group. Looking at the mean retention scores at table 11, data revealed that the mean scores for both groups were higher on the retention-‐test than the post-‐test. First, a paired samples t-‐test revealed no significant difference between the mean post-‐ test scores and mean retention-‐test scores (P=.284). Before testing possible differences between groups on the retention-‐score via an ANOVA test, the homogeneity of variance tested with Levene’s demonstrated no significant difference (P=.937). Additionally, ANOVA test revealed no significant difference between the video-‐ and PDF-‐group (P=.308, F=1.203). In line with these results, ANOVA analysis demonstrated no significant difference on factual knowledge (P=.772, F=3.302) and procedural knowledge (P=.829, F=.189 ).
Table 11. Mean score post-‐test (SD) versus mean score retention-‐test (SD), with a maximum score of 9 points.
Mean score post-‐test (SD) Mean score retention-‐test (SD)
Video-‐group
8.34(1.34)
8.52(.9)
PDF-‐group
8.26(1.08)
8.57(.99)
In contradiction with the findings for the test duration concerning the post-‐test, ANOVA analysis revealed no significant difference between the Video-‐group (M= 574.78, SD= 456.42) and the PDF-‐group (M=378.65, SD= 256.05, P=.051, F=3.985 ) in the time it took them to finish the retention-‐test.