© 2016, IRJET | Impact Factor value: 4.45 | ISO 9001:2008 Certified Journal | Page 1007
GRADIENT HISTOGRAM ESTIMATION AND PRESERVATION FOR IMAGE
DENOISING USING DWT
Muralidharan.K
1, Karthika P.S
2,
Sowmiya .J
3,
Sohail Akbar
41Assistant Professor, Dept. of Electronics and Communication Engineering, Coimbatore Institute
Of Technology, Coimbatore, India
2M. E. Student, Dept. of Electronics and Communication Engineering, Coimbatore Institute of
Technology, Coimbatore, India
3M. E. Student, Dept. of Electronics and Communication Engineering, Coimbatore Institute
Of Technology, Coimbatore, India
4M. E. Student, Dept. of Electrical and Electronics Engineering, Agni college
Of Technology, Chennai, India
---***---Abstract -
contrast image. In histogram equalization theintensity values are distributed an effective manner. It helps areas on the image with low contrast to have a better or higher contrast before filtering steps.Histogram equalization generally takes the intensity levels of an image and calculates the total number of pixel in the image at each pixel intensity level. The intensity levels of the image are then spread over to fill the entire space of available intensities, and thereby it increasing the contrast of the image. This is achieved by allocating the pixels at each intensity level with the percentage of the range that matches there percentage of the total number of pixels in the image. PSNR is most commonly used to measure the quality of reconstruction of lossy compression(e.g., image compression). The signal in this case is the denoised data and original data.
Key Words: PSNR, denoised, histogram.
1.
MATHEMATICAL MODEL
PSNR=10[log]_10 ([[MAX]_I]^2/MSE) (1)
=20[log]_10 ([MAX]_I/√MSE) (2)
=20[log]_10 ([MAX]_I )-10[log]_10(MSE) (3)
The above equation (1), (2), (3) shows the
PSNR value. PSNR is most easily defined via the Mean
Squared error (MSE) is shown in equation (4). A
noise-free m×n monochrome image I and its noisy
approximation K..
MSE is defined as:
MSE=1/mn∑_(i=0)^(m-1)∑_(j=0)^(n-1)[[I(i,j)K(i,j)]]^
(4)
I=represents the matrix data of our original image
K=represents the matrix data of our degraded image in
question.
m=the numbers of rows of pixels of the images and i
represents the index of that row.
n= the number of columns of pixels of the image and j
represents the index of that column.
MAXI is the maximum signal value that exists in our
original known to be good image.
1.2 IMAGE DENOISING USING GRADIENT
HISTORGRAM
The pixels will still remain in the same order relative to all lighter and darker pixels in the original image, they will just be shifted and or stretched in terms of where and how much of the intensity range they occupy. Image histogram equalization actually deals with averaging and reduction of noise by adding certain other noisy images also. Image denoising can be done in the many ways includes one of the strong techniques called image filter..
© 2016, IRJET | Impact Factor value: 4.45 | ISO 9001:2008 Certified Journal | Page 1008 Exploiting some image and noise prior models,
Histogram of Oriented Gradients (HOG) are feature descriptors used in computer vision and image processing for the purpose of object detection and The details counts of gradient orientation in localized part of an image. This method is same to the edge orientation histograms, scale-invariant feature, and shape contexts, but not the same in that it is computed on a dense grid of uniformly spaced cells and uses overlapping local contrast normalization for improved accuracy
The second step of calculation involves creating the cell histograms. Every pixel within the cell casts a weighted vote for an orientation-based histogram channel based on the values found in the gradient computation. The cells can either be rectangular or radial in shape, and the histogram channels are evenly fill over 0 to 180 degrees or 0 to 360 degrees, depending on whether the gradient is “unsigned” or “signed”. Dalal and Triggs found that unsigned gradients used in conjunction with 9 histogram channels performed best in their human detection experiments.
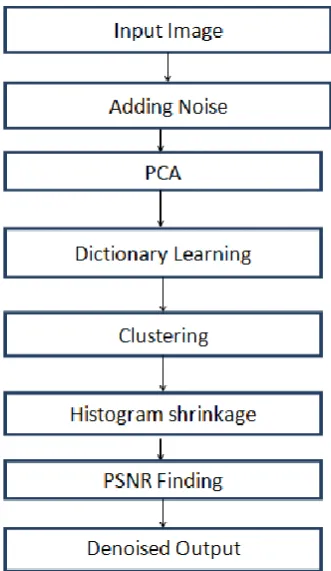
Fig 1 Flow Chart Of Gradient Histogram Based Image Denoising
Fig 1 shows the flow chart of Gradient Histogram Preservation for computation of Gradient values and calculate the colour values.
As for the vote weight, pixel contribution can either be the gradient magnitude itself, or some function of the magnitude. It achieves the worst decomposition level that as low as low level. The low level PSNR values only achieved. A method is aimed at minimizing image noise while it optimizing contrast of image subtle features level getting as low level.
2
PROPOSED IMAGE DENOSING ALGORITHM
Numerical analysis and functional analysis, a discrete wavelet transform (DWT) is any wavelet transform for which the wavelets are discretely sampled. The other wavelet transforms, It is an advantage over Fourier transforms is temporal resolution: it captures both frequency and location information (location in time).
The first DWT was invented by Hungarian
mathematician AlfrédHaar. Input represented by a list
of 2^n numbers, the Haar wavelet transform can be
considered to pair up input values,storing not the
same data and passing the sum. This process is doing
again recursively, pairing up the sums to provide the
next scale, which leads to 2^n-1 differences and a final
sum.The lifting scheme is a technique for both
designing wavelets and performing the discrete
wavelet transform. it is worthwhile to move these
steps and design the wavelet filters while performing
the wavelet transform. It is called the second
generation wavelet transform. In this technique was
introduced by WimSweldens.
The Generalized Lifting Scheme is a derivative
of the Lifting Scheme, in which the add and subtract
operations are absorbed into the update and prediction
steps, respectively. These steps can be any mapping,
leading to many general lifting scheme.
Fig 2 Simple Lifting Scheme
[image:2.595.77.243.365.651.2] [image:2.595.381.524.566.663.2]© 2016, IRJET | Impact Factor value: 4.45 | ISO 9001:2008 Certified Journal | Page 1009 estimate of xd. The new obtained signal x ′ d = xd − P(xa) is
then smaller than xd. Finally, the even samples of x are transformed into a low-pass filtered and subsampled version x ′ a of the original signal x. This is done by using an updating operator U which is a linear combination of the elements of x ′ d.The approximation signal x ′ a = xa + U(x ′ d ) is then obtained. The principal disadvantage of the LS described above, that the linear filtering design is fixed and thus, does not match well the sharp transitions in the signal. The lifting schemes with adaptive prediction (APLS) [10], [11], [12] or adaptive update (AULS) [7], [8], [9] have been designed to overcome this limitation by the use of a filter that is able to adapt itself to the input signal it is analyzing Fig2 shows that the input image for gradient histogram preservation
The Lifting scheme (LS) is a method to simplify performing the wavelet transform in an efficient way. The (LS) can be performed by three steps:-split stage, predict stage, and update stage.
Fig 3:
Block diagram of DWT using lifting schemeThe above figure 3 shows the updated sigma value. The preprocessing block will check the image format size and colour space. A typical lifting stage is composed of three steps : Split, Predict and Update is shown in the Figure. In the lifting scheme the split stage is used to decomposed the picture into small images. Update stage is check the image coefficient values with decomposed images.The predict stage update the coefficient values. In IDWT blockimage pixels is converted into original matrix and finally denoised image is obtained..
2.1
SIMULATION AND RESULTS
[image:3.595.49.293.334.448.2]input image
Fig 4 Gradient histogram input image
AWGN noise added
Fig 5 AWGN noise added image of Gradient Histogram Based Image Denoising
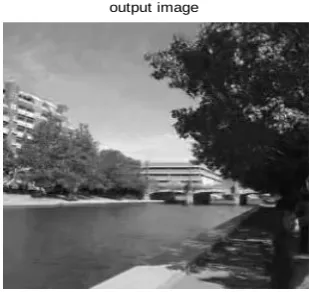
output image
[image:3.595.356.511.565.711.2]© 2016, IRJET | Impact Factor value: 4.45 | ISO 9001:2008 Certified Journal | Page 1010 Fig 7 DWT Based Image decomposition image
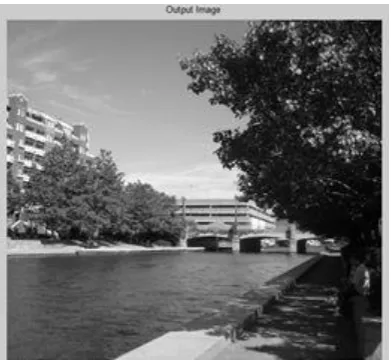
Fig 8 Output image DWT Based Image Denoising
The figure 4 shows the input image of gradient histogram and DWT. Figure 5 AWGN noise added image of Gradient Histogram Based Image Denoising. Fig 6 shows Output Image of gradient based image denoising. Fig 7 shows DWT Based Image decomposition image. Finally the output image is obtained is shown in figure 8.
1 2 3 4 5 6 7 8 9 10
26 28 30 32 34 36 38
psnr values of standard deviation at 20
BM3D S-GHP LSSC NCSR
Fig 9 image Vs PSNR values
Fig 10 image Vs PSNR values
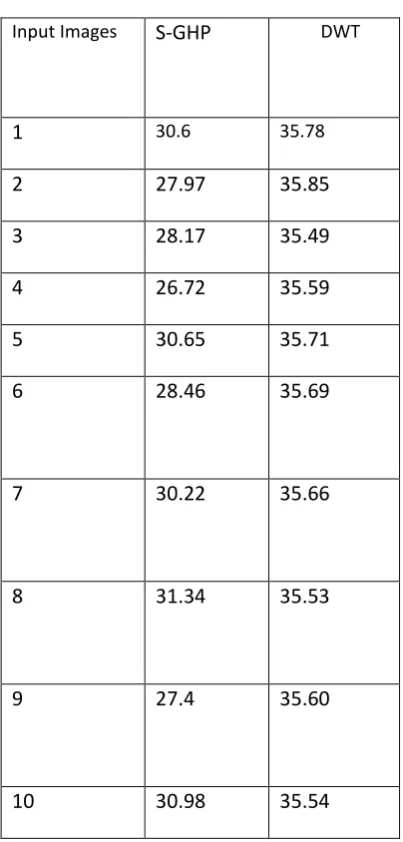
[image:4.595.64.260.313.495.2]© 2016, IRJET | Impact Factor value: 4.45 | ISO 9001:2008 Certified Journal | Page 1011 Table 1-Comparision of Input images VsPSNR Values of
S-GHP,DWT
Input Images
S-GHP
DWT1
30.6 35.782
27.97
35.85
3
28.17
35.49
4
26.72
35.59
5
30.65
35.71
6
28.46
35.69
7
30.22
35.66
8
31.34
35.53
9
27.4
35.60
10
30.98
35.54
3.CONCLUSION
A approach for image denoising via discrete wavelet transform, by using a lifting scheme is proposed in the paper. This approach, based on the estimation of the energy in the transform sub bands, gives better performances than the classical gradient histogram estimation. Dwt using lifting scheme introduce to reduce the time consumption and to increase PSNR values so quality images is obtained and to make the images to look more natural.Future work will be dedicated to other thresholding methods, such as SureShrink, which is a hybrid of the universal and the sures threshold.
4. REFERENCE
[1] J. Portilla, V. Strela, M. J. Wainwright, and E. P. Simoncelli, “Image denoising using a scale mixture of Gaussians in the wavelet domain,”IEEE Trans. Image Process., vol. 12, no. 11, pp. 1338–1351, Nov. 2003
[2] M. Elad and M. Aharon, “Image denoising via sparse and redundant representations over learned dictionaries,” IEEE Trans. Image Process., vol. 15, no. 12, pp. 3736–3745, Dec. 2006.
[3] W. Dong, L. Zhang, G. Shi, and X. Wu, “Image deblurring and superresolution by adaptive sparse domain selection and adaptive regularization,” IEEE Trans. Image Process., vol. 20, no. 7, pp. 1838–1857, Jul. 2011.
[4] A. Buades, B. Coll, and J.Morel, “A review of image denoising methods, with a new one,” MultiscaleModel.Simul., vol. 4, no. 2, pp. 490–530, 2005.
[5] K. Dabov, A. Foi, V. Katkovnik, and K. Egiazarian, “Image denoising by sparse 3D transform-domain collaborative filtering,” IEEE Trans. ImageProcess., vol. 16, no. 8, pp. 2080– 2095, Aug. 2007.
[6] B. Toufik and N. Mokhtar; (2012). "The Wavelet Transform for Image Processing Applications", Advances in Wavelet Theory and Their Applications in Engineering, Physics and Technology, Dr. DumitruBaleanu (Ed.), ISBN: 978-953-51-0494-0, InTech.
[7]. J. Joshi, and N. Nabar; "Reconfigurable Implementation of Wavelet based Image Denoising", IEEE international Midwest symposium on Vol.1, pp. 475-478, 2006.
[8]. w. sweldens; "the lifting scheme: a construction of second generation wavelets", tech. rep. 1995. industrial mathematics initiative, department of mathematics, university of south carolina.
[9]. d. l. donoho and i. m. johnstone; "ideal spatial adaptation by wavelet shrinkage", biometrika, vol. 81, no. 3 (aug., 1994), pp. 425-455.
© 2016, IRJET | Impact Factor value: 4.45 | ISO 9001:2008 Certified Journal | Page 1012
BIOGRAPHIES
Muralidharan.K. He received his B.E.
Degree in Electronic and
Communication Engineering from
Anna University (BIT
campaus),Tiruchirapalli, (India) in 2013.He received his M. E. (Applied
Electronics) degree from
Coimbatore Institute of Technology, Coimbatore(India) in 2015. He is currently working as a Assistant Professor with the Department of Electronics and Communication Engineering in Coimbatore Institute
of Technology,
Coimbatore(India).His area of interests includes Electronics circuit design, VLSI design, Advance digital signal processing,, Digital image processing.
Karthika P.S. She received his B.Tech. Degree in Electronics and Communication Engineering from Dr.B.R.Ambedkar Institute of Technology Pondicherry University, (India) in 2014.She is currently pursuing M. E. (VLSI design) degree from Coimbatore Institute of Technology, Coimbatore(India). Her
area of interests includes
Electronics circuit design, VLSI design, Advance digital signal
processing, electronics and
communication, Digital image processing, and Nano scale device & circuit design.
Sowmiya J. She received his B.E Degree in Electrical and Electronics Engineering from PPG IT, Anna University, (India) in 2014.She is currently pursuing M. E. (VLSI design) degree from Coimbatore
Institute of Technology,
Coimbatore(India). Her area of interests includes Electronics circuit
design, VLSI design, CMOS Design, Power System and digital systems.
Sohail Akbar. He received his B.Tech. Degree in Electronics and Communication Engineering from Dr.B.R.Ambedkar Institute of Technology Pondicherry University, (India) in 2014. He is currently pursuing M. E. (Power Electronics and drives)degree fron Agni college of Technology(India). His area of interests includes soft computing techniques, power electronics, Electronics and Communication, Digital image processing,,power electronics application in renewable energy generation and HVDC transmission system.