© 2016, IRJET | Impact Factor value: 4.45 | ISO 9001:2008 Certified Journal
| Page 411
A Case Study on Reducing the Lead Time and Increasing Throughput by
using Value Stream Mapping
Gokulraju R
1, Vigneshwar K
2, Vignesh V
31, 2
Assistant Professor, Department of Mechanical Engineering,
3Assistant Professor, Department of Mechatronics Engineering,
Akshaya College of Engineering and Technology, Coimbatore -642109.
---***---Abstract -
Lean manufacturing is a method adopted toshorten the time between the customer order and the customer order and the product shipment by eliminating sources of waste. The purpose of this study is to develop plan for reducing lead-times and increase throughput in /M120 2” 5K gate valve body within cell no.2 of existing plant layout using value stream mapping. Related to the component required production data is collected from company’s ERP system. Study of data and takt time calculated reveals a requirement in process improvement. Present state material flow, information flow and cycle time for the component is recorded. A current state value stream map is constructed. Current state value stream map depicts the existence of long lead times and less throughput with present batch size of 15 Nos. A future state value stream map is created using takt time, machine layout configuration, line balancing, 5S and ergonomics to suggest ways to reduce lead times and increase throughput.
Key Words: Lean Manufacturing, Value Stream Mapping, OEE, Takt time, Line Balancing, Kaizen
1. INTRODUCTION
The customer driven and highly competitive market has rendered the old fashioned managerial style and inadequate tool to cope with new uprising challenges in the manufacturing and service sectors. While some companies continue to grow based on economic constancy, other companies struggle because of lack of understanding the changes in customer mindset and cost practices. To tackle this situation and become more profitable, many manufacturers have started to turn to lean manufacturing system in order to elevate the performance of their firms
The basic ideas behind the lean manufacturing system are waste elimination, cost reduction and employee empowerment. The lean manufacturing discipline is to work in every facet of the value stream by eliminating
waste in order to reduce cost, generate capital, being in more sales and remain competitive in a growing global market. The value stream is defined as “the specific activities with a supply chain required to design order and provide a specific product or value: (Hines and Taylor, 2000)
1.1 Objectives of Lean Manufacturing
Lean Manufacturing, also called Lean Production, is a set of tools and methodologies that aims for the continuous elimination of all waste in the production process. The main benefits of lean manufacturing are lower production costs; increased output and shorter production lead times. More specifically, some of the goals include:
a) Defects and wastage- Reduce defects and unnecessary physical wastage, including excess use of raw material inputs, preventable defects and costs associated with reprocessing defective items and unnecessary product characteristics which are not required by customers.
b) Cycle Times – Reduce manufacturing lead times and production cycle times by reducing waiting times between processing stages, as well as process preparation times and product/model conversion times.
c) Inventory levels – Minimize inventory levels at all stages of production particularly work in progress between production stages. Lower inventories also mean lower working capital requirements.
d) Labor Productivity – Improve labor productivity, both by reducing the idle time of workers and ensuring that when workers are working, they are using their effort as productively as possible.
© 2016, IRJET | Impact Factor value: 4.45 | ISO 9001:2008 Certified Journal
| Page 412
f) Flexibility – Have the ability to produce a more flexiblerange of products with minimum change over cost and changeover time.
g) Output – Insofar as reduced cycle times, increased labor productivity and elimination of bottlenecks and machine downtime can be achieved, companies can, generally increase output from their existing facilities.
h) Overproduction – Producing the exact quantity that customers need and when they need it prevents overproduction.
i) Transportation – Get rid of transportation of materials and information that does not add value to the product.
1.2 Key Principles of Lean Manufacturing
Key principles behind Lean manufacturing can be summarized as follows:
a) Recognition of waste – The first step is to recognize what does and does not create value from the customer’s perspective. Any material, process of feature which is not required for creating value from the customer’s perspective, is waste and should be eliminated.
b) Standard processes – Lean requires the implementation of very detailed production guidelines, called standard work, which clearly states the content, in the content, sequence, timing and outcome of all actions by workers. This eliminates variation in the way that workers perform their tasks.
c) Continuous flow – Lean usually aims of the implementation of a continuous production flow free of bottlenecks, interruption, detours, backflows or waiting. When this successfully implemented, the cycle time can be reduced by as much as 90%.
d) production – Also called Just-in-Time (JIT), Pull-production aims to produce only what is needed, when it needed. Production is pulled by the downstream station so that each workstation should only produce what is downstream by the next workstation.
e) Quality at the source – Lean aims for defects to be eliminated at the source and for quality inspection to be done by the workers as part of the in-line production process.
f) Continuous improvement – Lean requires striving for perfection by continually removing layers of waste as they uncovered. This in turn requires a high level of worker involvement in the continuous improvement process.
1.3 Main Kinds of Waste
Originally seven types of waste were identified as part of the Toyota Production System [Sullivan et al., (2002)]
a) Over production – Producing too soon, resulting in poor flow of information or goods and excess inventory.
b) Defects – Frequent errors in paperwork or material/product quality problems resulting in scrap and/ or rework as well as poor delivery performance.
c) Unnecessary inventory – Excessive storage and delay of information or products, resulting in excess inventory and cost, leading to poor customer service.
d) Inappropriate processing – Going about work processes using the wrong set of tools, procedures or systems, often when a simpler approach may be more effective.
e) Excessive transportation – Excessive movement of people, information or goods, resulting in wasted time and cost.
f) Waiting – Long periods of inactivity for people, information or goods, resulting in poor flow and long lead times.
g) Unnecessary motion – Poor workplace organization, resulting in poor ergonomics, e.g., excessive bending or stretching and frequency lost items.
1.4 Purpose of the Study
The purpose of this study is to suggest ways to reduce lead-times and increase throughput of a high pressure gate valve production line at SV Engineering Ltd., a leading high pressure gate valve assembly manufacturer. Reduced lead-times will help get more products out of the door to existing and new customers.
© 2016, IRJET | Impact Factor value: 4.45 | ISO 9001:2008 Certified Journal
| Page 413
2. LITERATURE REVIEW
2.1. Value Stream Mapping of Rubber Products
Manufacturers (Jeffery, 2005)
Jeffery developed a plan for reducing lead-times and increasing throughput in a rubber product manufacturing plant by using value stream mapping to determine areas of potential improvement on the plant floor. A current state map was developed and analyzed to identify areas that have potential for improvement. A future state map was created to suggest ways to reduce leasd-times and to increase throughput. The map included lean manufacturing methods to reduce wastes in the system by increasing throughput and reducing lead-times. A 66% reduction on lead-times and a 20% throughput gain was achieved with the future state map.
2.2. Redesign the value added chain of a service
process in a commercialization steel firm at
Monterrey, Mexico (Juan, 2007)
Juan made an innovative approach using lean concept to solve the problem of cycle time reduction in local steel commercialization firm with an aim to reduce 20% of the total cycle time delivery that occurs from the time the order was placed to the time the merchandise arrived the customer plant. The methodology involved in the development of current value stream map of the selected product is to identify the root cause and design a future state map. The result revealed a total cycle time reduction of 54% more than the 20% originally established goal.
2.3. Integrating industrial engineering and lean
techniques at a contract pharmaceutical
manufacturer (Valerie et al., 2008)
Valerie et al., in their case study on lean technique at a contract pharmaceutical industry represented a number of possible opportunities for specific areas of improvement and suggested an overall change in the manufacturing mindset. Lean manufacturing techniques were utilized in the development of new systems. Using value stream mapping 75% of lead time reduction was achieved. The company benefited from the current state and an envisioned future state of their operation which employed potential and lean technique.
2.4. From Current State to Future state: Mapping
the steel to component supply chain (Brunt, D,
2000)
Burnt applied value stream mapping in steel manufacturing. A current state map was created for a steel producer showing the activities from hot rolling steel through delivery to the vehicle assembler. The current state map identified huge piles of inventory and long lead time. A future state map with target areas subjecting to different lean tools was developed. The results obtained by implementing the future state map were reduction in 85% of lead time and 6% cycle time reduction.
Even though most of the authors have discussed in detail on the application of lean manufacturing tools in various sectors, the above said authors have concentrated on value stream mapping for implementing lean in different sectors. This aspect of value stream mapping is highly relevant to the present project.
3. METHODOLGY
The purpose of the study is to find ways to reduce lead-times and increase throughput for the component using lean manufacturing techniques.
3.1 Component selection
The component selection was purely based on customer’s order quantity and achieved production quantity of the component (M120 2” 5K gate valve body) with in cell no.2 of the production shop. The required production data were collected both from company’s ERP system and data’s from production personnel. The collected data were then analyzed for present production status and future improvement using lean tools.
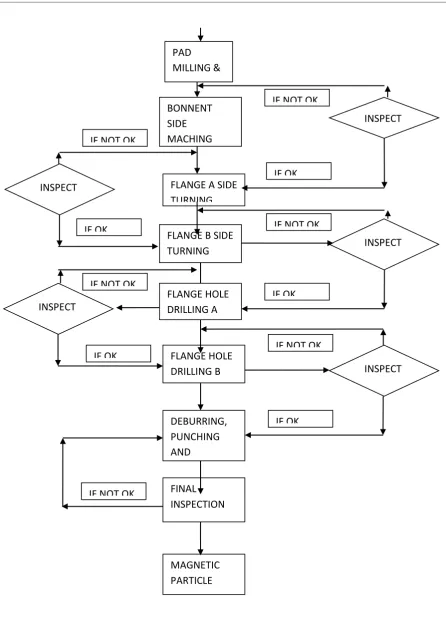
3.2 Process flow study
The study on process flow for the selected component was done by analyzing each step of manufacturing process with an aim to improve industrial operations. This study aids in finding better methods of doing a job by eliminating unproductive and unnecessary elements of the process. The observed process flow for the component is depicted in the flow chart (Fig 3.2)
3.3 Material flow study
© 2016, IRJET | Impact Factor value: 4.45 | ISO 9001:2008 Certified Journal
| Page 414
minimum movements forms the basis of optimum effectiveflow with reduced material handling cost, in-process inventory and space for processing. Thus the study was done to get a clear picture of material flow in existing layout and the value of movement (Fig 3.3)
Chart -1: Order Quantity vs Achieved Quantity
3.4 Cycle time study
A Cycle time study is a structured process of directly observing and measuring human work in order to establish the time required for completion of that work. The recorded cycle times for individual operations shows how well the current operation was carried out in relation to the takt time.
3.5 Overall Equipment Effectiveness (OEE)
OEE is a metric to indicate the current status of a manufacturing process and a tool to understand the effect of the various issues in the manufacturing process that affect
the entire process. OEE provides a framework to track underlying issues and root causes. OEE also provides a framework for improvement in the manufacturing process. 0
100 200 300 400 500 600 700 800 900 1000
Order Qty
© 2016, IRJET | Impact Factor value: 4.45 | ISO 9001:2008 Certified Journal
| Page 415
Fig – 1: Work Flow of the gate valve machining
IF NOT OK
IF OK
DEBURRING,
PUNCHING
AND
FINAL
INSPECTION
MAGNETIC
PARTICLE
INSPECTION
IF NOT OK
IF OK
FLANGE HOLE
DRILLING B
SIDE TURNING
INSPECT
ION
IF NOT OK
IF OK
FLANGE HOLE
DRILLING A
SIDE TURNING
IF OK
INSPECT
ION
IF NOT OK
FLANGE A SIDE
TURNING
PAD
MILLING &
PIN HOLE
BONNENT
SIDE
MACHING
FLANGE B SIDE
TURNING
INSPECT
ION
INSPECT
ION
INSPECT
ION
IF NOT OK
IF NOT OK
© 2016, IRJET | Impact Factor value: 4.45 | ISO 9001:2008 Certified Journal
| Page 417
OEE takes into account the sub components of themanufacturing process the Availability, Performance and the result is expressed as a percentage. This percentage is a snapshot of the current production efficiency for a machine, line or cell
OEE=Availability X Performance X Quality
Availability refers to the machine or cell being available for production when scheduled. By comparing scheduled run time to actual run time, the availability component of OEE allows for a determination of lost production due to down time.
Performance is determined by the waste created through running at less than optimal speed. By comparing the actual cycle time against ideal cycle time, OEE allows for determination of lost production was lost by cycles that did not meet the ideal cycle time.
Quality focuses on identifying time that was wasted by producing a product that does not meet quality standards. By comparing the quantity of accepted parts to rejected parts we can get the percentage of actual value added time for producing good product.
3
.6 Application of waste reduction techniques
3.6.1 Value Stream Mapping
Value stream mapping is a tool to support its associated analysis is depicted. The VSM of a process serves to describe a highly complex real system in a less complex real system in a less complex 2-D format. Value stream mapping two mile stones called current state map and future state map. To achieve this, Microsoft Visio was used to create current state map
3.6.2 Takt time calculation
A very important principle of waste elimination is the standardization of worker actions. Standardization work basically ensures that each job is organized and is carried out in the most effective manner with same level of quality being achieved. Every worker follows the same processing steps all the time and this includes the time needed to finish a job, the order of steps to follow for each job and the parts on hand. By doing this one ensures that line balancing is achieved unwarranted work-in- process inventory is minimized and non value added activities are reduced.
A tool used to standardize work is called “takt time”. Takt time refers how often a part should be produced in a product family based on the actual customer demand. The target is produced at a pace not higher than the takt time (Mid-America Manufacturing Technology Center to press release, 2000). Takt time is calculated based on the following formula [Feld, (2000)].
Takt Time (TT)= Available Work Time per Day
Customer Demand per Day
3.6.3 Machine layout configuration (Cellular
Manufacturing)
Cellular manufacturing is one of the milestones when one wants to become lean. A cell consist of equipment and workstations that are arranged in an order that it maintains a smooth flow of materials and components through the process. It also has assigned operators qualified and trained to work at that cell. One advantage of cell is the one-piece flow concept, which states that each product moves through the process one unit at a time without sudden interruption, at a pace determined by the customer’s need. Extending the product mix is another advantage of cellular manufacturing. Certain other benefits associated with cellular manufacturing includes,
Inventory reduction
Reduced transport and material handling
Better space utilization
Lead time reduction
Identification of causes of defects and machine problem
Improved productivity
Enhanced teamwork and communication
3.6.4 Line balancing
Line balancing is considered a great wepon against especially the wasted time of workers. The idea is to make every workstation produce the right volume of work that is sent to upstream workstation without any stoppage (MMTC press release, 2000). Line balancing will guarantee that each workstation is working in a synchronized manner.
3.6.5 5S (Kaizen)
© 2016, IRJET | Impact Factor value: 4.45 | ISO 9001:2008 Certified Journal
| Page 418
a paramount concept behind good management. Kaizen isa systematic approach to gradual, orderly and continuous improvement. In manufacturing settings improvement can take place in many forms such as reduction of inventory, and reduction of defective parts. One of the most effective tools of continuous improvement is 5S.
5S is the basis for an effective lean company. 5S is a first, modular step towards serious waste reduction. 5S mean good housekeeping and better workplace organization. 5S consists of,
Seiri (Sort)
Seiton (Straighten)
Seiso (Sweep and Clean)
Seiketsu (Systemize) and
Shitsuke (Standardize)
The underlying concept behind 5S is to look for waste and then to try to eliminate it. Waste could be in the form of scrap, defects, excess raw material unneeded items, old broken tools, and obsolete jigs and fixtures [Monden, (1998)].
Seiri deals with moving those items that are not currently being used on a continuous basis (e.g., items that will not be used for the next month or so) away from those that are. Moving those items and tossing away needless items will make material flow smoothly, and workers move and work easily [Feld, (2000)].
Seiton has to do with having the right items in the right area. Items that do not belong to a given area must not be in that area. For a given workplace area tools must be marked and arranged as belonging in that area. This will make it the right place will make tools, jigs, fixtures and resources noticeable, detectable, and easy to use [Feld, (2000)].
Seiso deals with cleaning and sweeping the work place methodically. The workplace should look neat and clean and ready to use for the next shift. The workplace should be maintained on a regular basis. All tools and items should be in the right place and nothing should be missing. A well maintained workplace creates a healthy environment to work with [Feld, (2000)].
Seiketsu is maintaining a high standard of housekeeping and workplace arrangement. A regular audit should be run and scores should be assigned to it then everyone has responsibility to maintain a high standard of housekeeping and cleaning [Feld, (2000)].
Shitsuke is management’s accountability to rain people follow housekeeping rules. Management should implement the housekeeping rules in a practiced fashion so that their people can buy into it. Management should walk the shop floor, explain what they want from people, reward those who follow and instruct those who don’t [Feld, (2000)].
3.6.6 Ergonomics
It is an engineering parallel to field generally reffered to as either industrial psychology or experimental psychology. The design of human-machine system involves determining the best combination of human and machine elements for maximum output from labor resulting in increased production.
4. RESULTS AND DISCUSSION
Reduced lead times will help the company and expand its customer base while increased throughput will help get more products out of the door existing and new products. Batch processing and departmentalized machines are key contributors to long lead times. Value stream mapping was used to help identify areas of potential improvement to reduce lead times and increase throughput.
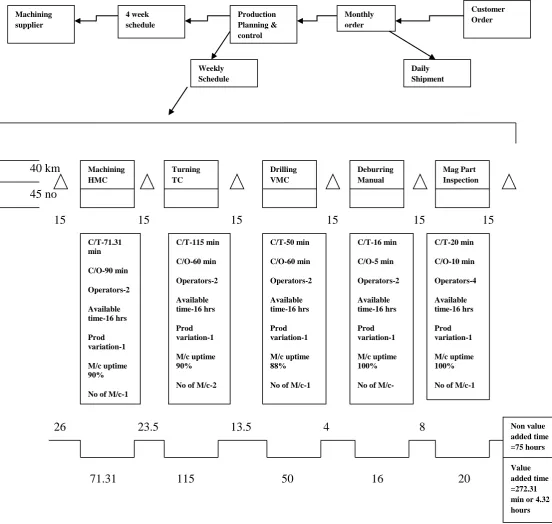
Production data was gathered using company’s ERP system and by observation made on the shop floor. The gathered information was used to construct a current state value stream map (Fig 4.1) that shows the flow of information and material for the components.
The data was analyzed to determine areas of improvement and lean manufacturing techniques were suggested to lower lead time and increase throughput
.
4.1 Analysis of current state value stream
© 2016, IRJET | Impact Factor value: 4.45 | ISO 9001:2008 Certified Journal
| Page 419
with an inefficient use of flow space as pallets of productswere waiting for the next process.
The arrows extending from production planning and control to each individual process represents information
flow. The current production method scheduling is communicated to each process on weekly basis for daily shipment.
mmnn
40 km
45 no
15 15 15 15 15 15
26 23.5 13.5 4 8
[image:9.595.6.559.195.719.2]71.31 115 50 16 20
Fig –3: Current Stream Mapping
C/T-71.31 min C/O-90 min Operators-2 Available time-16 hrs Prod variation-1 M/c uptime 90%
No of M/c-1
C/T-115 min C/O-60 min Operators-2 Available time-16 hrs Prod variation-1 M/c uptime 90%
No of M/c-2
C/T-50 min C/O-60 min Operators-2 Available time-16 hrs Prod variation-1 M/c uptime 88%
No of M/c-1
C/T-16 min C/O-5 min Operators-2 Available time-16 hrs Prod variation-1 M/c uptime 100%
No of
M/c-C/T-20 min C/O-10 min Operators-4 Available time-16 hrs Prod variation-1 M/c uptime 100%
© 2016, IRJET | Impact Factor value: 4.45 | ISO 9001:2008 Certified Journal
| Page 420
4.2 Future state value stream map
A future state value stream map was created to suggest solution for reducing lead time and increasing throughput. The future state map utilizes the lean manufacturing techniques.
To standardize work, primarily takt time was calculated based on the ratio of customer demand per day to available work time per day.
Takt time (TT)= 920 min/17.8 Nos.= 52 min
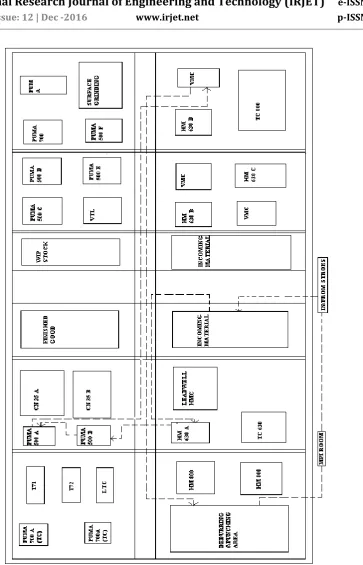
The existing machine layout is a process layout (Fig 4.2). To achieve a smooth flow of materials and components through the process, at a pace determined by the
customer’s need, the existing layout is reconfigured based on overall equipment effectiveness to a product layout (Fig 4.3) with machines physically located close by and arranged to form a cell in order to facilitate a smooth uninterrupted
flow.
Fig-4: Existing Machine Layout
PUMA 500 A
PUMA 500 B
CN 35 A
CN 35 B
HM 630 A
TC 630
LEADWELL
© 2016, IRJET | Impact Factor value: 4.45 | ISO 9001:2008 Certified Journal
| Page 421
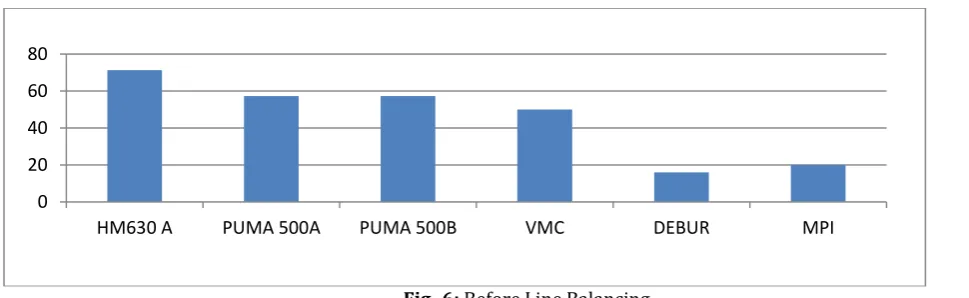
Fig -5 :Proposed machine LayoutIn the proposed layout the distance traveled by the material for processing is reduced by 35%. The existing
[image:11.595.79.545.108.499.2]cycle time at each work station is more than the calculated takt time of 52 min (Fig 4.4).
Fig -6: Before Line Balancing 0
20 40 60 80
HM630 A PUMA 500A PUMA 500B VMC DEBUR MPI
PUMA 500 A
PUMA 500 B
CN 35 A
CN 35 B
HM 630 A
TC 630
LEADWELL
HMC
DEBUR
TABLE
INSPECTION
TABLE
CN 35 B
DEBUR
TABLE
[image:11.595.34.519.602.751.2]© 2016, IRJET | Impact Factor value: 4.45 | ISO 9001:2008 Certified Journal
| Page 422
The concept of line balancing is applied by combining andreassigning work elements to reduce non value added time and achieve equal cycle time (Fig 4.5). By reallocation
of work elements, the amount of work to customer is done
in a balanced fashion
.
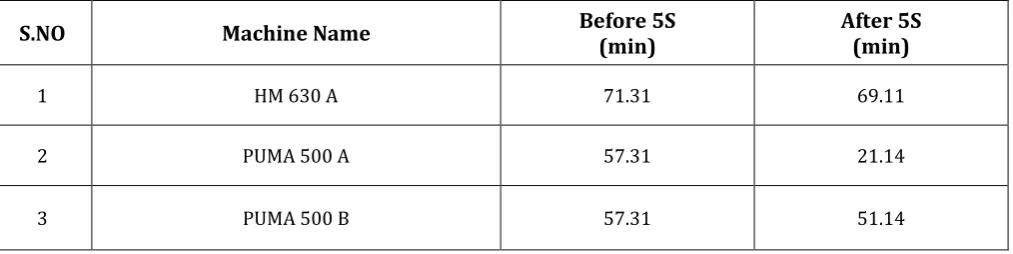
Fig -7: After Line Balancing The recommended 5S activities ensure reduction in cycle
[image:12.595.36.520.113.302.2]time by eliminating waste of waiting and unnecessary movement
Table-1: Cycle time reduction by 5S
S.NO
Machine Name
Before 5S
(min)
After 5S
(min)
1 HM 630 A 71.31 69.11
2 PUMA 500 A 57.31 21.14
3 PUMA 500 B 57.31 51.14
Deburring operation is carried out at ground level forcing the operator to bend forward over a long period of time; this causes the operator to work less efficient possibly leading to defects. To increase operator comfort and output, a deburring fixture is recommended.
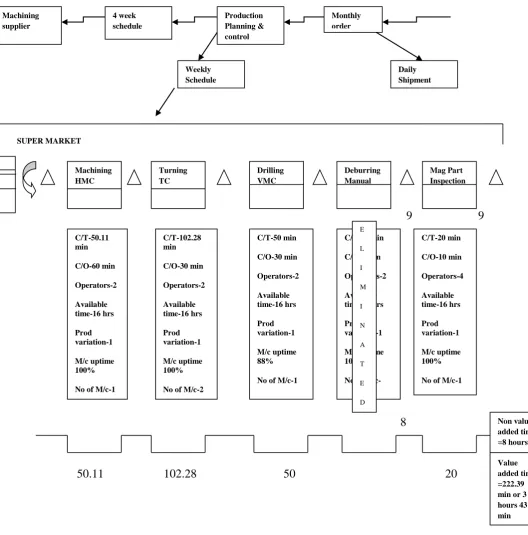
Overall results of the future state value stream map
The future state value map created (Fig 4.6) suggests that lead times can be reduced greatly. The current non value added time is 75 hours. Using one piece flow combined with manufacturing cells the waiting time that a product spends in queue can greatly be reduced. From future state value stream map non value added time can be reduced to 8 hours, a 89.44% reduction in non value added time
3.125 days X 15.33 hours available per day = 47.90 hours
0.333 days X 15.33 hours available per day = 5.06 hours
% reduction = 1- (5.06/47.90) X 100
= 89.44%
With the addition of 5S and process standardization, overall current cycle time can be reduced from 4 hours 32 min to 4 hours 3 min. supermarket inventory system connected to downstream processes with material pull at start of process ensures material pull at start conclusion, a 75.23% throughput gain can be achieved by improvement suggested by the future state value stream map.
0 10 20 30 40 50 60
[image:12.595.34.541.400.527.2]© 2016, IRJET | Impact Factor value: 4.45 | ISO 9001:2008 Certified Journal
| Page 423
mmnn
SUPER MARKET
9 9
8
[image:13.595.19.548.144.680.2]50.11 102.28 50 20
Fig –8: Future State Mapping
C/T-50.11 min C/O-60 min Operators-2 Available time-16 hrs Prod variation-1 M/c uptime 100%
No of M/c-1
C/T-102.28 min C/O-30 min Operators-2 Available time-16 hrs Prod variation-1 M/c uptime 100%
No of M/c-2
C/T-50 min C/O-30 min Operators-2 Available time-16 hrs Prod variation-1 M/c uptime 88%
No of M/c-1
C/T-16 min C/O-5 min Operators-2 Available time-16 hrs Prod variation-1 M/c uptime 100%
No of
M/c-C/T-20 min C/O-10 min Operators-4 Available time-16 hrs Prod variation-1 M/c uptime 100%
© 2016, IRJET | Impact Factor value: 4.45 | ISO 9001:2008 Certified Journal
| Page 424
5. CONCLUSION
The purpose of this study is to suggest ways to reduce lead time and increase throughput of a high pressure gate valve production line through the use of value stream map. A current state value stream map was created and analyzed for potential areas of improvement. Lean manufacturing techniques were used to create a future state value stream map suggests that a better lead-time reduction through elimination of batch production and an increase in throughput
The current state value stream value map shows that most of the waste in the process contributes to long lead-time in the form of non value added time while the product waits in queue. Large reduction in lead times can be achieved by reducing the product waiting time. In the future state value stream map, machines were rearranged and layout was changed to allow the product to flow more smoothly through the manufacturing process. Through the use of line balancing, 5S and ergonomics the highest throughput potential of the manufacturing system can be achieved.
Value stream map has proven be an excellent tool to analyze a manufacturing process. The current state value stream map helped to identify areas of potential improvement while the future state value stream map suggested ways to reduced lead times and increase throughput. The value stream map could be deployed to other production lines to achieve an increased value added production.
6. REFERENCE
1. Vijaya Ramnath, B., etal., 2009. Impact of lean manufacturing on improving productivity of auto components manufacturing industry. Manufacturing Technology Today, Vol.8, pp.20-26.
2. Valerie Maier – speredelozzi, etal., 2008. Integrating industrial engineering and lean techniques at a contract pharmaceutical manufacturer. The official magazine of ISPE, Vol.28, pp. 1-10.
3. Jaun sillero perez, 2007. Redesign the value added chain of a service process in commercialization steel firm at Monterrey,Mexico. International conference on engineering education & research, pp. 1-5.
4. Farouk etal., 2004. A lean manufacturing educational model: Flexible low-cost linking of manufacturing planning to customer requirements. Proceedings of the 2004 ASE annual conference & exposition.
5. Hugh L. McManus, Richard L. Millard, 2002. Value stream analysis and mapping for product development. Proceedings of the ICAS, pp. 1-10.