Journal of Chemical and Pharmaceutical Research, 2014, 6(8):130-134
Research Article
CODEN(USA) : JCPRC5
ISSN : 0975-7384
Study on utilization of lactic acid for the decalcifying of the shrimp
head and shell
Hong Wang
1, Jianfeng Sun
1,2*and Jie Wang
1,21College of Food Science and Technology, Agricultural University of Hebei, Baoding, China 2
Engeineering Technology Research Center for Processing of Agricultural Products, Hebei Province, Baoding, China
_____________________________________________________________________________________________
ABSTRACT
In this study, lactic acid was used to extract chitin by decalcifying shrimp heads and shells of penaeus vanmamei with ultrasonic -assisted. A Box–Behnken design with three variables and three levels was applied in order to approach the prediction of optimal the lactic acid concentration, the liquid-solid ratio and the reaction time on the demineralization degree with lactic acid. These optimal conditional were: with the ultrasonic assisted, the lactic acid concentration of 11.50%, the liquid-solid ratio of 26:1(mL/g ),and the reaction time of 95 min allowing to obtain chitin, which ash content was predicted at 0.35±0.05(g/100g), and the chitin would be used in the food industry.
Keywords: shrimp waste; lactic acid; chitin; decalcification.
_____________________________________________________________________________________________
INTRODUCTION
Chitin ,the second largest renewable next to cellulose resources, it mainly exists in the arthropods ,such as shrimp、 crab shell、the cell walls of fungi and algae. Chitin and its derivatives have many advantages, which are widely used in the food industry, functional materials, medicine, agriculture and textile industry[1,2], they become a research focus in the processing of aquatic products waste. Production technology of chitin mainly include acid and alkali method[3,4], enzymatic[5-7], fermentation[8,9], EDTA, etc.These methods all have their own different faults and shortcomings, such as acid-base method and EDTA can produce amounts of acid and alkali waste water, it made large pollution to environment;Enzymatic was cleaner, it made less pollution to the environment, but the cost of production was high,Fermentation disadvantage was that the production cycle was long.Ultrasonic extraction is a new extraction technology for scientific research [10], use ultrasonic cavitation effect, thermal effect and mechanical effect, which can make cell wall and the entire organism instantaneously rupture, speed up the release of substances in the cell, diffusion and dissolution to improve the efficiency of the extraction of effective components.In view of the many advantages of ultrasonic, and considering that the decalcified of microorganism fermentation was used microbes produce lactic acid to consume inorganic substances in the fermentation process.This study directly took lactic acid as decalcification reagent, sodium hydroxide as deproteinization reagent, to explore the optimal conditions of ultrasonic assisted extract chitin .
EXPERIMENTAL SECTION
pre-treatment :shrimp meats were removed ,the residual wastes (hesds,shrimp-shell,tails,etc) and washed
thoroughly with tap water , and finally frozen at -18 for later use.
Deproteinization:mixed with sodium hydroxide solution at a ratio of 1:3(w/v), the concentration of sodium hydroxide was 1.5mol/L.Firstly,ultrasound for 30 min, secondly,put it in the 55 degrees of water bath oscillator ,model Jieruier THZ -82(Changzhou,China), oscillation for 90 min, filtered, rinsed solid heads and shells to neutral , dried , then crushed,set aside.
Decalcification:In order to better remove the calcium from shrimp wastes,the water-bath oscillator was chosen and
the mixture was processed by an ultrasonic cleaning instrument,model Kudos SK5200H(Shanghai,China )for good contact between the suspended solids and the liquid in extraction experiment.
Use ultrasonic- assisted lactic acid soaked the processed shrimp wastes to remove calcium, filtered , dried ,then obtained coarse chitin.
Took the processed shrimp waste 1g into 100mL conical flask,added lactic acid (20-30mL),first mixed the liquid by ultrasound (59Hz)for 10min,then placed in a water-bath oscillator (200r/min),selected three time points (50-110min),three lactic acid concentration points(8%-12%),then filtered,last,the ash content of chitin was measured with calcinations method.
The determination of ash content:The indexes of Chitin grade were appearance, water content, nitrogen content and ash content, but the ash content was an indicator to evaluate the removed calcium degree of shrimp waste.
The determination of ash content refer to the national standard of China :The determination of ash content in foods.
Box – Behnken design: According to the results of single factor experiments, select three factors of lactic acid concentration, liquid-solid ratio and reaction time, use Box-Behnken design scheme of response surface of three factors and three levels to analysis.Factor levels and coding are shown in table 1.
Table1 Level and code of variables for box-behnken design
Variables
Symbols Coded levels -1 0 +1 Lactic acid concentration (%) X1 8 10 12 The liquid-solid ratio(mL/g) X2 20:1 25:1 30:1 The reaction time (min) X3 50 80 110
Table 2:Box-Bchnken design and experimental results
Number X1 X2 X3 Ash content 1 2 3 4 5 6 7 8 9 10 11 12 13 14 15 16 17 0 0 1 -1 -1 1 0 0 0 -1 1 0 1 0 0 -1 0 1 -1 0 0 0 -1 0 0 1 1 1 0 0 0 -1 -1 0 -1 -1 1 -1 1 0 0 0 1 0 0 0 -1 0 1 0 0 1.08 1.19 0.4 1.22 1.18 0.99 0.47 0.47 0.74 1.38 0.66 0.49 0.68 0.45 1.16 1.51 0.47
RESULTS AND DISCUSSION
The regression equation of Chitin ash content (R1) on the lactic acid concentration(x 1), the liquid-solid ratio (x 2)
and the reaction time (x 3) is
R=0.47-0.32x1-0.12x2-0.086x3-0.050x1x2-0.0060x1x3-0.078x2x3+0.25x12+0.42x22+0.15x32
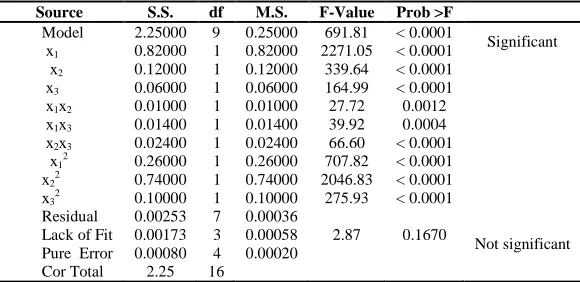
It can be seen from Table 3 that The Model F-value of 691.81 implied the model was significant.Value of “Prob>F”was “<0.0500”,indicating model terms were significant. The impact of the concentration,、time、 and solid-liquid ratio on chitin ash content was extremely significant (P < 0.01).In this case x1,x2,x3,x12,x22,x32,x1x2,x1x3,x2x3 were extremely significant model terns .
[image:3.595.162.452.293.434.2]Lack of fit is used to assess the reliability of an equation,if equation modeling shows significant,it needs to be adjusted ,if not ,it can be good for date analysis in future .The “Lack of Fit F-value “ of 2.87 implied the Lack of Fit was not signficant relative to the pure error (p>0.05).Non-signficant lack of fit was good. R-Squared was 0.9989, indicating areasonable fit of the model to the experimental data.The "Pred R-Squared" of 0.9872 was in reasonable agreement with the "Adj R-Squared" of 0.9974.Therefore, the model adequately represented the real relationship between the parameters chosen.
Table 3 Analysis of variance (ANOVA) for response surface quadratic model for the extracted chitin
Source S.S. df M.S. F-Value Prob >F
Model x1
x2
x3
x1x2
x1x3
x2x3
x12
x22
x32
Residual Lack of Fit Pure Error Cor Total 2.25000 0.82000 0.12000 0.06000 0.01000 0.01400 0.02400 0.26000 0.74000 0.10000 0.00253 0.00173 0.00080 2.25 9 1 1 1 1 1 1 1 1 1 7 3 4 16 0.25000 0.82000 0.12000 0.06000 0.01000 0.01400 0.02400 0.26000 0.74000 0.10000 0.00036 0.00058 0.00020 691.81 2271.05 339.64 164.99 27.72 39.92 66.60 707.82 2046.83 275.93 2.87 < 0.0001 < 0.0001 < 0.0001 < 0.0001 0.0012 0.0004 < 0.0001 < 0.0001 < 0.0001 < 0.0001 0.1670 Significant Not significant
R2:0.9989 ;AdjR
2:0.9974; Pred.R2:0.9872; S.S.:Sum of square; M.S.:Mean square
Figure 1(a) shows that in low concentration of lactic acid , chitin ash content was not reduced with the increased of the liquid-solid ratio, it may be because that lactic acid content was less, this was not good decalcified from the shrimp waste;when lactic acid concentration was higher, with the increased of liquid-solid ratio, the chitin ash content reduced and tended to a constant value.when the liquid ratio was constant, with the lactic acid concentration increased gradually ,ash content of chitin reduced and tended to a constant value.
From figure 1(b), when the time was content, with the increased of lactic acid concentration, chitin ash content reduced gradually.But when lactic acid concentration was constant,with the time changed, chitin ash content had two kinds of tendency ,this change depends on the lactic acid concentration.When lactic acid content was low, with time prolong,chitin gradually increased and reached a constant value.And when lactic acid content was higher than a certain value, the chitin ash content would gradually decrease with time prolong and reached a constant value.It related to the properties of calcium lactate .When it dissolved in hot water changed into a transparent or slightly turbid solution ,and it can dissolve in acid solution.When lactic acid concentration was low, As reaction going , the solution of lactic acid gradually reduced, eventually led to the solution pH value increase and make the precipitation of calcium lactate adsorption on chitin, so it make the product ash content increased.When lactic acid concentration was high, the solution has been present acid, and calcium lactate no precipitation occurred,so ash content decreased gradually over time.
(a)
(b)
(c)
Fig.1:Surface plots for ash content of chitin.(a)figure plot to show the combination of lactic acid concentration and liquid-solid ratio;(b)figure plot to show the combination of lactic acid concentration and reaction time;(c) figure plot to show the combination of the
liquid-solid ratio and reaction time
Validation of the model:The repeat experiments were conducted under optimal conditions for verification of
optimization (lactic acid concentration of 11.50% and liquid –solid ratio of 26:1, the reaction time of 95 min).Combined with the actual production,there might be slight variation in experimental conditions,the minimum ash content was obtained at 0.35±0.05(g/100g) .This value was found to be in agreement with the predicted value.This model can better predict the actual situation of the ash content of chitin.
CONCLUSION
Acknowledgement
This work was supported by grants from Science and Technology Project of Hebei Province, China (No.14273205D). The authors declare that they have no competing financial interests.
REFERENCES
[1]S Jiang; Y Shi;QZ Zhu , University chemistry,2011,26(4),45-48.
[2]Ashish Dev;Jithin C;Sreeja V,et al. Carbohydrate polymers,2010,79(4),1073-1079. [3]YB Tang;J Xie,Food Science,2012,33(10),6-9.
[4] Rokshana Naznin Pakistan,J. of Biological Sciences ,2005 ,8(7),1051-1054.
[5]T LI;YX Cheng;JC Chen;S Duan, Academic Periodical of Farm Products Processing, 2014(2),1-7. [6]Y Wang;FM Deng;Y Liu;Q Liao;WQ Liu,Food Science,2013, 34(12 ),1-5.
[7]OlfaGhorbel-Bellaaja,Sawssen Hajjia,Islem Younesa,Moncef Chaabounib,Moncef Nasria,Kemel ellouli ,
International J. of Biological Macromolecules,2013( 61 ),243–250.
[8]Wassila Arbia, Leila Arbia, Lydia Adour,and Abdeltif Amrane, Food Technol. Biotechnol,2013,51 (1), 12–25. [9]QLXu;QZ Zeng,China Food Additives,2013( 6),104-109.