A Hybrid Approach for Recommendation System in Web
Graph Mining
Priyanka U. Chavan
MET’s Institute of EngineeringNashik, University of Pune, Maharashtra, India
P. M. Yawalkar
MET’s Institute of EngineeringNashik, University of Pune, Maharashtra, India
D. V. Patil
MET’s Institute of Engineering Nashik, University of Pune,
Maharashtra, India
ABSTRACT
Large amount of information is available on web and information extraction takes place in huge volume. When queries are submitted to search engines they are generally in natural languages and contain just one or two words. Search engine are unable to recognize natural language and thus it becomes difficult to extract the proper information from web according to user’s interest. Here, the recommendation technique comes into picture. There are number of recommendation techniques, every technique has its advantages and disadvantages. Recommendation techniques are designed in such a way that they support various type or data sources. These data sources are in the form of text, images, audio, video etc. Efficient way to deal with all types of data sources is, model them in the form of graph and then apply recommendation algorithm on it. Initially the proposed system collects data from user’s and graphs are constructed by using this data. Subsequently the system uses different algorithms for predicting user’s interest. The algorithms are item to item base collaborative filtering algorithm, Pearson correlation base collaborative filtering algorithm. These are applied for finding similarities between item and users respectively. Slope one algorithm is used to find out the rating of un-rated items. In proposed hybrid method results of these algorithms are combined. The hybridization of Algorithms leads to efficient results.
Keywords
Recommendation system, Web mining, web graph, personalization feature.
1.
INTRODUCTION
Web mining is technique which extracts interesting pattern from the web. Web mining is divided into three types namely, content mining, structure mining and usage mining. Content mining is a process of text extraction it mainly focuses on unstructured data. Web structure mining extracts data from hyperlinks; it just extracts the summary of the web pages. Web usage mining extracts the data from log files in the form of patterns. But data available on web is huge in size and extracting interesting information from such a data is very difficult task, in addition such data is in heterogeneous form and processing this type of data is time consuming task. Thus there is need of recommendation techniques which solves all these compatibility problems. Generally recommendation is carried out by giving queries to search engine .There are some problems related to queries. Sometimes queries are in one or two words and hence it is difficult to find semantically relevant data. Results returned by these queries are based on the ranking given to the pages and it may not contain data related to user’s interest. In addition to this problem, search engines may not take into account the personalization
features, means they do not focus on the historical data i.e. previously access data by that user representing users interest and according to that give the relevant results to the user. Generally for solving these problems different algorithms are used but there is need of one generalized method which can solve all these problems. Designing such generalize method is very difficult task, since data available on the web is in heterogeneous format.
2.
LITERATURE SURVEY
canonical images without clustering. In this for feature selection wc-tf-idf method is used. Content based filtering [8] selects items depending on the relation between item and users preferences. This method is based on the user’s previous rating preferences. Suppose there is a set of items to be recommended to user then this data is compared with item which are preferred by that user previously and comparing those best suited items are recommended to the user. For providing best results users profiles are created. User profile contains the information about the items which are preferred by that user. Sometimes item profiles are also created which contain the information regarding the rating, features of that item. The data for creating user and item profile is collected by taking the feedback from the user for different items. This system does not provide good recommendation if rated data or feedback does not contain enough information about that item
3.
RANKING METHODS
In this section various ranking method are explained
3.1
Item-based Collaborative Filtering
Item-based collaborative filtering [1] is a model-based algorithm which is used for recommendation. This algorithm is used for determining how similar two items are. This similarity value is used for recommending similar type of product to user according to his interest in that type of item. To find out the similarity vector based similarity measure is used which gives the value in the form of direction of two vectors in n dimensional space which is explained in following section. The given Input is rating given by different users to item. Keep record for every item Ii andIi+1in item catalogue, for each user U who purchased Ii as well as Ii+1.Calculate the similarity between Ii and Ii+1. The Output is Similarity between two items.
Cosine base similarity Measurements: As vector-based similarity, for these two items and their ratings are consider as vectors and angle between these vectors represents the similarity between items. If these vectors point in same directions it means they are more similar to each other if they point in opposite directions means they are less similar to each other. This similarity value is also known as cosine base similarity. Its formulation is shown in equation (1)
2 2*
)
,
cos(
)
,
(
j i
j i
j
i
j
i
sim
(1)
3.2
Pearson correlation coefficient based
collaborative filtering
This approach [11] evolves relationship between users. Active user’s preferences are compared with other user. Similarity between users is calculated as follows. Input is rating given by different user to different items. Keep record for every user UiandUi+1in user catalogue, for each product P purchased Ui as well asUi+1.Calculate the similarity between UiandUi+1.The output is Similarity between two users.
Pearson correlation coefficient base similarity measurement: The Pearson correlation coefficient is the basic correlation formula for samples adapted for rating information. It tries to measure how much two users vary together from their normal votes that is, the direction/magnitude of each is vote in comparison to their voting average. If they vary in the same way on the items they have rated in common, they will get a positive correlation; otherwise, they will get a negative correlation. It is calculated
by using equation (2). Here x and y are rating values given by different users an n means no of common item rated by that users.
2 2 2 2
(
)
(
)(
)
(
)
(
)
n
xy
x
y
r
n
x
x
n
y
y
(2)
3.3
Slope One Rating Prediction
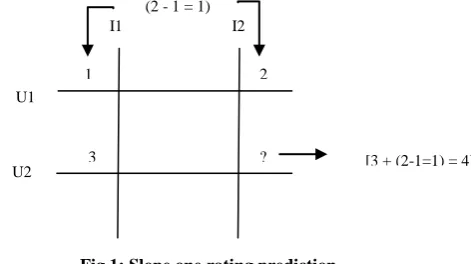
[image:2.595.324.560.209.341.2]This is the rating based collaborative filtering technique [12]. This technique finds out rating of un-rated items by using the rating of other user as follows.
Fig 1: Slope one rating prediction
It considers two items and two users at time to predict the rating of unrated items, if number of user’s are greater than two, then it finds out rating prediction value with all other user who have rated both item and take average of that values to find out final rating prediction value. Consider a simple example as follows, suppose there are two user U1, U2 and item I1, I2. If user U1 gave rating 1 to item I1 and 2 to I2, user U2 gave rating 3 to I1 Then by using slope one algorithm U2 may give rating to item I2 is 4 which is explained in Fig 1.
4.
PRPOPOSED SYSTEM
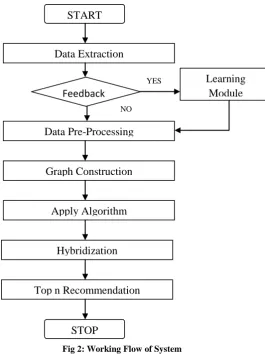
The proposed system works in multiple stages, Fig. 2 shows the working of proposed system. The stages include data extraction, pre-processing of data, graph construction, applying various algorithms, applying hybrid approach and recommendation of items.
Data extraction: The first step in proposed system is data set extraction. Click-through data records the activities of web users; it collects the information related to interest of user, the semantic relationships between users, queries and clicked web documents. A dataset specifies queries and metadata related to queries. Every line of click-through data contains: a user ID, a query issued by the user, a URL on which the user clicked, the rank of that URL, and the time at which the query was submitted for search.
Data Pre-Processing: Data set is the raw data recorded by the search engine, and contains a lot of noise which will affect the effectiveness of the query suggestion algorithm. This module keeps frequent well formatted data. In pre-processing method there is need of removing the noisy data from the dataset, some of the methods are stemming of words, tag elimination, splitting words and stop words. Stemming is to create a term that projects the common meaning behinds the words for e.g. computation, compute, and computer. Tag Elimination is designed to removing unnecessary tagging and un-tagging operation from automatically generated programs. Split word is used to split the paragraph into word and this word is used for next pre-processing methods. Stop word is used to filter out articles, prepositions, conjunctions and pronouns words
U1
U2
I1 I2
1 2
that occur in the document. Such words have no values for retrieval purpose.
Graph Construction: Pre-processed data is given to the graph [9]-[10] construction algorithm. This technique handles this data effectively, as it gives logical relationship between objects. Modeling the web in the form of graph makes it easy to manipulate this huge data. For modeling this data in form of graph it requires to connect node and edges. Web graph connect these nodes to edges having direction. Web page and hyperlink are the component of the graph. Web pages are the documents on the web which act as resources for the search engines. Each web page contains textual data as content or the hyperlinks which are connecting other web pages. Each web page has unique URL and they are accessed by the web browser. Hyperlink is the reference of another place in the same document or another web page. It is used for navigation purpose from one web page to another. Here, the web pages are act as nodes of the graph and hyperlink act as edge between the nodes. Due to this graph the efficiency of the algorithm increases because instead of taking whole data set for processing graphs and there sub-graphs are created. Apply further algorithms on sub-graph; it takes lesser time for execution.
Algorithms: After constructing graphs algorithms are applied on it to find out top n recommendation. Item based collaborative filtering algorithm, Pearson correlation base collaborative filtering algorithm are applied for finding similarities between item and users respectively. Slope one algorithm is used to find out the rating of un-rated items.
[image:3.595.306.572.71.426.2]Hybridization: The hybrid approach works as follows. Similarities between different items are obtained using item to item collaborative filtering algorithm, items having similarity value greater than some threshold are considered for recommendation. Slope one algorithm predict the rating score of unrated item out of which those item having score greater than some pre-define value are consider for recommendation. Thus two methods in combination are used for efficient recommendation. As next stage of this hybridization, similarities between users are calculated by using person correlation filtering method. This similarity value represents the similar interest of user. Users having similar interest are considered and the items selected for recommendation in previous stage of hybridization are recommended to users in which both users have interest.
Fig 2: Working Flow of System
5.
METHOD OF EXPERIMENT AND
RESULTS
For experimentation a sample data set is created by considering 5 user volunteers (U1toU5) rating to 4 items I1 to I4 on the scale of 1to 5 and 0 as unrated. The proposed system has been implemented using Java in eclipse environment. It can be executed on windows or Linux platform. The results are obtained as follows after applying Pearson correlation coefficient algorithm and item to item collaborative filtering algorithm. Sample data set is presented in Table 1.
Table 1. Data presenting Users Rating for Different Items Ii represents Items and Uj represents Users
I1 I2 I3 I4
U1 3 4 0 1
U2 2 3 2 4
U3 0 2 3 5
U4 1 4 4 5
U5 5 4 0 2
Slope one algorithm: Here, Slope one algorithm predicts the rating of unrated. It considers two items and two users at time to predict the rating of unrated items, if number of user’s are greater than two, then it finds out rating prediction value with all other user who have rated both item and take average of that values to find out final rating prediction value. Result
START
Data Extraction
Top n Recommendation
Data Pre-Processing
Graph Construction
Apply Algorithm
Hybridization
Learning
Module
STOP
Feedback
YES
[image:3.595.311.549.600.702.2]after applying slope one algorithm on sample data are represented in Table 2.
Table 2. Predicted Rating Values after Applying Slope One Algorithm are highlighted, Ii represents Items
and Uj represents Users
I1 I2 I3 I4
U1 3 4 5 1
U2 2 3 2 4
U3 3 2 3 5
U4 1 4 4 5
U5 5 4 5 2
[image:4.595.50.289.95.240.2]Pearson Correlation Coefficient: Here, two users are compared with each other. To find out the relationship between them Pearson correlation coefficient formula is used. Values of correlation factor decide how these users are similar to each other. Here, threshold value set is 0.60. User having similarity greater than 0.60 are considered as similar users. In Table 3 U2 and U3 have similarity value 0.87 means they are much more similar to each other. Hence, items which are recommended to U2 according to his/her interest can also be recommended to user U3.
Table 3. Similarity between Different Users is Determine by Pearson Correlation Cofactor
User_id U1 U2 U3 U4 U5
U1 0.00 0.27 0.42 0.42 0.91
U2 0.27 0.00 0.87 0.87 0.54
U3 0.21 0.87 0.00 0.60 0.40
U4 0.42 0.87 0.60 0.00 0.32
U5 0.91 0.54 0.40 0.32 0.00
Cosine Similarity: Here, items are compared with each other. Relationship between these items is found by using cosine based similarity formula. Here threshold value is set as 0.95. Hence, those items which have cosine similarity value above threshold value are similar to each other. Table 4 presents results for cosine similarity.
Hybrid Recommendations: Using cosine similarity method similar data items are I2 and I3. Similar users set by determined using Pearson correlation factor are {U1, U5}, {U2, U3} and, {U2, U4}. It can be observed that I2 is rated as 4 by U1 thus I2, I3 are Recommended to similar user U5.Similar cases are presented in Table 5.
[image:4.595.309.549.96.183.2]The proposed system applies Slope one algorithm and predicts rating of unrated items. Item based collaborative filtering algorithm determines the relationship between items similarly content based filtering algorithm determines the relationship between users. The proposed hybrid method combines results of these algorithms and determines the interest of users.
Table 4. Similarity between Different Items after applying Cosine Similarity algorithm
Iten_id I1 I2 I3 I4
I1 1.00 0.88 0.92 0.76
I2 0.88 1.00 0.97 0.92
I3 0.92 0.97 1.00 0.94
[image:4.595.310.548.219.292.2]I4 0.76 0.92 0.94 1.00
Table 5. Results after Applying Hybrid Recommendation Algorithm
Iten_id Rated By
Recommended To
Recommended Item
I2 U1 U5 I2, I3
I3 U5 U1 I3, I2
I2 U4 U2 I2 ,I3
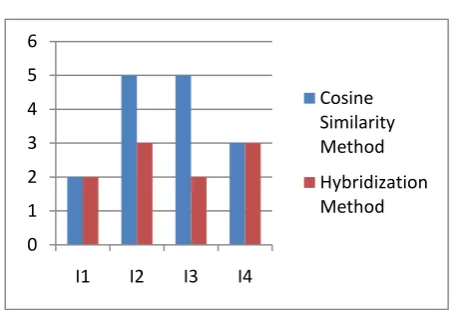
Chart 1. Items Recommended to Number of User
0 1 2 3 4 5 6
I1 I2 I3 I4
Cosine Similarity Method
Hybridization Method
In above chart X axis represents different items to be recommended and Y axis represents number of users. The proposed hybrid method calculates similarity between different users using Pearson Correlation cofactor; in addition it uses cosine similarity measure to find out similarity between different items. Thus hybrid method is more accurate as compared to cosine similarity measure. It is observed that number of recommendations using hybrid method are less as compared to cosine similarity method, but as discussed earlier though number of recommendation are less accuracy of recommendation is high using proposed hybrid approach.
6.
CONCLUSION
[image:4.595.317.544.318.473.2]number of recommendation are less accuracy of recommendation is high using proposed hybrid approach.
7.
REFERENCES
[1] G. Linden, B. smith, and J. York, O. Young, “Amazon.com Recommendations: item-to-item Collaborative filtering,” IEEE internet computing, vol. 7, no.1, pp.76-80, Jan /feb.2003.
[2] J.S. Breese, D. Heckerman, and C. Kadie, “Empirical Analysis of Predictive Algorithms for Collaborative Filtering,” Proc. 14th Conf. Uncertainty in Artificial Intelligence (UAI), 1998.
[3] A.s. Das, M. Datar, A. Garg and S. Rajaram, “Google News Personalization: Scalable Online Collaborative Filtering,” WWW’07:Proc 16th International coneference on World wide web, pp.271-280,2007. [4] L. von Ahn and L. Dabbish,“Labeling Images with a
Computer Game,” CHI ’04: Proc. SIGCHI Conf. Human Factors in Computing Systems, pp. 319-326, 2004. [5] G. Pass, A. Chowdhury, and C. Torgeson, “A picture of
search”, In The First International Conference on Scalable Information Systems Kong,Hong Kong, June 2006.
[6] Y.-H. Yang, P.-T. Wu, C.-W. Lee, K.-H. Lin, W.H. Hsu, and H. Chen, “ContextSeer: Context Search and Recommendation at Query Time for Shared Consumer
Photos,” Proc. 16th ACM Int’l Conf. Multimedia, pp. 199-208, 2008.
[7] Robin van Meteren and Maarten van Someren.”Using Content-Based Filtering for Recommendation” .NetlinQ Group, Gerard Brandtstraat Amsterdam, 2010.
[8] Hao Ma, Irwin King and Michael R. Lyu, “Mining Web Graphs for Recommendations”, IEEE transaction on knowledge and data engineering, 2012.
[9] Danil Nemirovsky “Web Graph and PageRank algorithm,” Department of Technology of Programming, Faculty of Applied Mathematics and Control Processes, St. Petersburg State University,Russia,2009.
[10] M. Deshpande and G. Karypis, “Item-Based Top-n Recommendation,” ACM Trans. Information Systems, vol. 22, no. 1, pp. 143-177, 2004.
[11] Hui Xiong, Shashi Shekhar, Pang-Ning Tan and Vipin Kumar, “Exploiting A Support-based Upper Bound of Pearson's Correlation Coef_cient for Ef_ciently Identifying Strongly Correlated Pairs,” KDD'04, August 22.25, 2004, Seattle, Washington, USA.