RESEARCH ARTICLE
Defining developmental diversification of diencephalon neurons
through single cell gene expression profiling
Qiuxia Guo1and James Y. H. Li1,2,*
ABSTRACT
The embryonic diencephalon forms integration centers and relay stations in the forebrain. Anecdotal expression studies suggest that the diencephalon contains multiple developmental compartments and subdivisions. Here, we utilized single cell RNA sequencing to profile transcriptomes of dissociated cells from the diencephalon of E12.5 mouse embryos. We identified the divergence of different progenitors, intermediate progenitors, and emerging neurons. By mapping the identified cell groups to their spatial origins, we characterized the molecular features of cell types and cell states arising from various diencephalic domains. Furthermore, we reconstructed the developmental trajectory of distinct cell lineages, and thereby identified the genetic cascades and gene regulatory networks underlying the progression of the cell cycle, neurogenesis and cellular diversification. The analysis provides new insights into the molecular mechanisms underlying the amplification of intermediate progenitor cells in the thalamus. The single cell-resolved trajectories not only confirm a close relationship between the rostral thalamus and prethalamus, but also uncover an unexpected close relationship between the caudal thalamus, epithalamus and rostral pretectum. Our data provide a useful resource for systematic studies of cell heterogeneity and differentiation kinetics within the diencephalon.
KEY WORDS: Mouse, Transcription regulation, Transcriptome, Cell fate specification, Thalamus
INTRODUCTION
Residing in the posterior part of the forebrain, the diencephalon produces distinct classes of neurons, which assemble into multiple nuclei. These functional units are important for linking the anterior forebrain with the rest of the nervous system. For example, the thalamus and epithalamus, which arise from the center of the diencephalon, serve important functions such as learning, motor control, regulation of the sleep-wake cycle, and modulation of emotion and motivation (Hikosaka, 2010; Sherman, 2007). Therefore, understanding the development of the diencephalon is necessary to improve our comprehension of this integral component of forebrain circuitry.
Based on gene expression patterns and morphological landmarks, the embryonic diencephalon is divided into at least three transverse segments called prosomeres (Puelles and Rubenstein, 2003; Rubenstein et al., 1994). During embryogenesis, proliferating
progenitor cells in the alar plate of the respective prosomere ( p) give rise to the pretectum ( p1), the thalamus and epithalamus ( p2), and the prethalamus ( p3). Additional intra-prosomere subdivisions have been proposed (Ferran et al., 2007; Kiecker and Lumsden, 2005). For instance, the zona limitans intrathalamica (ZLI), which is wedged in between p2 and p3, forms a compartment that is delineated by rostral and caudal cell-lineage restriction boundaries (Zeltser et al., 2001). Importantly, the ZLI acts as an organizer by producing Shh, a secreted protein, to regulate regionalization and patterning of the entire diencephalon (Kiecker and Lumsden, 2004). Shh acts in concert with other signaling molecules emanating from the roof plate, including those in the Fgf, Bmp and Wnt families, to regulate the development of the diencephalon (Chatterjee and Li, 2012; Scholpp and Lumsden, 2010). Despite some progress, our understanding of the pattern formation and neuronal differentiation of the diencephalon remains incomplete. For instance, although much is known about the molecules that define populations of postmitotic neurons arising from different areas of the diencephalon, considerably less is clear about the molecular features that delineate their respective progenitor populations. Prior studies have revealed highly variable progression in cell proliferation and neurogenesis, the so-called morphogenetic gradients, across the developing diencephalon (Jones, 2007). Because of this developmental asynchrony, traditional expression profiling, which measures averaged gene expression in bulk tissue, lacks the resolution necessary to gain full insight into the transcription regulation that underlies the formation of different diencephalic lineages. However, single cell gene expression analysis, which provides such resolution, has only been performed in diencephalon-derived neurons from postnatal mice (Kalish et al., 2018; Phillips et al., 2018 preprint; Rosenberg et al., 2018; Zeisel et al., 2018).
In this study, we sought to systematically define cellular heterogeneity and transcriptional landscapes during cell specification and differentiation in the embryonic diencephalon. We performed single cell RNA sequencing (scRNAseq) of dissociated cells from the mouse diencephalon at embryonic day (E) 12.5. Our unbiased scRNAseq allowed characterization of the molecular features across different cell types and cell states that arise from various diencephalic domains. Furthermore, we inferred developmental trajectories of diverse cell lineages, and thereby identified the genetic cascades and gene regulatory networks underlying the progression of the cell cycle, neurogenesis, and cellular diversification. To the best of our knowledge, this is the first reported scRNAseq analysis of mouse embryonic diencephalon. Our data provide a valuable resource for systematic studies of cell heterogeneity and differentiation kinetics within the diencephalon.
RESULTS AND DISCUSSION
Classification of cell groups of the mouse diencephalon We used a mouse line, in which bicistronic creER-ires-EGFP
transcripts are expressed from the Gbx2 locus so that thalamic Received 28 November 2018; Accepted 7 March 2019
1Department of Genetics and Genome Sciences, University of Connecticut School of Medicine, 263 Farmington Avenue, Farmington, CT 06030-6403, USA.2Institute for Systems Genomics, University of Connecticut, 400 Farmington Avenue, Farmington, CT 06030-6403, USA.
*Author for correspondence ( [email protected]) J.Y.H.L., 0000-0002-9231-2698
DEVEL
O
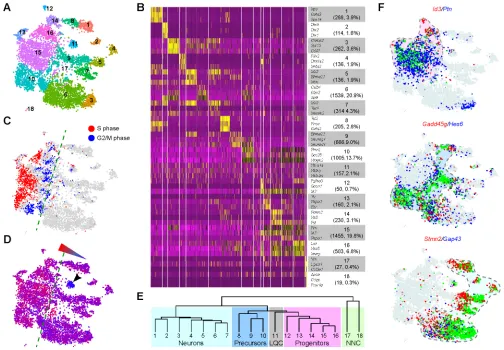
neurons specifically produce both creER and enhanced green fluorescence protein (EGFP) (Chen et al., 2009). Utilizing EGFP as a guide, we dissected the thalamus and surrounding tissues from mouse embryos at E12.5. Using the Chromium Drop-Seq platform (10x Genomics), we profiled the transcriptome for over 7500 single cells. After applying quality filters, we obtained a dataset with 7365 cells and 14,387 genes for subsequent analysis. Using the Seurat algorithm (Butler et al., 2018; Satija et al., 2015), we partitioned the 7365 cells into 18 clusters, which were visualized with t-distributed stochastic neighbor embedding (t-SNE; Fig. 1A). Differential gene expression analysis identified genes that were significantly enriched in each cell cluster (Fig. 1B, Table S1). We used a set of cell cycle-related genes (Tirosh et al., 2016) to calculate cell-cycle scores and thereby to assign cell-cycle status (G2/M, S or postmitotic) to each cell (Fig. 1C). In t-SNE projections, the distribution of cells with various mitotic statuses showed a trend reflecting the progression from proliferating progenitors to postmitotic cells (Fig. 1C). Inspection of the average gene counts revealed a trend of decreasing transcript levels from progenitors to postmitotic cells (Fig. 1D), indicating that the dividing progenitors have higher gene counts than their progeny. We classified cluster 11 as low-quality cells, as they had much lower gene counts than the others, and
contained few cluster-specific genes (Fig. 1B,D). Besides brain cells, we recovered non-neural cell types, such as endothelial cells (cluster 17) and microglia (cluster 18). Hierarchical analysis classified the 18 cell clusters into five groups: postmitotic neurons, neuron precursors or intermediate progenitor cells (IPCs), neural progenitors, non-neural cells and low-quality cells (Fig. 1E). We identified Id3 and Ptn as the markers that were common for progenitors;Gadd45 gandHes6for newly committed progenitors, or neuron precursors;Stmn2andGap43for postmitotic neurons (Fig. 1F, Table S1). Therefore, our scRNAseq data illustrate the heterogeneity of cells within the mouse diencephalon at E12.5.
Characterization of the molecular features of postmitotic neurons
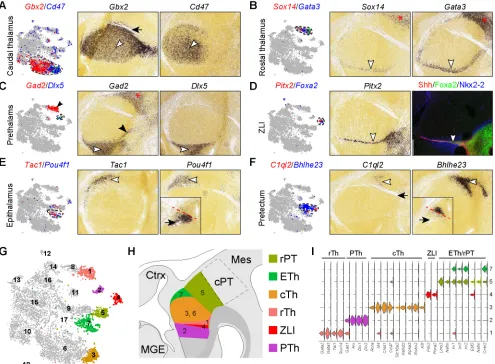
[image:2.612.54.558.317.667.2]Next, we related postmitotic cell groups to their endogenous positions by inspecting RNAin situhybridization data in the Allen Developing Mouse Brain Atlas (Thompson et al., 2014) or by examining expression ourselves. By comparing the expression of at least two markers in t-SNE projections and in situ hybridization on serial sagittal sections of mouse embryonic brains, we assigned cell cluster 3 to caudal thalamus, cluster 1 to rostral thalamus, cluster 2 to prethalamus, cluster 4 to ZLI, cluster 7 to epithalamus, and cluster 5 to
Fig. 1. Identification of major cell groups in E12.5 mouse diencephalon by scRNAseq.(A) Visualization of 18 classes of cells using t-SNE. Each dot represents a single cell; similar cells are grouped and shown in color. (B) Heatmap showing expression of marker genes across cell groups. The number and percentage of cells are shown in brackets under the cluster number. Relative expression from 2 to−2 are shown in yellow and purple, respectively. (C,D) t-SNE plots showing the inferred cell cycle phase (C) and average gene counts (D). The dashed lines delineate between proliferating cells (to the left) and postmitotic cells (right). In D, the arrowhead indicates the low-quality cells, and the triangle illustrates the gradient of gene counts. (E) Dendrogram showing the relationship between cell groups recovered by scRNAseq. LQC, low-quality cells; NNC, non-neural cells. (F) Expression of the genes marking cell clusters corresponding to
neural progenitors, neuron precursors and postmitotic neurons, respectively (top to bottom).
DEVEL
O
pretectum (Fig. 2A-F). Clusters 6, 8 and 9 apparently represented intermediate cell states in transition to more differentiated cells of clusters 3, 1 and 5/7, respectively (see below). As the Allen Developing Mouse Brain Atlas has limited information for E12.5 mouse brains, we curated a list of markers for different diencephalic cell types at E12.5 based on published studies (Chatterjee et al., 2012; Delogu et al., 2012; Mallika et al., 2015; Suzuki-Hirano et al., 2011; Virolainen et al., 2012). Examination of these known markers confirmed our annotation of postmitotic cell clusters (Fig. 2G-I). The ZLI acts as the primary organizing center in the caudal forebrain by producing Shh as a morphogen (Kiecker and Lumsden, 2004). Unexpectedly, we failed to detect any enrichment ofShhtranscripts in cluster 4 cells, but we foundShhexpression in the presumed floor plate cells (cluster 12, see below). This indicates that, although scRNAseq at the current sequencing depth is sufficient to distinguish different cell groups, it may be not sensitive enough to provide a comprehensive transcriptional profile of a given cell group.
The pretectum is commonly subdivided into rostral and caudal parts, or tripartite subdivisions, in avian embryos (Ferran et al.,
2007; Rendahl, 1924). Although the mammalian pretectum has not been well characterized, evidence suggests a similar organization between mice and chicken (Ferran et al., 2008).C1ql2andBhlhe23, which represent cluster 5, are expressed in the rostral part of the pretectum, immediately posterior to the fasciculus retroflexus, or habenular peduncular tract (Fig. 2F). On coronal sections, the expression domain of Bhlhe23 resides above that of Pou4f1
(Fig. 2E,F, insets), which marks the epithalamus-derived lateral habenular nucleus (Chatterjee et al., 2014; Quina et al., 2009). The caudal part of the pretectum expresses Sox14, Gata3 and Gad2, which are absent from the rostral part of the pretectum (Fig. 2B,C). Therefore, our analysis suggests that the mouse pretectum can be subdivided into rostral and caudal domains with distinct molecular features. Notably, most genes that are specific for cluster 1 are present in both the rostral thalamus and the caudal pretectum (Fig. 2B,C). It has been shown that these two domains express the same set of developmental regulators (Ascl1,Helt,Gata2/3,Tal1/2
[image:3.612.60.555.288.652.2]andSox14), and produce GABAergic neurons (Delogu et al., 2012; Virolainen et al., 2012). However, the molecular underpinning of
Fig. 2. Relating postmitotic cell groups to their spatial positions in the diencephalon.(A-F) Expression of cell-specific markers with t-SNE plotting (left) and on sagittal sections of E13.5 mouse diencephalon (right; from the Allen Developing Mouse Brain Atlas). White arrowheads indicate the marker expression domain; black arrow denotes the fasciculus retroflexus; black arrowheads in C show that Gad2 is expressed in the rostral thalamus, as well as the prethalamus; asterisks indicate the caudal pretectum, which exhibits a similar gene expression profile as rostral thalamus. Insets in E and F show the expression ofPou4f1 andBhlhe23on coronal sections of E13.5 diencephalon; the red dashed line separates their expression domains. (G) t-SNE projections of diencephalic neurons. (H) Schematic summary of the postmitotic neurons identified by scRNAseq in their endogenous positions in the diencephalon. (I) Violin plot showing expression of genes that are known to mark different diencephalic neurons at E12.5. cPT, caudal pretectum; cTh, caudal thalamus; Ctrx, cortex; ETh, epithalamus;
MGE, medial ganglionic eminence; Mes, mesencephalon; PTh, prethalamus; rPT, rostral pretectum; rTh, rostral thalamus; ZLI, zone limitans intrathalamica.
DEVEL
O
GABAergic differentiation may be different, as the deletion of
Ascl1orGata2caused distinct phenotypes in the rostral thalamus and posterior pretectum (Virolainen et al., 2012). As our microdissection likely included tissues from the rostral thalamus due to its close proximity to the thalamus, we provisionally assign cluster 1 to the rostral thalamus. However, we are uncertain whether this cluster may contain cells from the caudal pretectum. Future scRNAseq of the entire diencephalon will be necessary to discern the molecular features between the rostral thalamus and caudal pretectum at E12.5.
Determination of the molecular characteristics of diencephalic progenitor cells
Compared with postmitotic neurons, diencephalic progenitors display less distinctive expression profiles among different groups (Fig. 1B,E). We had to rely on combinations of multiple genes to annotate the progenitor cell groups. For example,Neurog1andDll1
are both expressed in presumptive IPCs, or basal progenitors, in the caudal thalamus (cluster 10) and neuron precursors in the epithalamus and rostral pretectum (cluster 9; Fig. 3A);Dll1is also expressed in neuron precursors within the rostral thalamus (cluster 8; Fig. 3A). As described previously (Wang et al., 2011),Neurog2and
Olig3are expressed in both apical progenitors next to the ventricular surface (cluster 15) and IPCs (cluster 10) in the subventricular zone of the p2 domain (Fig. 3B). In addition,Olig3is expressed in the ventricular zone of the rostral thalamus (cluster 14), whereas
Neurog2 is expressed in newborn neurons in the epithalamus and rostral pretectum (clusters 9 and 16; Fig. 3B).Gbx2andLhx2
are co-expressed in newborn thalamic neurons (cluster 6; Fig. 3C). In addition, Lhx2 is expressed in IPCs of the caudal thalamus (cluster 10) and newborn neurons from the epithalamus and rostral pretectum (cluster 9; Fig. 3C).Pax3andCdonare co-expressed at the dorsal midline (cluster 13), but the expression domain ofPax3
extends ventrally, including progenitors (cluster 16) and newborn neurons (cluster 9) in the rostral pretectum (Fig. 3D). Cluster 12 cells expressShh andFoxa2, which are specific for the ZLI and basal plate (Fig. 2D, Fig. S1A, Table S1). In addition, cluster 12
cells expressEdnrbandNtn1, which are only present in the basal plate (Fig. S1B,C), indicating that cluster 12 represents the basal plate. The annotation of progenitor cell groups is summarized in Fig. 3E,F. A summary of the annotation and number of all 18 cell groups is provided in Fig. S2. It is worth noting that the cell number and percentage may not be an accurate measurement of different populations of diencephalic cells at E12.5 because we mostly focused on the thalamus when we collected tissues for the current scRNAseq (see Materials and Methods for details).
Expression data of many feature genes are not available in Allen Developing Mouse Brain Atlas. Even fewer exist for coronal brain sections, which are important for assessing expression in progenitor domains. Future studies with improved cell clustering algorithms and additional gene expression data should help to refine the division of different diencephalic progenitor domains.
Identification of spatial gene expression patterns in the roof plate and p2
It is generally believed that the epithalamus and the thalamus arise from the dorsal and ventral parts of p2 (Chen et al., 2009; Mallika et al., 2015). However, cell clustering could not reliably subdivide the presumed p2 progenitor cells (cluster 15). This suggests that the epithalamic and thalamic progenitors share similar molecular features, or that these two groups of progenitors contain gradual expression changes of relatively few genes. To test the latter hypothesis, we explored the‘spatial structure’in our scRNAseq data with different analytical methods.
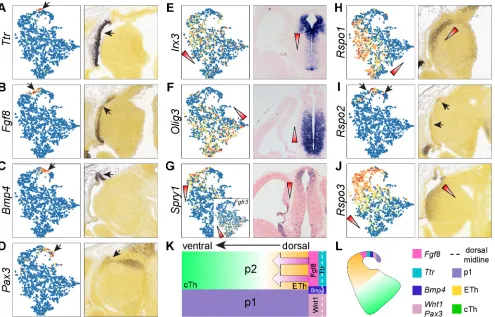
[image:4.612.68.546.479.674.2]Fgf8is expressed in two narrow longitudinal stripes flanking the roof plate overlaying p1-2, whereasWnt1is expressed at the roof plate covering the p1 and mesencephalon (Martinez-Ferre and Martinez, 2009; Martinez-Ferre et al., 2013). We found that the presumed roof-plate cells (cluster 13) were adjacent to the p2 cells (cluster 15) in t-SNE projections (Fig. 3E).Fgf8and Wnt1were detected in two small discrete subgroups within the roof-plate cluster (Fig. S1D,E). Moreover,Wnt1+cells were embedded withPax3+cells, indicating a p1 origin of the Wnt1+ cells (Fig. S1D). Finally, we detected a decreasing gradient ofRspo3from theFgf8+cells to the rest of the p2
Fig. 3. Relating progenitor cell groups to their original positions in the diencephalon.(A-D) Expression of cell-specific markers on t-SNE plots (left) and on coronal sections of mouse diencephalon (right) at E13.5 (A,B; from Allen Developing Mouse Brain Atlas) and E12.5 (C,D). On t-SNE plots, the cells that express a given marker are shown in red or blue as indicated; those that express both are shown in green and outlined by dashed lines. Cell groups expressing a single marker are indicated by an arrowhead with matching color on both t-SNE plots and sections. (E) t-SNE plots of diencephalic progenitor cell groups. The dashed arrows show developmental trajectories. (F) Schematic of scRNAseq-identified progenitor groups within the diencephalon. BP, basal plate;
cTh, caudal thalamus; p2, prosomere 2; RP, roof plate; rPT, rostral pretectum; rTh, rostral thalamus.
DEVEL
O
progenitor cells in t-SNE projections, recapitulating the endogenous expression pattern (Fig. S1E,F). Collectively, these observations suggest that some spatial information is preserved among cells in t-SNE projections. Therefore, we applied trendsceek, a statistical method that tests points (cells in low-dimensional projections) in a pairwise manner to identify genes that exhibit distance-dependent expression in single cell gene expression datasets (Edsgärd et al., 2018). Trendsceek identified 92 genes with significant spatial trends (P<0.01, Benjamini–Hochberg adjusted), including at least six different patterns exemplified byTtr,Fgf8,Bmp4,Pax3,Irx3and
Olig3, respectively (Fig. 4A-F). By inspecting the endogenous expression in the Allen Developing Mouse Brain Atlas, we found that trendsceek correctly predicted the spatial expression of several genes (Fig. 4K,L). Ttr, which encodes a transporter protein that carries thryroxin and retinol, is normally expressed in precursor cells of the choroid plexus (Herbert et al., 1986). Therefore, we classified the
Ttr+cell group as choroid plexus epithelium.
We uncovered 36 genes that displayed opposing gradients in p2 progenitors along the presumptive dorsoventral axis, similar to the expression patterns ofIrx3 orOlig3(Fig. S3A,B). Some of these genes have been implicated in p2 regionalization. For instance,Irx3
and Pax6, which exhibit a dorsalhigh-ventallowgradient (Fig. 4E, Fig. S3A,B), are known to establish differential competence for Shh signaling in the patterning of the p2 progenitor zone (Robertshaw et al., 2013).Tcf7l2, which shows a ventralhigh-dorsallowgradient (Fig. S3B), is important for thalamus development as its deletion results in a thalamic-to-epithalamic fate conversion (Lee et al.,
2017b). Collectively, our data suggest that the prospective epithalamus and thalamus arise from two p2 progenitor domains with graded, rather than discrete, gene expression differences.
It has been shown thatFgf8signaling inducesSpry1but represses
Fgfr3(Liu et al., 2003). We observed opposing gradients ofSpry1
[image:5.612.61.556.367.684.2](dorsalhigh) and Fgfr3 (ventralhigh) (Fig. 4G). This indicates the presence of graded Fgf8 activity in the p2 progenitor domain, in agreement with the known function of Fgf8 in patterning of p2 (Martinez et al., 1999). A prior report has demonstrated a complex pattern of Wnt/β-catenin signaling in the p2 domain, with lower activity in the ventral and rostral regions (Bluske et al., 2009). However, the pattern of Wnt/β-catenin activity does not correlate with the expression pattern of known Wnt ligands. How the spatial pattern of Wnt/β-catenin activity is established in the p2 progenitor domain remains largely unknown. Trendsceek predicted significant spatial trends ofRspo1,2and3, which code for secreted proteins of the R-spondin family. Indeed, we confirmed a caudalhigh-rostrallow gradient ofRspo1, restricted expression ofRspo2near the roof plate, and a dorsalhigh-ventrallowgradientRspo3(Fig. 4H-J). As R-spondin proteins are known to potentiate Wnt/β-catenin signaling (de Lau et al., 2014), the spatial expression ofRspo1-3may account for the differential activity of Wnt/β-catenin found in the p2 domain. Collectively, our findings suggest that the morphogen gradients of Fgf8 and Wnt/β-catenin signaling may orchestrate graded gene expression in the p2 progenitor zone, leading to the formation of the epithalamus and thalamus from the dorsal and ventral parts of p2, respectively.
Fig.. 4. Inference of spatial gene expression patterns in the p2 domain with scRNAseq data.(A-J) Spatial expression of significant genes identified by trendsceek on scRNAseq data projected with t-SNE (left) and on sagittal brain sections (right). Expression levels are scaled from 0 (blue) to 1 (red); arrows indicate the matching expression domain on the section and cells on the t-SNE; triangles denote the expression gradient. (K,L) Schematics of the spatial expression patterns in the diencephalon (K) and t-SNE data (L). The arrow indicates the morphogen gradients of Fgf8 and Wnt/β-catenin signaling. Images in A-D
and H-J are from Allen Developing Mouse Brain Atlas.
DEVEL
O
Progenitor cells in the caudal thalamus display a unique pattern of cell cycling and neurogenesis
Prior studies have demonstrated the existence of a unique and significant population of IPCs in the caudal thalamus, forming a defined subventricular zone as found in the developing neocortex and basal ganglia (Smart, 1972; Wang et al., 2011). As expected, we recovered abundant presumptive IPCs (cluster 10) from the caudal thalamus (Fig. 3E,F). This cluster contained cells in S and G2/M phases, despite the robust expression of the proneural genes
Neurog1 and Neurog2 (Figs 1C, 3A,B), indicating that these neurogenic progenitors are highly proliferative. It has been shown that IPCs in the thalamus depend onNeurog1/2and Pax6(Wang et al., 2011). However, as these genes are expressed in other areas that lack IPCs, other unknown factors must be involved in the amplification of IPCs in the caudal thalamus.
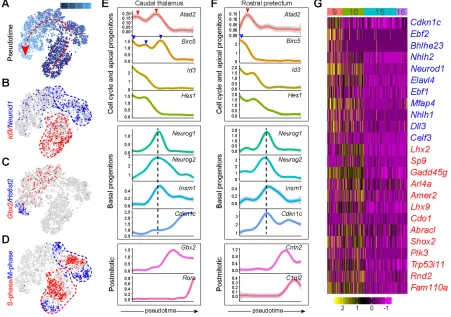
To investigate the mechanism underlying IPC development, we digitally isolated cells that presumably originated from the caudal thalamus (clusters 3, 6, 10 and 15) and ordered them according to pseudotime using the Monocle 2 algorithm (Qiu et al., 2017). For comparison, we performed the same analysis with the rostral pretectal cells (clusters 5, 7, 9 and 16). Monocle inferred a trajectory that was composed of thalamic cells from clusters in the 16→10→6→3 order, and a rostral pretectal trajectory that was composed of cells from clusters in the 16→9→7/5 order (Fig. S4A,B). Inspection of the pseudotime and expression of known markers,
Id3(apical progenitors),Neurog1(IPCs),Gbx2(newborn neuron
precursors) andHs6st2( postmitotic neurons), showed that Monocle correctly ordered cells according to the developmental trajectory of the thalamic lineage (Fig. 5A-C). Interestingly, the apical progenitor (Id3+) and IPC (Neurog1+) groups each contained one group of S-phase cells, and two separate groups of M-phase cells in t-SNE projections (Fig. 5D), suggesting that both apical and IPCs in the caudal thalamus undergo actively symmetric division. Ordering cells according to pseudotime revealed sequential changes of gene expression and temporal coupling between cell cycle and neurogenesis in the caudal thalamus and rostral pretectum (Fig. 5E,F). Remarkably, the expression ofBirc5and Atad2, which mark the M- and S-phase, respectively (Tirosh et al., 2016), displayed at least two out-of-phase waves (Fig. 5E). Furthermore, the last wave of the cell cycle genes overlapped with the peak ofNeurog1andNeurog2
expression (Fig. 5E). In sharp contrast to the caudal thalamus, the expression of the cell-cycle genes and apical progenitor markers sharply decreased before the induction ofNeurog1andNeurog2in the rostral pretectum (Fig. 5F). We detected co-expression ofInsm1
[image:6.612.81.532.359.676.2]andNeurog1/2 in both the caudal thalamus and rostral pretectum (Fig. 5E,F), indicating that Insm1 is not specific for IPCs as suggested previously (Wang et al., 2011). To study candidate molecules that regulate the development of neural progenitors in the caudal thalamus, we performed differential gene expression analyses. We found that cluster 16 cells were enriched for genes that are involved in stem cell maintenance, Wnt signaling and Hedgehog signaling, whereas IPCs were enriched for genes in the FoxO
Fig. 5. Examination of the unique pattern of cell cycle exit and neurogenesis of thalamic progenitors.(A-D) t-SNE plots showing pseudotime (A), gene expression (B,C) and inferred cell cycle states (D) of cells originating from the caudal thalamus. The dashed arrow indicates the increase of pseudotime predicated by Monocle. (E,F) Temporal expression profiles of the genes that represent cell cycle and apical progenitors, IPCs (basal progenitors), and postmitotic neurons, respectively, in the caudal thalamus (E) and rostral pretectum (F). The arrowheads indicate the peak expression of genes representing the S (red) and M (blue) phases; the vertical dashed lines show the pseudotime position that corresponds to the peak ofNeurog1/2expression. (G) Heatmap showing the genes that are highly expressed in clusters 9 and 10. Cluster number is indicated at the top; clusters 15 and 16 are shown for comparison.
DEVEL
O
signaling pathway, which plays an important role in cell cycle progression (Table S2). Pairwise comparisons among clusters 9, 10, 15 and 16 identified genes that were specific to cluster 9 and 10 (Fig. 5G). Among cluster 10-specific genes, Sp9 (trans-acting transcription factor 9),Gadd45g(growth arrest and DNA-damage-inducible 45 gamma) and Plk3 ( polo-like kinase 3) have been implicated in cell cycle regulation.Sp9is expressed and plays an essential role in IPC proliferation within the basal ganglia (Zhang et al., 2016). Furthermore,Rnd2, a transcriptional target of Neurog2 (Heng et al., 2008), andFam110aare enriched in the subventricular zone of the cortex (Fietz et al., 2012). Remarkably,Cdkn1c, which codes for a cyclin dependent kinase inhibitor ( p57kip2) important for neuronal cell cycle exit (Dyer and Cepko, 2001; Gui et al., 2007), was highly expressed in cluster 9 (Fig. 5G). By contrast, the induction ofCdkn1cwas delayed in the caudal thalamus compared with that in the rostral pretectum (Fig. 5E,F).
We next compared high-order gene transcription regulation in the caudal thalamus and rostral pretectum through weighted gene co-expression analysis (WGCNA) (Langfelder and Horvath, 2008; Zhang and Horvath, 2005). Because scRNAseq recovers only a small fraction of the transcripts in a cell, the technical noise, commonly called dropout, can obscure gene-gene relationships (Stegle et al., 2015). In fact, we found thatGbx2andGFP, which are transcribed from the same Gbx2 locus in Gbx2creER/+ embryos (Chen et al., 2009), showed only moderate correlation (r=0.49; Fig. S5A). To address the dropout issue, we tested three different expression recovery methods, MAGIC (Markov affinity-based graph imputation of cells) (van Dijk et al., 2018), SAVER (single cell analysis via expression recovery) (Huang et al., 2018), and
ALRA (adaptive-thresholded low-rank approximation) (Linderman et al., 2018 preprint). All three methods improved the linear coefficient between Gbx2and GFP(r=1, MAGIC; 0.8, SAVER; 0.94, ALRA; Fig. S5). However, MAGIC imputation distorted the relationship between Gbx2 and Sox14, which were present in different cell types (Fig. S5). Following the standard procedure as described in our previous publication (Heng et al., 2017), we used the ALRA-imputed expression matrix as inputs for WGCNA analysis and identified co-expressed gene modules, which were labeled by colors (Fig. 6A,B). The purple module of the caudal thalamus network, and the light-cyan module of the rostral pretectum network were enriched forNeurog1,Neurog2and other factors that promote neurogenesis (Table S3). Furthermore, the distribution of module eigengene, the first principal component, of these two modules was closely correlated with clusters 10 and 9, respectively (Fig. S6A,B), and the eigengene changes paralleled the expression ofNeurog1in cells arranged according to pseudotime (Fig. 6C,D, Fig. S6C,D). By examining the number of genes that fell into modules of the caudal thalamus versus modules of the rostral pretectum, we detected a strong agreement in assignments of most modules between the networks (Fig. 6E). However, the thalamus purple module and pretectal light-cyan module, as well as a few related modules, were poorly preserved (Fig. 6E, Fig. S6C,D). To quantify the overall significance of the network preservation statistics, we computed the composite Zsummaryscores (Zsummary>10 for preserved; Zsummary<2 for non-preserved modules) (Langfelder et al., 2011). The thalamus purple module and pretectum light-cyan module were among the least preserved modules in their counterpart networks (Fig. 6F,G). Collectively, our data show that the gene
Fig. 6. Comparison of gene co-expression networks between caudal thalamic and rostral pretectal cells.(A,B) Hierarchical clustering trees of genes based on the co-expression network in the caudal thalamus (cTh; A) and the rostral pretectum (rPT; B). The colored rows below the dendrograms indicate module membership in each network. The arrowheads indicate that the purple module of the cTh network is absent from the rPT network, whereas the light-cyan module of the rPT network is absent from the cTh network. (C,D) Expression of thalamic purple module (C) and pretectal light-cyan module (D) eigengene values over pseudotime. The lower panel showsNeurog1expression, as shown in Fig. 5E,F. The gray area definesNeurog1-expressing cells. The arrowheads indicate the peak of purple and light-cyan modules at the center of the gray area. (E) A contingency table of cTh (rows) and rPT (column). Each row and column is labeled by the corresponding module color and the total number of genes in the module. In the table, numbers indicate gene numbers in the intersecting row-column module. The table is color-coded by−log( p) of the Fisher exact testP-value, according to the color key on the right. (F,G) Preservation statistics of cTh modules in rPT network (F) or rPT modules in cTh network (G). The red and blue dashed lines indicate Zsummarycutoff at 10 and 2 (Zsummary>10
for preserved; Zsummary<2 for non-preserved modules).
DEVEL
O
[image:7.612.50.560.388.635.2]network associated with the onset of neurogenesis is markedly divergent between the caudal thalamus and the rostral pretectum.
In summary, by using pseudotime analysis and gene co-expression network analysis, we demonstrate the unique pattern of cell cycle progression and neurogenesis in the caudal thalamus. Importantly, we have identified a set of genes that may contribute to the distinctive coupling of neurogenesis and cell proliferation in the caudal thalamus. We suggest that the delayed induction of Cdkn1c is involved in the significant expansion of IPCs in the caudal thalamus, which may be responsible for the generation of the vast number and diversity of thalamic neurons in mammals.
Inference of developmental trajectories of lineage specification
To reconstruct developmental trajectories of various diencephalic cell types, we applied the URD algorithm (Farrell et al., 2018) to the entire dataset minus the low-quality cells and non-neural cells. Building on an extension of the diffusion map framework (Haghverdi et al., 2015, 2016), URD uses discrete random walks and graph searches to order cells in pseudotime and reconstruct complex developmental trajectories (Farrell et al., 2018). We assigned apical progenitors (mostly clusters 15 and 16) as the root, and postmitotic neurons of clusters 1-5 and 7 as tips, resulting in a multi-branching trajectory (Fig. 7A). The hierarchical tree was visualized with a force-directed layout based on cells’ visitation frequency by the random walks from each tip (Fig. 7B). Inspection of the expression of known markers showed progressive changes along consecutive segments of the respective trajectory, as expected
(Fig. 7C, Fig. S7), suggesting that we had successfully reconstructed the developmental trajectory of the diencephalon.
The reconstructed tree closely reflects the development of different populations of diencephalic neurons. For example, the URD-inferred tree predicts a close relationship between the rostral thalamus and prethalamus (Fig. 7A,B). This is in agreement with the notion that these two regions may share a common pool of progenitors but give rise to different subtypes of GABAergic neurons (Kataoka and Shimogori, 2008). Indeed, GABAergic precursors that arise from the rostral thalamus or pretectum retain latent plasticity for subtype identity upon cell cycle exit; removal of various transcription factors, such asGata2,HeltandAscl1,Tal2, andDlx1/2 results in cell fate switching between rostral thalamus and prethalamus (Delogu et al., 2012; Lee et al., 2017a; Sellers et al., 2014; Song et al., 2015; Virolainen et al., 2012). Furthermore, the predicted close relationship between the epithalamus and the thalamus is also in line with the fact that they both arise from the p2 domain (Puelles and Rubenstein, 2003; Rubenstein et al., 1994). In addition, we and others have reported that deletion of Gbx2 or
Tlc7l2causes cell-fate conversion from thalamic neurons to those of an epithalamic fate (Lee et al., 2017b; Mallika et al., 2015).
[image:8.612.50.380.393.734.2]The predicted close relationship between the rostral pretectum and the thalamus or the epithalamus is somewhat unexpected as they belong to p1 and p2, respectively. However, evidence from genetic studies in mice and fish has recently suggested a latent cell-fate plasticity between thalamus- and pretectum-derived neurons. For example, deletion of lhx2/9 or increased Wnt signaling causes re-specification of the thalamic to a pretectal fate in the zebrafish embryo (Peukert et al., 2011). Conversely, ectopic expression ofShh
Fig. 7. Reconstruction of developmental trajectories of the diencephalon.(A) URD-inferred hierarchical tree of diencephalic lineages. (B) Force-directed layout of the trajectory tree colored by segments as shown in A. (C) Expression of lineage markers overlaid on the trajectory tree. The arrows indicate robust expression in each specific lineage. cTh, caudal thalamus; ETh, epithalamus; PTh, prethalamus; rPT, rostral pretectum; rTh, rostral thalamus; ZLI, zona limitans intrathalamica.
DEVEL
O
can convert the pretectum into a thalamic fate (Kiecker and Lumsden, 2004; Vieira and Martinez, 2006; Vieira et al., 2005). Finally, although it has been demonstrated that the thalamic neurons are converted to an epithalamic fate in mice lackingGbx2orTcf7l2
(Lee et al., 2017b; Mallika et al., 2015), our new evidence suggests that the rostral pretectum-specific markers were also ectopically increased in the thalamus in the absence ofGbx2andTcf7l2(see below). Collectively, these observations support the view that the thalamus and pretectum, as least the rostral part of the pretectum, are closely related.
Therefore, the single cell-resolved trajectories not only confirm a close relationship between the rostral thalamus and prethalamus, but also uncover an unexpected close relationship between the caudal thalamus, epithalamus and rostral pretectum. It is worth noting that the deduced lineage relationship is based on gene expression. The actual ancestor-progeny relationship will need to be determined in the future by emerging technology combining lineage tracing and scRNAseq (Kester and van Oudenaarden, 2018).
Determination of gene expression landscapes along developmental trajectories
To determine gene expression dynamics during the specification of diencephalic cell lineages, we searched for genes for which expression levels significantly changed along a given URD-recovered trajectory. We identified a total of 647 such so-called‘cascade genes’in each trajectory leading to the formation of the epithalamus (n=313), caudal thalamus (n=361), prethalamus (n=100), rostral pretectum (n=335), rostral thalamus (n=94) and ZLI (n=157; Table S4). For the cascade genes in each lineage, we applied impulse response fitting to determine their temporal dynamics, leading to identification of markers specific for each lineage (Fig. 8A-F, Table S2). Assessing the expression of 20 thalamus-specific markers predicted by URD showed that they correctly highlighted the caudal thalamus branch in the trajectory tree (Fig. S8). Notably, 13 of them (65%) have been shown to be specific for thalamic neurons according to previous studies (Mallika et al., 2015; Suzuki-Hirano et al., 2011), indicating the accuracy of lineage-specific markers recovered by URD.
It has been demonstrated thatGbx2is essential for the development of the thalamus (Chatterjee et al., 2012; Chen et al., 2009; Mallika et al., 2015; Miyashita-Lin et al., 1999). Through microarray transcriptome profiling, we previously identified a set of genes that are mis-regulated in the mouse thalamus at E12.5 as a consequence of deletion of Gbx2 (Mallika et al., 2015). Remarkably, the downregulated genes showed significant enrichment for URD-predicted markers of the caudal thalamus (hypergeometric tests, Bonferroni-correctedP=1.37×10⁻²³), whereas the upregulated genes were significantly enriched for those of the epithalamus (P=2.41×10−05; Fig. 8A,B). This is in agreement with the conclusion that the loss of Gbx2 results in a thalamus-to-epithalamic cell fate change (Mallika et al., 2015). Unexpectedly, we found that the upregulated genes in theGbx2-deficient thalamus were also enriched for rostral pretectum markers (P=4.51×10−05; Fig. 8C). Therefore, this analysis extends our previous findings by showing that the loss ofGbx2causes re-specification of the thalamic fate to a cell fate of rostral pretectum, as well epithalamus. We observed that many genes, such asIrx2,Islr2,Lmo3andEbf3, which were reported to be expressed in thalamus lackingTcf7l2(Lee et al., 2017b), were indeed markers for the rostral pretectum (Fig. 8C). This suggests that loss ofTcf7l2may result in a partial cell fate switch from thalamus to rostral pretectum. Collectively, these observations further support the idea that the formation of the epithalamus, caudal
thalamus and rostral pretectum are closely related in terms of transcriptional regulation.
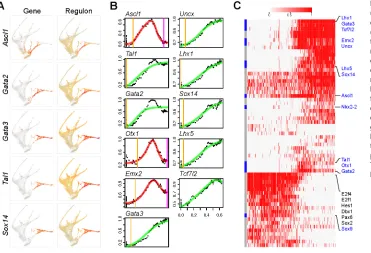
To gain insight into the molecular underpinnings of cell fate decisions, we generated impulse models for transcriptional regulators that exhibited the most dynamic changes in each diencephalic lineage (Fig. S9). We identified 14 such transcription factors associated with development of the rostral thalamus (Fig. 8G). Remarkably, the predicted temporal expression profile of these genes recapitulated their known expression behaviorin vivo
(Delogu et al., 2012; Sellers et al., 2014; Virolainen et al., 2012). It has been demonstrated that many of these proteins play an essential role in GABAergic neuron differentiation in the rostral thalamus or in other brain regions (Achim et al., 2012; Delogu et al., 2012; Lee et al., 2017a; Sellers et al., 2014; Song et al., 2015; Virolainen et al., 2012). Our analyses also revealed dynamic expression of several transcription factors, such asOtx1,Emx2,Six3,Uncx,Nr4a2and
Irx1, without described roles in the rostral thalamus. These genes would be candidates for future genetic studies.
For validation, we focused on the expression of known molecules at the branch point separating the prospective rostral thalamus and prethalamus (Fig. 8H). As expected based on previous studies (Lee et al., 2017a; Sellers et al., 2014; Song et al., 2015; Virolainen et al., 2012), most cells fell along the bifurcation from progenitors into rostral thalamic and prethalamic fates with sequential gene expression changes corresponding to the progression of lineage development (Fig. 8H). Notably, a small fraction of cells that expressedDlx2were found at the early stage of the rostral thalamic lineage, indicating a latent fate plasticity of these cells. Therefore, repression of Dlx2, possibly by Gata2, is important for the commitment of the rostral thalamic fate, as shown previously (Sellers et al., 2014; Virolainen et al., 2012).
Collectively, our analyses have successfully determined the gene regulation dynamics associated with the development of different diencephalic lineages. Our data provide a valuable resource for interrogation of cell fate specification and differentiation in the developing diencephalon.
Examination of transcriptional networks in single cell-resolved trajectories
Next, we investigated how the URD-inferred developmental trajectories are characterized by gene regulatory networks regulated by transcription factors. We applied the single cell regulatory network inference and clustering (SCENIC) (Aibar et al., 2017) pipeline to uncover the gene regulatory network that underlies the cell-state transition in different diencephalon lineages. We first identified sets of genes that were co-expressed with transcription factors using the GENIE3 algorithm (Huynh-Thu et al., 2010). We then applied RcisTarget (Aibar et al., 2017) to select the co-expression modules, called regulons, that exhibited significant enrichment for binding motifs of the corresponding transcription factors. This resulted in 230 regulons in our dataset. The regulon activity in each cell was calculated with the AUCell computational method (Aibar et al., 2017). By fitting regulon activity changes with an impulse model, we determined their temporal dynamics. As expected, sequential changes of regulon activity reflected the expression dynamics of the corresponding transcription regulators remarkably well (Figs 8G, 9A,B). The congruent changes of gene expression and regulatory state provide additional evidence for the important role of these transcription factors in development of the rostral thalamus. We calculated the binary (on or off ) activity of regulons and selected those that were enriched for each lineage (Fig. 9C, Fig. S9A-F). Therefore, by combining URD and gene regulatory network
DEVEL
O
analyses, we uncover the transcriptional cascades that accompany the development of progenitors into differentiated cells, and highlight both previously characterized and newly identified trajectory-enriched genes.
In conclusion, our current study has characterized the molecular and cellular heterogeneity of the developing mouse diencephalon. We have identified the key developmental regulators and their associated regulatory networks that define specific cell lineages. The resulting compendium of gene expression data provide opportunities to use genetic studies to interrogate the mechanisms that control cell fate decisions and cell differentiation in the developing diencephalon. In addition, our
approach of combining multiple state-of-the art statistical tools provides a framework with which we can classify cell types and cell states, study spatial pattern of gene expression, and reconstruct the specification trajectories of highly complex developmental systems with scRNAseq data.
MATERIALS AND METHODS
Generation and maintenance of mouse lines
All animal procedures described herein were approved by the Animal Care Committee at the University of Connecticut Health Center. The generation of
[image:10.612.95.523.54.516.2]Gbx2creER/+(Gbx2tm1.1(cre/ERT2)Jyhl/J, The Jackson Laboratory #022135) mice were described previously (Chen et al., 2009). PCR conditions and primer
Fig. 8. Gene expression cascades involved in the development of different diencephalic lineages.(A-F) Heatmaps showing gene expression dynamics in different diencephalic lineages. Pseudotime increases from left to right. Lineage-specific genes are shown to the right. To the left are the genes that are significantly altered in the thalamus byGbx2deletion (red, upregulated; blue, downregulated; gray ,unchanged). (G) Temporal dynamics of 14 transcription factors that exhibit the most significant changes in the specification of rostral thalamic neurons. Each dot represents the moving-window average of expression levels; the line shows impulse response fitting: blue for genes that change at a constant rate, green for a single sigmoid impulse, and red for a convex impulse; vertical lines indicate the onset (orange) and offset (magenta) of gene expression. (H) Expression of key developmental regulators overlaid on the branch point forming the rostral thalamus (right) and the prethalamus (left), respectively. The dashed arrows indicate the lineage bifurcation and trajectory; the arrowhead shows the presence ofDlx2expression in rostral thalamic cells near the branch point.
DEVEL
O
information are provided at www2.jax.org/protocolsdb/f?p=116:5:0::NO:5: P5_MASTER_PROTOCOL_ID,P5_JRS_CODE:28952,022135. The mouse line was maintained on a CD1 genetic background (Charles River Lab, Wilmington, MA, USA). Noon of the day when a vaginal plug was detected was designated as E0.5 in staging of embryos.
Generation of single cell suspensions
Brains ofGbx2creER/+embryos were dissected in ice-cold PBS. The neural tube was opened after cutting along the dorsal midline. Under a fluorescent dissecting microscope, the thalamus, which was labeled by EGFP expressed from theGbx2locus, was dissected together with surrounding tissues. Tissues from four animals were pooled, cut into pieces smaller than 1 mm across, and transferred to ice-cold MACS Tissue Storage Solution (Miltenyi Biotec). For cell dissociation, the storage solution was exchanged with RPMI 1640 Medium (Thermo Fisher Scientific); tissue was pelleted and digested with 500μl of pre-warmed Accumax (Innovative Cell Technologies) in a 1.5-ml tube at 37°C for 5-10 min. At the end of digestion, the tissue pieces were dissociated by gentle trituration with a wide-bore pipet tip. The cell suspension was strained using a 100-μm cell strainer (Corning), and transferred to 1.5 ml of ice-cold re-suspension buffer (Lebovitz L15 medium with 2% fetal bovine serum, 25 mM HEPES, 2 mM EDTA). The cell clumps that were unable to pass through the filter were placed into a new 500μl pre-warmed Accumax solution, and the digestion and filtering process was repeated twice. Following dissociation, cells were stained with Trypan Blue, and counted and visualized with Countess II Automatic Cell Counter (Thermo Fisher Scientific). The single cell suspension had over 77% viability.
Single cell RNA-sequencing library construction and sequencing Libraries were prepared using the Chromium Single Cell Kit v1 (PN-120233, 10x Genomics) and sequenced on an Illumina NextSeq 500. The raw reads were processed to molecule counts using the Cell Ranger pipeline (version 1.3.1, 10x Genomics) with default setting (Zheng et al., 2017).
Cell clustering and classification
The raw unique molecular identifier (UMI) counts from Cell Ranger were processed with the Seurat R package (version 1.4.0.9) (Satija et al., 2015). Genes that were detected in fewer than three cells were removed. Cells in which over 5% of the UMIs were mapped to mitochondrial genes and those that contained over 2500 genes were discarded. Library-size normalization was performed on the UMI-collapsed gene expression for each barcode by scaling the total number of transcripts per cell to 10,000. The data were then
log2 transformed. In total, 7365 cells and 14,387 genes (an average of 1147 detected genes/cell) were used in cell clustering. On average, we obtained 68,275 sequencing reads per cells, which represented median 1758 unique genes per cells. We followed the standard Seurat workflow as described by the Satiji lab (https://satijalab.org/seurat/) to perform cell clustering and marker gene detection. For direct partitioning of roof-plate cells, we used the new interactive plotting function of Seurat (version >2.0).
For cell-cycle score assignment, Seurat’s‘RunPCA’function was used to perform principal component analysis with a list of cell cycle-dependent genes (Tirosh et al., 2016). The resulting first principal component, which correlated with the activity of known S- and G2/M-phase genes, was referred to as a‘cell-cycle score’. Cells with a cell-cycle score below−3 or above 3 were assigned as S or M phase, respectively.
Examination of spatial structures of scRNAseq data
We created a new Seurat object by extracting clusters 13 and 15 from the full dataset and performed normalization, scaling and t-SNE analyses. As inputs to trendsceek, the positions of the 4261 cells in the t-SNE were used as locations of the points, and the normalized expression matrix was used as marks of the points. We used 10,000 permutations of the marks to obtain the null distribution representing marks being conditionally independent of the spatial location of the cells. We selected significant genes with Benjamini– Hochberg-adjustedP≤0.05 for at least one of the four statistic tests (Edsgärd et al., 2018).
Inference of developmental trajectories
We used Monocle 2 (Qiu et al., 2017) to perform pseudotime analysis. For the caudal thalamus, we generated a new Seurat object by extracting clusters 3, 6, 10 and 15. For the rostral pretectum, we created a new Seurat object by extracting clusters 5, 7, 9 and 16. The resulting Seurat objects were exported to Monocle. We reconstructed the developmental trajectories in these two lineages by following the standard procedure described in the Trapnell lab (http://cole-trapnell-lab.github.io/monocle-release/tutorials/). Temporal gene expression profiles were plotted using the ggplot2 package (Wickham, 2016).
[image:11.612.52.423.58.311.2]To perform URD analysis, we followed the procedure described previously (Farrell et al., 2018). We assigned presumptive apical progenitors (mostly clusters 15 and 16) as the root, and postmitotic neurons (clusters 1-5 and 7) as tips, resulting in a branching trajectory tree. The URD‘aucprTestAlongTree’function was used to identify the‘cascade genes’that were progressively increased along each trajectory. To identify
Fig. 9. Gene regulatory networks underlying caudal thalamic development.(A) Expression of genes (left) and regulons (right) overlaid on the trajectory tree. (B) Temporal changes of regulon activity in association with development of the rostral thalamus. Each dot represents expression level as a moving-window average in pseudotime. The line shows impulse response fitting: green for a single sigmoid impulse, and red for a convex impulse; vertical lines indicate the onset (orange) and offset (magenta) of gene expression. (C) Heatmap showing the binary activity of regulons in the rostral thalamic cells ordered according to pseudotime (increasing from left to right). The URD-identified cascade genes are highlighted in blue.
DEVEL
O
lineage-specific genes, we used all the cascade genes for each lineage and selected those that were highly enriched in the given lineage compared with the rest of the diencephalon. We used the area under the precision-recall curve (AUC) for those genes that were greater than the area expected for a random feature by a factor of 3. To examine the enrichment of lineage markers inGbx2target genes, we performed hypergeometric tests using the R package piano (Väremo et al., 2013).
For the genes identified as members of a gene expression cascade, we used the URD‘geneCascadeProcess’function to smooth their expression using a moving window average (18 cells per window, moving five cells at a time) along the trajectory. The value was then scaled to the maximum window average for each gene in the trajectory. The smoothed expression of each gene was fitted with an impulse model to determine its temporal expression dynamics (Farrell et al., 2018).
WGCNA
To impute dropout values of the scRNAseq expression matrix, we tested three different expression recovery methods by following the recommended procedures: MAGIC (https://github.com/KrishnaswamyLab/ MAGIC#python), SAVER (https://mohuangx.github.io/SAVER/articles/ saver-tutorial.html) and ALRA (https://github.com/KlugerLab/ALRA). Although all methods restored the linear coefficient betweenGbx2andGFP
expression, only ALRA maintained the expected relationship betweenGbx2
andSox14(Fig. S5). SAVER moderately improved the expression matrix. Therefore, we used the ALRA-imputed matrix to produce gene co-expression networks by following the WGCNA procedures described in our previous study (Heng et al., 2017). We used softpower=12 to generate a ‘signed’ WGCNA network for both datasets. Modules were defined as branches of a hierarchical cluster tree using the top-down dynamic tree cut method (Langfelder et al., 2008). For each module, the expression patterns were summarized by the module eigengene, defined as the singular vector of the standardized expression patterns. Pairs of modules with high module eigengene correlations (r>0.85) were merged. The module membership for each gene with respect to each module was then defined as the Pearson correlation between the expression level of the gene and the module eigengene (Oldham et al., 2008). We used the‘modulePreservation’function of the WGCNA package (Langfelder et al., 2011) to calculate the preservation of gene modules across networks with 200 permutations.
Inference of single cell gene regulatory network
We used the SCENIC pipeline (Aibar et al., 2017) to determine the gene regulatory network in each diencephalic lineage. We first applied GENIE3 (Huynh-Thu et al., 2010) to the gene count matrix to construct a co-expression network. As input to GENIE3, we filtered genes with at least three counts in 10% cells, and cells with at least 90.15 UMI, resulting a final matrix of 8320 genes and 7162 cells. We used the‘RcisTarget’algorithm to select potential direct-binding targets (regions) based on DNA-motif analysis, and then the ‘AUCell’ algorithm to calculate the network activity in each individual cell, resulting in an activity matrix in which the columns represent cells, and the rows are regions (Aibar et al., 2017). Using a default threshold, we converted the regulon activity to on/off binary activity matrix, which was then used to produce heatmaps. We examined the temporal changes of regular activity by applying the URD’s ‘geneCascadeProcess’function to the continuous AUC matrix.
In situhybridization and immunohistochemistry
Standard protocols were used for immunofluorescence, and in situ
hybridization, as described previously (Chen et al., 2009). Detailed protocols are available on the Li Laboratory website (https://health.uconn.edu/li-lab/ protocols/). The following antibodies were used: goat anti-Foxa2 (Santa Cruz Biotechnology, sc-6554); mouse anti-Nkx2-2 (Developmental Studies Hybridoma Bank, 74.5A5); rabbit anti-Shh (Santa Cruz Biotechnology, sc-9024); Alexa Fluor secondary antibodies (Invitrogen). To generate riboprobe templates, cDNA of E13.5 mouse brain was used to PCR amplify the 3′end of the target gene, ranging between 500-700 bp with the T7 RNA polymerase recognition site incorporated into the product. Standardin vitro
transcription methods using T7 polymerase (Promega) and digoxigenin-UTP RNA labeling mix (Roche) were used to produce antisense riboprobes.
Acknowledgements
We are grateful to the JAX-UConn Single Cell Genomics Center. We thank Drs Paul Robson and Mohan Bolisetty for their advice and technical assistance in scRNAseq experiments. We also thank Mr Elliott Wilion for language editing and proofreading.
Competing interests
The authors declare no competing or financial interests.
Author contributions
Conceptualization: J.Y.H.L.; Methodology: J.Y.H.L.; Software: J.Y.H.L.; Formal analysis: Q.G., J.Y.H.L.; Data curation: Q.G.; Writing - original draft: J.Y.H.L.; Writing - review & editing: Q.G., J.Y.H.L.; Visualization: J.Y.H.L.; Supervision: J.Y.H.L.; Project administration: J.Y.H.L.; Funding acquisition: J.Y.H.L.
Funding
This work was funded by the National Institutes of Health (R01HD050474 and R01NS106844 to J.Y.H.L.). Deposited in PMC for release after 12 months.
Data availability
The sequencing files and raw gene count matrix have been deposited in NCBI’s
Gene Expression Omnibus and are accessible through accession number GSE122012. All the computer codes and necessary data associated with the manuscript are provided in the supplementary information, and are also available at https://github.com/JLiLab/scRNAseq_Diencephalon.
Supplementary information
Supplementary information available online at
http://dev.biologists.org/lookup/doi/10.1242/dev.174284.supplemental
References
Achim, K., Peltopuro, P., Lahti, L., Li, J. Y. H., Salminen, M. and Partanen, J.
(2012). Distinct developmental origins and regulatory mechanisms for GABAergic neurons associated with dopaminergic nuclei in the ventral mesodiencephalic
region.Development139, 2360-2370.
Aibar, S., González-Blas, C. B., Moerman, T., Huynh-Thu, V. A., Imrichová, H., Hulselmans, G., Rambow, F., Marine, J.-C., Geurts, P., Aerts, J. et al.(2017).
SCENIC: single-cell regulatory network inference and clustering.Nat. Methods
14, 1083-1086.
Bluske, K. K., Kawakami, Y., Koyano-Nakagawa, N. and Nakagawa, Y.(2009). Differential activity of Wnt/beta-catenin signaling in the embryonic mouse
thalamus.Dev. Dyn.238, 3297-3309.
Butler, A., Hoffman, P., Smibert, P., Papalexi, E. and Satija, R.(2018). Integrating single-cell transcriptomic data across different conditions, technologies, and
species.Nat. Biotechnol.36, 411-420.
Chatterjee, M. and Li, J. Y. H.(2012). Patterning and compartment formation in the
diencephalon.Front. Neurosci.6, 66.
Chatterjee, M., Guo, Q., Weber, S., Scholpp, S. and Li, J. Y. H.(2014). Pax6 regulates the formation of the habenular nuclei by controlling the temporospatial
expression of Shh in the diencephalon in vertebrates.BMC Biol.12, 13.
Chatterjee, M., Li, K., Chen, L., Maisano, X., Guo, Q., Gan, L. and Li, J. Y. H.
(2012). Gbx2 regulates thalamocortical axon guidance by modifying the LIM and
Robo codes.Development139, 4633-4643.
Chen, L., Guo, Q. and Li, J. Y. H. (2009). Transcription factor Gbx2 acts cell-nonautonomously to regulate the formation of lineage-restriction boundaries
of the thalamus.Development136, 1317-1326.
de Lau, W., Peng, W. C., Gros, P. and Clevers, H.(2014). The R-spondin/Lgr5/
Rnf43 module: regulator of Wnt signal strength.Genes Dev.28, 305-316.
Delogu, A., Sellers, K., Zagoraiou, L., Bocianowska-Zbrog, A., Mandal, S., Guimera, J., Rubenstein, J. L. R., Sugden, D., Jessell, T. and Lumsden, A.
(2012). Subcortical visual shell nuclei targeted by ipRGCs develop from a Sox14+-GABAergic progenitor and require Sox14 to regulate daily activity
rhythms.Neuron75, 648-662.
Dyer, M. A. and Cepko, C. L.(2001). p27Kip1 and p57Kip2 regulate proliferation in
distinct retinal progenitor cell populations.J. Neurosci.21, 4259-4271.
Edsgärd, D., Johnsson, P. and Sandberg, R. (2018). Identification of spatial
expression trends in single-cell gene expression data.Nat. Methods15, 339-342.
Farrell, J. A., Wang, Y., Riesenfeld, S. J., Shekhar, K., Regev, A. and Schier, A. F.(2018). Single-cell reconstruction of developmental trajectories during
zebrafish embryogenesis.Science360, eaar3131.
Ferran, J. L., Sánchez-Arrones, L., Sandoval, J. E. and Puelles, L.(2007). A model of early molecular regionalization in the chicken embryonic pretectum.
J. Comp. Neurol.505, 379-403.
Ferran, J. L., Sánchez-Arrones, L., Bardet, S. M., Sandoval, J. E., Martı́ nez-de-la-Torre, M. and Puelles, L.(2008). Early pretectal gene expression pattern
shows a conserved anteroposterior tripartition in mouse and chicken.Brain Res.
Bull.75, 295-298.
DEVEL
O
Fietz, S. A., Lachmann, R., Brandl, H., Kircher, M., Samusik, N., Schröder, R., Lakshmanaperumal, N., Henry, I., Vogt, J., Riehn, A. et al. (2012). Transcriptomes of germinal zones of human and mouse fetal neocortex
suggest a role of extracellular matrix in progenitor self-renewal. Proc. Natl.
Acad. Sci. USA109, 11836-11841.
Gui, H., Li, S. and Matise, M. P.(2007). A cell-autonomous requirement for Cip/Kip cyclin-kinase inhibitors in regulating neuronal cell cycle exit but not differentiation
in the developing spinal cord.Dev. Biol.301, 14-26.
Haghverdi, L., Buettner, F. and Theis, F. J.(2015). Diffusion maps for
high-dimensional single-cell analysis of differentiation data.Bioinformatics31, 2989-2998.
Haghverdi, L., Büttner, M., Wolf, F. A., Buettner, F. and Theis, F. J.(2016). Diffusion
pseudotime robustly reconstructs lineage branching.Nat. Methods13, 845-848.
Heng, J. I.-T., Nguyen, L., Castro, D. S., Zimmer, C., Wildner, H., Armant, O., Skowronska-Krawczyk, D., Bedogni, F., Matter, J.-M., Hevner, R. et al.(2008). Neurogenin 2 controls cortical neuron migration through regulation of Rnd2.
Nature455, 114-118.
Heng, X., Guo, Q., Leung, A. W. and Li, J. Y. H.(2017). Analogous mechanism regulating formation of neocortical basal radial glia and cerebellar Bergmann glia.
Elife6, 1324.
Herbert, J., Wilcox, J. N., Pham, K. T., Fremeau, R. T., Zeviani, M., Dwork, A., Soprano, D. R., Makover, A., Goodman, D. S. and Zimmerman, E. A.(1986). Transthyretin: a choroid plexus-specific transport protein in human brain. The
1986 S. Weir Mitchell award.Neurology36, 900-911.
Hikosaka, O. (2010). The habenula: from stress evasion to value-based
decision-making.Nat. Rev. Neurosci.11, 503-513.
Huang, M., Wang, J., Torre, E., Dueck, H., Shaffer, S., Bonasio, R., Murray, J. I., Raj, A., Li, M. and Zhang, N. R.(2018). SAVER: Gene expression recovery for
single-cell RNA sequencing.Nat. Methods15, 539-542.
Huynh-Thu, V. A., Irrthum, A., Wehenkel, L. and Geurts, P.(2010). Inferring regulatory
networks from expression data using tree-based methods.PLoS ONE5, e12776.
Jones, E. G.1. (2007).The Thalamus. Cambridge; New York: Cambridge University Press.
Kalish, B. T., Cheadle, L., Hrvatin, S., Nagy, M. A., Rivera, S., Crow, M., Gillis, J., Kirchner, R. and Greenberg, M. E.(2018). Single-cell transcriptomics of the developing lateral geniculate nucleus reveals insights into circuit assembly and
refinement.Proc. Natl. Acad. Sci. USA115, E1051-E1060.
Kataoka, A. and Shimogori, T. (2008). Fgf8 controls regional identity in the
developing thalamus.Development135, 2873-2881.
Kester, L. and van Oudenaarden, A.(2018). Single-cell transcriptomics meets
lineage tracing.Cell Stem Cell23, 166-179.
Kiecker, C. and Lumsden, A.(2004). Hedgehog signaling from the ZLI regulates
diencephalic regional identity.Nat. Neurosci.7, 1242-1249.
Kiecker, C. and Lumsden, A.(2005). Compartments and their boundaries in
vertebrate brain development.Nat. Rev. Neurosci.6, 553-564.
Langfelder, P. and Horvath, S.(2008). WGCNA: an R package for weighted
correlation network analysis.BMC Bioinformatics9, 559.
Langfelder, P., Zhang, B. and Horvath, S.(2008). Defining clusters from a hierarchical
cluster tree: the dynamic tree cut package for R.Bioinformatics24, 719-720.
Langfelder, P., Luo, R., Oldham, M. C. and Horvath, S.(2011). Is my network
module preserved and reproducible?PLoS Comp. Biol.7, e1001057.
Lee, B., Lee, M., Song, S., Loi, L. D., Lam, D. T., Yoon, J., Baek, K., Curtis, D. J. and Jeong, Y. (2017a). Specification of neurotransmitter identity by Tal1 in
thalamic nuclei.Dev. Dyn.246, 749-758.
Lee, M., Yoon, J., Song, H., Lee, B., Lam, D. T., Yoon, J., Baek, K., Clevers, H. and Jeong, Y. (2017b). Tcf7l2 plays crucial roles in forebrain development through regulation of thalamic and habenular neuron identity and connectivity.
Dev. Biol.424, 62-76.
Linderman, G. C., Zhao, J. and Kluger, Y.(2018). Zero-preserving imputation of
scRNA-seq data using low-rank approximation.bioRxivdoi:10.1101/397588.
Liu, A., Li, J. Y. H., Bromleigh, C., Lao, Z., Niswander, L. A. and Joyner, A. L.
(2003). FGF17b and FGF18 have different midbrain regulatory properties from
FGF8b or activated FGF receptors.Development130, 6175-6185.
Mallika, C., Guo, Q. and Li, J. Y. H.(2015). Gbx2 is essential for maintaining thalamic neuron identity and repressing habenular characters in the developing
thalamus.Dev. Biol.407, 26-39.
Martinez, S., Crossley, P. H., Cobos, I., Rubenstein, J. L. and Martin, G. R.
(1999). FGF8 induces formation of an ectopic isthmic organizer and isthmocerebellar development via a repressive effect on Otx2 expression.
Development126, 1189-1200.
Martinez-Ferre, A. and Martinez, S.(2009). The development of the thalamic motor
learning area is regulated by fgf8 expression.J. Neurosci.29, 13389-13400.
Martinez-Ferre, A., Navarro-Garberi, M., Bueno, C. and Martinez, S.(2013). Wnt signal specifies the intrathalamic limit and its organizer properties by regulating
Shh induction in the alar plate.J. Neurosci.33, 3967-3980.
Miyashita-Lin, E. M., Hevner, R., Wassarman, K. M., Martinez, S. and Rubenstein, J. L.(1999). Early neocortical regionalization in the absence of
thalamic innervation.Science285, 906-909.
Oldham, M. C., Konopka, G., Iwamoto, K., Langfelder, P., Kato, T., Horvath, S. and Geschwind, D. H.(2008). Functional organization of the transcriptome in
human brain.Nat. Neurosci.11, 1271-1282.
Peukert, D., Weber, S., Lumsden, A. and Scholpp, S.(2011). Lhx2 and lhx9 determine neuronal differentiation and compartition in the caudal forebrain by
regulating wnt signaling.PLoS Biol.9, e1001218.
Phillips, J. W., Schulmann, A., Hara, E., Liu, C., Wang, L., Shields, B., Korff, W., Lemire, A., Dudman, J., Nelson, S. B. et al.(2018). A single spectrum of
neuronal identities across thalamus.bioRxivdoi:10.1101/241315.
Puelles, L. and Rubenstein, J. L. R.(2003). Forebrain gene expression domains
and the evolving prosomeric model.Trends Neurosci.26, 469-476.
Qiu, X., Mao, Q., Tang, Y., Wang, L., Chawla, R., Pliner, H. A. and Trapnell, C.
(2017). Reversed graph embedding resolves complex single-cell trajectories.Nat.
Methods14, 979-982.
Quina, L. A., Wang, S., Ng, L. and Turner, E. E.(2009). Brn3a and Nurr1 mediate a
gene regulatory pathway for habenula development.J. Neurosci.29, 14309-14322.
Rendahl, H. (1924). Embryologische und morphologische studien über das
zwischenhirn beim huhn.Acta Zool.5, 241-344.
Robertshaw, E., Matsumoto, K., Lumsden, A. and Kiecker, C.(2013). Irx3 and Pax6 establish differential competence for Shh-mediated induction of GABAergic and
glutamatergic neurons of the thalamus.Proc. Natl. Acad. Sci. USA110, E3919-E3926.
Rosenberg, A. B., Roco, C. M., Muscat, R. A., Kuchina, A., Sample, P., Yao, Z., Graybuck, L. T., Peeler, D. J., Mukherjee, S., Chen, W. et al.(2018). Single-cell profiling of the developing mouse brain and spinal cord with split-pool barcoding.
Science360, 176-182.
Rubenstein, J. L., Martinez, S., Shimamura, K. and Puelles, L.(1994). The
embryonic vertebrate forebrain: the prosomeric model.Science266, 578-580.
Satija, R., Farrell, J. A., Gennert, D., Schier, A. F. and Regev, A.(2015). Spatial
reconstruction of single-cell gene expression data.Nat. Biotechnol.33, 495-502.
Scholpp, S. and Lumsden, A.(2010). Building a bridal chamber: development of
the thalamus.Trends Neurosci.33, 373-380.
Sellers, K., Zyka, V., Lumsden, A. G. and Delogu, A.(2014). Transcriptional
control of GABAergic neuronal subtype identity in the thalamus.Neural Dev.9, 14.
Sherman, S. M.(2007). The thalamus is more than just a relay. Curr. Opin. Neurobiol.17, 417-422.
Smart, I. H.(1972). Proliferative characteristics of the ependymal layer during the early development of the mouse diencephalon, as revealed by recording the
number, location, and plane of cleavage of mitotic figures.J. Anat.113, 109-129.
Song, H., Lee, B., Pyun, D., Guimera, J., Son, Y., Yoon, J., Baek, K., Wurst, W. and Jeong, Y.(2015). Ascl1 and Helt act combinatorially to specify thalamic
neuronal identity by repressing Dlxs activation.Dev. Biol.398, 280-291.
Stegle, O., Teichmann, S. A. and Marioni, J. C.(2015). Computational and
analytical challenges in single-cell transcriptomics.Nat. Rev. Genet.16, 133-145.
Suzuki-Hirano, A., Ogawa, M., Kataoka, A., Yoshida, A. C., Itoh, D., Ueno, M., Blackshaw, S. and Shimogori, T. (2011). Dynamic spatiotemporal gene
expression in embryonic mouse thalamus.J. Comp. Neurol.519, 528-543.
Thompson, C. L., Ng, L., Menon, V., Martinez, S., Lee, C.-K., Glattfelder, K., Sunkin, S. M., Henry, A., Lau, C., Dang, C. et al.(2014). A high-resolution spatiotemporal
atlas of gene expression of the developing mouse brain.Neuron83, 309-323.
Tirosh, I., Izar, B., Prakadan, S. M., Wadsworth, M. H., Treacy, D., Trombetta, J. J., Rotem, A., Rodman, C., Lian, C., Murphy, G. et al.(2016). Dissecting the multicellular
ecosystem of metastatic melanoma by single-cell RNA-seq.Science352, 189-196.
van Dijk, D., Sharma, R., Nainys, J., Yim, K., Kathail, P., Carr, A. J., Burdziak, C., Moon, K. R., Chaffer, C. L., Pattabiraman, D. et al.(2018). Recovering gene
interactions from single-cell data using data diffusion.Cell174, 716-729.e27.
Väremo, L., Nielsen, J. and Nookaew, I.(2013). Enriching the gene set analysis of genome-wide data by incorporating directionality of gene expression and
combining statistical hypotheses and methods.Nucleic Acids Res.41, 4378-4391.
Vieira, C. and Martinez, S.(2006). Sonic hedgehog from the basal plate and the zona limitans intrathalamica exhibits differential activity on diencephalic molecular
regionalization and nuclear structure.Neuroscience143, 129-140.
Vieira, C., Garda, A.-L., Shimamura, K. and Martinez, S.(2005). Thalamic
development induced by Shh in the chick embryo.Dev. Biol.284, 351-363.
Virolainen, S.-M., Achim, K., Peltopuro, P., Salminen, M. and Partanen, J.
(2012). Transcriptional regulatory mechanisms underlying the GABAergic neuron
fate in different diencephalic prosomeres.Development139, 3795-3805.
Wang, L., Bluske, K. K., Dickel, L. K. and Nakagawa, Y.(2011). Basal progenitor
cells in the embryonic mouse thalamus–their molecular characterization and the
role of neurogenins and Pax6.Neural Dev.6, 35.
Wickham, H.(2016).ggplot2: Elegant Graphics for Data Analysis. Cham: Springer.
Zeisel, A., Hochgerner, H., Lönnerberg, P., Johnsson, A., Memic, F., van der Zwan, J., Häring, M., Braun, E., Borm, L. E., La Manno, G. et al.(2018).
Molecular architecture of the mouse nervous system.Cell174, 999-1014.e22.
Zeltser, L. M., Larsen, C. W. and Lumsden, A.(2001). A new developmental
compartment in the forebrain regulated by Lunatic fringe.Nat. Neurosci.4, 683-684.
Zhang, B. and Horvath, S.(2005). A general framework for weighted gene
co-expression network analysis.Stat. Appl. Genet. Mol. Biol.4, Article17.
Zhang, Q., Zhang, Y., Wang, C., Xu, Z., Liang, Q., An, L., Li, J., Liu, Z., You, Y., He, M. et al.(2016). The zinc finger transcription factor Sp9 is required for the
development of striatopallidal projection neurons.Cell Rep.16, 1431-1444.
Zheng, G. X. Y., Terry, J. M., Belgrader, P., Ryvkin, P., Bent, Z. W., Wilson, R., Ziraldo, S. B., Wheeler, T. D., McDermott, G. P., Zhu, J. et al.(2017). Massively
parallel digital transcriptional profiling of single cells.Nat. Commun.8, 14049.