Published Online November 2013 (http://www.scirp.org/journal/cn) http://dx.doi.org/10.4236/cn.2013.54044
Performance Analysis of Adjusted Counter Based
Broadcasting in Mobile Ad Hoc Networks
Muneer Bani Yassein, Balqees Abd Hameed, Wail Mardini, Yaser Khamayseh Department of Computer Science, Jordan University of Science and Technology, Irbid, Jordan
Email: [email protected], [email protected], [email protected], [email protected]
Received June 18, 2013; revised July 18, 2013; accepted July 25, 2013
Copyright © 2013 Muneer Bani Yassein et al. This is an open access article distributed under the Creative Commons Attribution License, which permits unrestricted use, distribution, and reproduction in any medium, provided the original work is properly cited.
ABSTRACT
Mobile Ad Hoc Network (MANET) is a reliable system formed by co-operating and independent nodes that connect and communicate with each other wirelessly without pre-existing infrastructure. In such a network, the easiest way to broadcast the packets to all network nodes is flooding. However, flooding leads to serious drawbacks such as collision, contention and redundant retransmission. These drawbacks are known as the broadcast storm problem. This research proposes an adaptive algorithm in order to decrease the overall network overhead and minimize the problems associated to flooding. Moreover this research concentrates on studying the effect of using different mobility models that provide general idea about nodes movement, status and locations. In particular the performance of Random Waypoint and File mobility models in terms of their effect on network communication is evaluated. Moreover, this research provides per- formance evaluation of different traffic types such as Constant Bit Rate (CBR) and Traffic GEN. Results from Qualnet simulations have revealed that the new proposed algorithm outperforms flooding in terms of different metrics: reducing end-to-end delay in addition to minimizing the normalized routing load and maximizing the packets delivery ratio, in addition to concluding that Traffic GEN outperforms the CBR in terms of throughput. Moreover the CBR traffic has higher delay values than Traffic GEN.
Keywords: MANETs; Mobility; Routing Protocol; Mobility Models
1. Introduction
MANETs are infrastructure-less networks that can be deployed in short time. The easy deployment of nodes and self-organizing nature make MANETs suitable for a broad range of applications. Despite of the advantages of MANET, there are also multiple drawbacks in terms of power limitations, bandwidth limitations and dynami- cally changing topology [1] with high nodes mobility.
In such networks, mobile nodes function not only as a host but also as a router. The nodes movement occurs according to pre-determined parameters that define the nodes speed and nodes pause time. The packets trans- mission process across the network should be accom- plished in such a way that consumes the minimum level of overall network resources and ensures the high level of packets delivery ratio. Flooding is the easiest trans- mission way that achieves high delivery ratio. In the other hand, flooding generates serious drawbacks by con- suming network resources and bandwidth in addition to producing the well-known “broadcast storm problem”
which consists of redundant transmission for the packets, collision and contention.
This research concentrates on providing more effective transmission mechanism by using an adaptive algorithm that aims to alleviate the problems associated with flood- ing. This is achieved by using a counter-based broad- casting technique with a dynamic threshold value in or- der to obtain a high percentage of message reachability to network devices. The algorithm is proposed on the basis of initiating a counter c that is used to count the number of times; a node receives duplicate message and incre- ment that counter by one value for each duplicate re- ceived packet. The adaptive counter based on scheme is used to minimize number of redundant broadcast mes- sages, contention and collision by allowing only specific nodes to participate on broadcast propagation.
works. This paper also concentrates on evaluating the effect of using different mobility models.
The mobility models that are used widely in MANETs are mainly categorized into two types [2]: group-based mobility model, individual-based mobility model. There are different mobility models that can be easily applied to MANET with different applications, such as Random Waypoint, Random Walk, Group, and File mobility models.
Ad Hoc On-Demand Distance Vector Routing Proto- col (AODV) [3] is well known as reactive protocol per- forming well in a wide variety of network topologies especially for those networks that are full of mobility such as MANETs. AODV aims to maintain a path to- wards the destination. Therefore, AODV reduces the overall network traffic by initiating on-demand routing requests. In such protocol there is no need to maintain full information about all nodes in advance, so the routes are discovered whenever needed through initiating route discovery process.
The main characteristics of AODV routing protocol are [3-5] reducing the overall processing overhead, pro- viding effective maintenance capabilities for dynamic topologies, hop-by-hop routing, and loop-prevention ca- pabilities. AODV performs well in order to find a path toward the destination by storing only the next neigh- bors’ information in the routing table. Therefore, AODV has evolved in order to control network performance and its scalability. There are different types of messages used by AODV in order to discover and maintain links. When- ever a source node decides to communicate with a spe- cific destination, firstly the source node checks the rout- ing table for the information related to the path towards that destination. The routing table either contains the desired path or not. In case the path is found, the source node transmits the data to the desired destination. Other-wise, the source node initiates the route discovery proc-ess. In order to perform that process, the source node immediately broadcasts a route discovery packet. Once the Route Discovery packet reaches the desired destina- tion or reaches an intermediate node forward the packet to its destination, the route towards the destination is found. Therefore, the destination initiates a Route Re- play packet towards the originator source either immedi- ately or via intermediate node.
This research evaluated the performance of AODV protocol under two different mobility models [2,6-8]: Random Waypoint and File Mobility Model. We have analyzed the performance of each mobility model with respect to varying number of nodes. The movement of nodes is characterized according to its pause time, mini- mum and maximum speed. The nodes are uniformly dis- tributed between the speed 0 and the maximum speed.
Random waypoint Model (RWP): In this model, the
nodes are placed randomly within the simulation area. Each node in the simulation area starts moving from its original location toward a random location. Whenever the node reaches the target location, it waits for a dura- tion known as “pause time” that is already determined in the mobility model parameters, and then the node moves to another target location. RWP model keeps on repeat- ing the above procedure during the simulation time.
File Mobility Model: In this model, the nodes move- ment occurs according to a file specifying the next posi- tion for the nodes, in addition to specifying the time for nodes arriving to their locations. The movement of nodes occurs in a straight path with constant speed. However, in terms of mobile systems, this type of mobility models performs well in terms of time arrival expectation for the nodes, while all nodes movements are completely de- fined. In the other hand, it’s not widely applicable for highly randomized systems in which the destination po- sitions are not highly known.
The rest of this paper is organized as follows: Section 2 introduces the related work studied in the literature. Section 3 describes simulation setup and performance metrics that we used to evaluate the performance of the proposed algorithm. Section 4 shows the result. Section 5 concludes the work.
2. Related Work
Zhang Qi et al. [9] improves the broadcasting mecha- nism by choosing P depends on the node density either its dense or sparse area. For example, if the node exists in dense area the broadcast probability should be relatively low in order to minimize the number of received dupli- cate packets. On other hand, if the node exists in a sparse area the broadcast probability should be relatively high in order to maximize packet delivery ratio to all nodes re- sides in the sparse area. In this approach the number of received packets used as an indicator of node density.
Muneer et al. [10] examined the performance of an adaptive counter-based scheme with adaptive threshold value in order decrease the drawbacks of simple flooding and increase the reachability percentage gained in the previous work. In this approach, the algorithm proposed to dynamically adjust an adaptive threshold value with three counters in order to gain more successful transmis- sion with minimum rate of delay and overhead.
Harminder Bindra et al. [11] studied the performance of different mobility models over AODV and DSR rout- ing protocols. This study revealed that, AODV outper- forms DSR in most cases when using Constant bit rate (CBR) traffic. However, the DSR performs better when using TCP traffic in some situation (high mobility or high load).
models: Random direction and Random walk. The au- thors studied the performance of the mentioned models in terms of different metrics: routing overhead, packet delivery ratio, average end-to-end delay, and normalized routing load. The simulation result revealed that, the Random Direction has a good result regarding packet delivery ratio and less routing load when the number of nodes increased.
forwarded packets. Since the nodes that participate in the forwarding process will transmit the packet just in case the number of received duplicate packets is less than predefined threshold value. However, in order to perform that condition accurately, we have taking the network density into consideration either its sparse, dense or extra dense areas.
The network density effectively determined by ex- changing the “Hello” control packets. The Adaptive Counter-based Broadcasting Scheme based on idea of initiating a counter c that keeps track of the received packets and therefore counts their number. Another counter threshold defined according to the node neigh- boring status. Since the nodes located in a sparse area has different threshold value than the nodes located in me- dium, dense or even extra dense area.
Shailender Gupta et al. [13] evaluated the effect of us- ing different mobility models such as Random waypoint, File, and Group mobility models on the performance of different routing protocols on MANET. This paper con- cluded that, every mobility model affects the overall per- formance of each protocol according to multiple pa- rameters. Christian Bettstetteret et al. [14] analyze the performance of using Random waypoint mobility model
on nodes distribution and status. The threshold values c1, c2, c3 and c4 assigned to the
sparse, medium, dense and extra dense area respectively. After determine those threshold values according to the neighboring information, the comparison process will take place between the counter c and one of those thresh- old values. Whenever the counter c is less than the thre- shold value, the broadcasting will continue. Otherwise the rebroadcast will inhibit.
3. The Proposed Scheme
Now we will shed a light on the algorithm that proposed to deal with the broadcast storm problem. That’s where the proposed adaptive counter based scheme algorithm came up with an effective solution to network resources consumption and enhance the transmission process by allow subset of nodes participating in the packets for- warding process. Therefore, the remaining network nodes will stay keeping their resources such as batteries, energies and not spend much time to forward the already
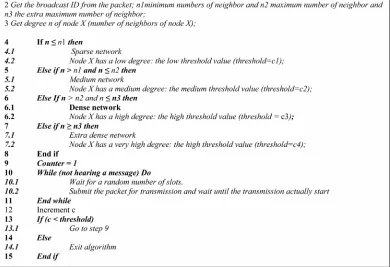
[image:3.595.104.494.452.719.2]The proposed algorithm performs as follows: when- ever a node X heard a broadcast packet m,the node re- broadcast that packet if it’s received for the first time in addition to taking the node density into consideration as
the description bellow where n1, n2and n3 is predefined values and c1< c2< c3< c4:
The node X rebroadcasts the packet according to c1 if the node located in sparse area, which means its neighbor numbers is less than or equal the average minimum number of neighbors n1.
The node X rebroadcasts the packet according to c2 if the node located in medium area, which means its neighbor numbers is greater the minimum number of neighbors n1, and less or equal than the maximum numbers of neighbors n2.
The node X rebroadcasts the packet according to c3 if the node located in dense area, which means its neighbor numbers is greater the maximum numbers of neighbors n2, and less than or equal the extra maximum numbers of neighbors n3.
The node X rebroadcasts the packet according to c4 if the node located in extra dense area, which means its neighbor numbers is greater or equal the maximum numbers of neighbors n3.
Main broadcast function is to deal with a specific packet and decide to rebroadcast it or not according to neighborhood information.
4. Simulation Setup
4.1. Simulation Tool Used
In order to evaluate the performance of the proposed al- gorithm and the two mobility models mentioned above, we compared them using Qualnet simulator. Qualnet simulator provides high scalability, accuracy, speed of simulation and result extracting.
4.2. Performance Metric Used
This work mainly focuses on a various metrics used as follows:
Average End-to-End Delay: measures the average time of delay taken by the successful received packets. This metric includes the overall delay during the route dis- covery, queuing, and retransmissions.
Packet Delivery Ratio: measures the ratio of Total Packets Received by the destination to the Total num- ber of Packets Sent by the source.
Routing Overhead: Defined as the total number of Request Packets initiated and sent by the source dur- ing the simulation time.
Throughput: Defined as the average rate of successful message delivered to the target location over a com- munication channel.
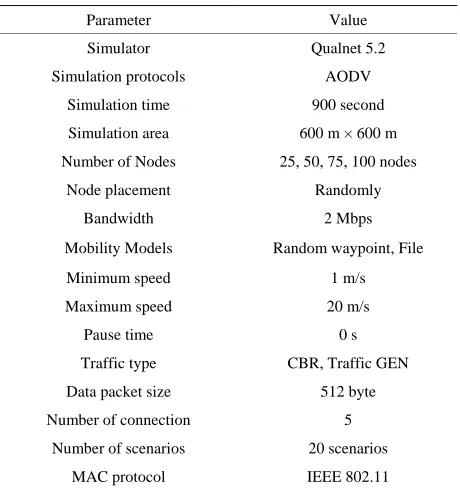
[image:4.595.309.539.100.345.2]4.3. Simulation Parameter
Table 1 shows the various parameters used in the simu- lation process.
Table 1. Simulation parameters.
Parameter Value
Simulator Qualnet 5.2
Simulation protocols AODV
Simulation time 900 second
Simulation area 600 m × 600 m
Number of Nodes 25, 50, 75, 100 nodes
Node placement Randomly
Bandwidth 2 Mbps
Mobility Models Random waypoint, File
Minimum speed 1 m/s
Maximum speed 20 m/s
Pause time 0 s
Traffic type CBR, Traffic GEN
Data packet size 512 byte
Number of connection 5
Number of scenarios 20 scenarios
MAC protocol IEEE 802.11
5. Result and Analysis
Figure 2 shows the average end-to-end delay for the two schemes evaluated. This figure reveals that when the number of nodes increases, the delay is also increases. The reason of that is: whenever the network density be- came large, that means there are more duplicated RREQ packets and therefore more collision and contention problems which may leads to failure in receiving the route request by the destination. Thus, more route request is generated and the delay increased. As seen below, in the blind flooding the number of redundant rebroadcast are high, and as mentioned previously the more redun- dant packets the more collision and more delay. However, the new proposed scheme outperforms the flooding by 70%. The achieved improvement is due to the lower number of redundant rebroadcast and routing load.
Figure 3 depicts the delivery ratio for the two exam- ined schemes when the number of nodes increases. The figure shows that our proposed scheme outperforms the blind flooding in terms of maximizing the PDR. This is due to the fact that our proposed scheme tends to control the packets retransmission process by selecting a subset of nodes to moderate the retransmission. Thus, reducing the traffic load and nodes collision and therefore maxi- mizing the ratio of packets received by the destination.
Figure 2. Average end-to-end delay vs No. of nodes.
Figure 3. Packet delivery ratio vs No. of nodes.
Figure 4. Routing overhead vs No. of nodes.
retransmission. Therefore, saving more control packets from being sent.
Figure 5 reveals the performance of two mobility models used with varying number of nodes in terms of average end-to-end delay over AODV routing protocol. This figure shows that File mobility model has higher end-to-end delay. As seen in the figure that, the delay is increased when the number of nodes increased. The rea- son of that is: as the number of nodes increases the den- sity of area increase. Hence, the delay increases. Figure 6 shows the packet delivery ratio for the two mobility models evaluated under varying number of nodes. This figure reveals that PDR of the RWP mobility model is higher than the File model. As seen in this figure the re- lation between of the number of nodes and the PDR is direct correlation. That is as long as the number of nodes
Figure 5. Average end-to-end delay vs No. of nodes.
Figure 6. Packet delivery ratio vs No. of nodes.
ence, more PDR achieved.
ance of the examined m
e performance of two different tra
e two different tra
6. Conclusions
ed an adaptive algorithm aiming to H
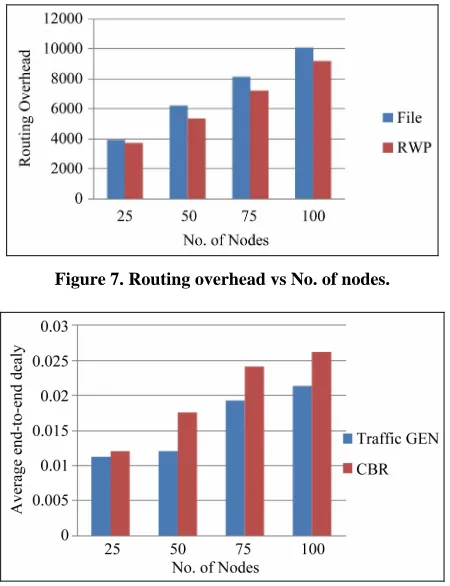
Figure 7 displays the perform
obility models in the terms of routing overhead. This figure reveals that the File mobility model generates more routing overhead. In addition to shows that, as much as the network density increase the more routing overhead generated. Since the more crowded area the more packets transferred.
Figure 8 reveals that th
ffic types with varying number of nodes in terms of end-to-end delay. This figure shows that CBR traffic has higher delay values than Traffic GEN. The delay is in- creased when the number of nodes increased. The reason of that is: as the number of nodes increases the density of area increase. Hence, the delay increases.
Figure 9 presents the performance of th
ffic types in terms of throughput under the effect of different number of nodes. This figure shows that Traffic GEN outperforms the CBR in terms of throughput. As seen in the figure, the value of throughput decreased when the number of nodes increases. The reason is that: as the number of nodes in increases the network gets a high density therefore more contention and decreasing in throughput value.
This paper evaluat
Figure 7. Routing overhead vs No. of nodes.
Figure 8. Average end-to-end delay vs No. of nodes.
Figure 9. Throughput vs No. of nodes.
ased on broadcasting scheme outperforms floodi
as analyzed the effects of some of
ance of dif- fe
fic load in th
ents carried out during this re- se
ion reported in this paper has be
REFERENCES
[1] C. S. R. Murth Hoc Wireless Net-
A Survey of Mobility
and Dis-
b ng in
terms of alleviating the broadcast storm problem: colli- sion, contention and redundant packets transmission. Therefore, it achieves high packets delivery ratio with the minimum level of delay in addition to minimizing the normalized routing load.
Moreover, this paper h
the most important system parameters in MANETs, including two mobility models: Random Waypoint (RWP) and File mobility model over AODV routing protocol. The results concluded that, the RWP mobility model outperforms the File mobility model in terms of packet delivery ratio, routing overhead. In the other hand, File mobility model has higher end-to-end delay.
Furthermore, we have studied the perform
rent traffic types including Traffic GEN and CBR. Re- sults from Qualnet simulations have revealed that Traffic GEN outperforms the CBR in terms of throughput. Hence, the value of throughput decreases when the number of nodes increases. The reason is that, as the number of nodes increases, the network gets a high density, more contention and decreases in throughput value.
In addition to that, we have varied the traf
e network from light traffic to heavy traffic and have varied the traffic type.
The simulation experim
arch have assumed that nodes move according to the random way point model and file mobility model [2,6, 12], which have been widely used in the literature. How- ever, a number of other mobility models have recently been suggested such as the random walk mobility model and group mobility model.
The performance evaluat
en carried out in the context of the AODV routing protocol. Further research could be devoted to investi- gating the performance merits of the routing algorithms for other well-known routing protocols such as Dynamic Source Routing (DSR).
y and B. S. Manoj, “Ad
works: Architectures and Protocols,” Pearson Education, Upper Saddle River, 2004, pp. 2-5.
[2] T. Camp, J. Boleng and V. Davies, “
Models for Ad Hoc Network Research,” Wireless Com- munication and Mobile Computing (WCMC): Special Is- sue on Mobile Ad Hoc Networking: Research, Trends and Applications, Vol. 2, No. 5, 2002, pp. 483-502.
[3] C. Perkins and E. M. Royer, “Ad-Hoc On-Dem
tance Vector Routing,” Proceedings of 2nd IEEE Work- shop on Mobile Computing Systems and Applications, New Orleans, 25-26 February 1999, pp. 90-100.
http://dx.doi.org/10.1109/MCSA.1999.749281
[4] M. Bani-Yassein, M. Ould-Khaoua, L. M. Mackenzie and S. Papanastasiou, “Performance Analysis of Adjusted Probabilistic Broadcasting in Mobile Ad Hoc Networks,”
International Journal of Wireless Information Networks, Vol. 13, No. 2, 2006, pp. 127-140.
http://dx.doi.org/10.1007/s10776-006-0027-0
[5] C. E. Perkins and E. M. Royer, “Ad Hoc On-Demand Distance Vector Routing,” Proceedings of the 2nd IEEE Workshop on Mobile Computing System and Application, New Orleans, 25-26 February 1999, pp. 90-100.
http://dx.doi.org/10.1109/MCSA.1999.749281
[6] N. Aschenbruck, E. Gerhands-Padilla and P. Martini, “A
amp, J. Boleng and V. Davies, “A Survey of Mobility Models for Ad Hoc Network Research,” Wireless Com-
Survey on Mobility Models for Performance Analysis in Tactical Mobile Networks,” Journal of Telecommunica- tion and Information Technology, Vol. 2, 2008, pp. 54- 61.
[image:6.595.63.283.398.529.2]Comparison Study of Routing Proto-
Networks,” The IEEE 58
dcasting Scheme for
Mo-munication & Mobile Computing (WCMC), Vol. 2, No. 5, 2002, pp. 488-502.
[8] A. Abdullah, N. Ramly, A. Muhammed and M. N. Derah- man, “Performance
cols for Mobile Grid Environment,” International Journal of Computer Science and Network Security (IJCSNS), Vol. 8, No 2, 2008, pp. 82-88.
[9] Z. Qi and D. P. Agrawal, “Dynamic Probabilistic Broad-
casting in Mobile Ad hoc th Ve-
hicular Technology Conference (VTC’03), Orlando, 6-9 October 2003, pp. 2860-2864.
[10] M. B. Yassein, S. F. Nimer and A. Y. Al-Dubai, “A New Dynamic Counter-Based Broa
bile Ad Hoc Networks,” Journal of Simulation Modelling Practice and Theory, Vol. 19, No. 1, 2011, pp. 553-563. http://dx.doi.org/10.1016/j.simpat.2010.08.011
[11] H. S. Bindra, S. K. Maakar and A. L. Sangal, “Perform ance Evaluation of Two Reactive Routing Pr
- otocols of
Mehta, “Performance Comparison of
. Rani and B. Bhushan, “Perform- MANET Using Group Mobility Model,” International Journal of Computer Science Issues (IJCSI), Vol. 7, No. 3, 2010, pp. 38-43.
[12] A. Singh and S.
Two Mobility Models Using Aodv,” International Jour- nal of Computer Science Engineering (IJCSE), Vol. 1, No. 1, 2012, pp. 116-124.
[13] S. Gupta, C. Kumar, S
ance Comparison of Routing Protocols Using Different Mobility Models,” International Journal of Modern Edu- cation and Computer Science, Vol. 4, No. 8, 2012, pp. 54-61. http://dx.doi.org/10.5815/ijmecs.2012.08.08
[14] C. Bettstetter and C. Wagner, “The Spatial Node Distri-
/10.1109/TMC.2003.1233531
bution of the Random Waypoint Mobility Model,” IEEE Transactions on Mobile Computing, Vol. 2, No. 3, 2003, pp. 257-269.