http://dx.doi.org/10.4236/ojs.2014.41009
OPEN ACCESS OJS
A Wavelet-Based Method to Measure Stock Market
Development
Adel Al Sharkasi1, Heather J. Ruskin2, Martin Crane2, José Matos3, Sílvio M. A. Gama4 1
Department of Statistics, Faculty of Science, University of Benghazi, Benghazi, Libya 2
School of Computing, Dublin City University, Dublin, Ireland 3
CMUP & Grupo de Matemática Informática, Faculdade de Econmia, Universidade do Porto, Porto, Portugal 4
CMUP & Departamento de Matemática Aplicada, Faculdade de Ciencias, Universidade do Porto, Porto, Portugal Email: [email protected], [email protected], [email protected],
[email protected], [email protected]
Received November 19, 2013; revised December 19, 2013; accepted December 27,2013
Copyright © 2014 Adel Al Sharkasi et al. This is an open access article distributed under the Creative Commons Attribution License, which permits unrestricted use, distribution, and reproduction in any medium, provided the original work is properly cited. In accor- dance of the Creative Commons Attribution License all Copyrights © 2014 are reserved for SCIRP and the owner of the intellectual property Adel Al Sharkasi et al. All Copyright © 2014 are guarded by law and by SCIRP as a guardian.
ABSTRACT
In this paper, we introduce a novel algorithm, based on the wavelet transform, to measure stock market devel- opment. This algorithm is applied to the return series of fourteen worldwide market indices from 1996 to 2005. We find that a comparison of the return series in terms of the quantity of fractional Gaussian noise (fGn), for different values of Hurst exponent (H), facilitates the classification of stock markets according to their degree of development. We also observe that the simple classification of stock markets into “emerging” or “developing” and “mature” or “developed” is no longer sufficient. However, stock markets can be grouped into three catego- ries that we named emerging, intermediate and mature.
KEYWORDS
Wavelet Transform; Hurst Exponent (H); Stock Market Classifications
1. Introduction
There is no precise set of criteria which clearly distinguishes between different stock market types. Therefore, different institutions use different criteria to group countries (or stock markets) by their development level. The World Bank, for example, classifies stock markets into emerging and mature, depending on their national economies using GNP per capita1. This classification is, however, disputable for several reasons not least the fact that most developed countries are still undergoing development and some countries, still considered as “de- veloping”, have graduated to a further stage over time.
In relation to ways in which stock market development can be measured, there is neither a common concept nor a common indicator agreed by Economists. For example, Demirguc-Kunt and Levine [1] compared many different developmental measures, including market size, liquidity, concentration, volatility, institutional devel- opment and international integration, across forty-one countries. Their findings indicated that: 1) small stock markets are less liquid, more volatile and less internationally integrated than larger markets. 2) Richer countries generally are more developed than poorer ones. Exceptions include some stock markets defined as “developing” on the basis of national economy, (e.g. those of the Republic of Korea, Malaysia and Thailand). These show in- dications of maturity stronger than many “mature” markets (e.g. those of Australia, Canada and many European countries).
OPEN ACCESS OJS by using the generalized Hurst approach. They found in particular that a) Deviations from pure Brownian mo- tion behavior are associated with the degree of the market’s development. b) The generalized Hurst exponent (H) is a powerful tool in distinguishing between the degree of development of stock markets with emerging and ma-ture markets having H>0.5 and H<0.5 respectively.
In [4], we have attempted to differentiate, qualitatively, between emerging and mature markets using Principle Component Analysis. In particular, we investigated the behaviour of the first three eigenvalues of the covariance matrices of the return series
(
λ λ λ1, 2, 3)
and the ratios using the wavelet transform and eigenvalue analysis. This, in order to study the reaction of emerging and mature markets to crashes and events, and also to measure the recovery time for these two market types. Our results indicated that mature markets respond to crashes dif- ferently to emerging ones, in that emerging markets may take up to two months to recover while major markets take less than a month to do so. In addition, the results showed that the subdominant eigenvalues(
λ λ2, 3)
give additional information on market movement, especially for emerging markets and that a study of the behavior of the other eigenvalues may provide insight on crash dynamics. We also found that emerging markets show evi- dence of persistent behaviour, while mature markets exhibit anti-persistent behaviour (see also [5]).In our most recent work [5], we suggest a new method based on a time-scale extension of Detrended Fluctua- tion Analysis (TSDFA) in order to study the behaviour of different stock markets in different time periods and at different scale points. Our results implied that there are three groups of stock market: 1) Very mature markets, e.g. UK, US and Japan, which behave in a mature manner for all time and scale points. 2) Emerging markets, e.g. India, Egypt and Sir Lanka, which act as emerging at all time and scale points. 3) Other stock markets, e.g. Canada, which has behaviour which is varied depending on the time period and scale (i.e. emergent for some, mature for others).
Since the Hurst exponent (H) is very sensitive to the stock market stage of development, we, therefore, sug- gest a new algorithm, based on the discrete wavelet transform (DWT) and fractional Gaussian noise (fGn) as- sessed for different values of H, and evaluate its performance here. Investors are interested in knowing market type in order to make the right investment decisions; several studies notably (e.g. [4,6-9]) have reported that
emerging markets consistently behave differently to mature ones. Moreover, for foreign investors, emerging markets are more attractive because of their investment opportunities for making higher returns. However, they are riskier and more volatile due to some of their structural issues, such as foreign debt and political instability, while mature markets are safer, more solid and more stable. Therefore, the investors’ goal is to find a risk-return balance which generates some returns (or profit) with acceptable risk.
The remainder of this paper is organized as follows: the methodology used in this study is described briefly in Section 2, with data and results given in Section 3. The final section provides a discussion of the results and gives principal conclusions.
2. Methodology
2.1. Fractional Gaussian Noise
Fractional Gaussian noise (fGn) series
{
X ii, ≥1}
is a self-similar process that is indexed by the Hurst exponentH (where 0<H<1.) It is the increment of fractional Brownian motion (fBm)2, namely
(
1)
( )
, 1i H H
X = fBm i+ −fBm i i≥ (1) with zero mean, where the auto-covariance function γ
( )
t =E X X(
i i t+)
is given by( )
1(
)
2 2 22 1 H 2 H 1 H , 0
t t t t t
γ = − + − + − ≥
(2)
An important point about γ is that it satisfies
( )
(
)
2 2~ 2 1 H as
t H H t t
γ − − → ∞
(3)
For H<0.5, fractional Gaussian noise (fGn) demonstrates anti-persistent behaviour, where this implies that if a series is down in one period then it is more likely to rebound in the next period. For fGn with H>0.5, long memory or persistent behaviour is demonstrated. If, e.g., a series is down in a given period, then it is likely that in the next period this behaviour will be sustained. The special case of fGn with H=0.5 corresponds to Gaus- sian white noise, representing randomness and implying that the values are uncorrelated. Fractional Gaussian
OPEN ACCESS OJS noise series (fGn), corresponding to different values of H (0.3, 0.4, 0.5, 0.6 and 0.7), have been simulated here using the S-plus function3 in order to compare behaviour with that of the return series of stock market indices.
2.2. Our Wavelet-Based Classification
Several studies (such as: [2-4]) conclude that developing and developed markets exhibit persistent
(
H>0.5)
and anti-persistent(
H<0.5)
behaviour respectively, indicating that the development of a stock market is as- sociated with the change in its behaviour from persistence to anti-persistence. Based on this, we have developed an extended DWT technique, which is described by the following steps:1) We simulate a set of one hundred series of 3000 (each) points of fractional Gaussian noise (fGn) with each
{
0.3, 0.4, 0.5, 0.6, 0.7}
H∈ .
2) For each set, we apply the DWT in order to compute the energy percentage explained by each wavelet component for the 100 series in each set and take the average of these percentages (Table 1).
3) We estimate the energy percentage explained by each wavelet component for the return series of stock market indices (Table 1).
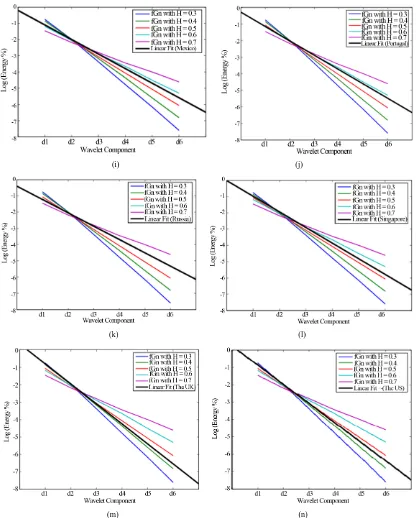
4) The logarithm to base two of the energy percentages4, (log2 (energy%)), explained by the first six compo- nents(d1 – d6), are calculated and plotted in Figure 1.
5) The behaviour of the return series (or that of the linear fit of the returns) is compared with that of the fGn series, for different values of H, in order to group the stock markets.
3. Data and Results
3.1. Data Description
Our empirical analysis is performed on the daily returns of fourteen worldwide market indices which are listed
in Table 2, where Daily Return = ln(Pt/Pt–1), where Pt and Pt–1 are the closing price of the index at day t and t –
1 respectively.
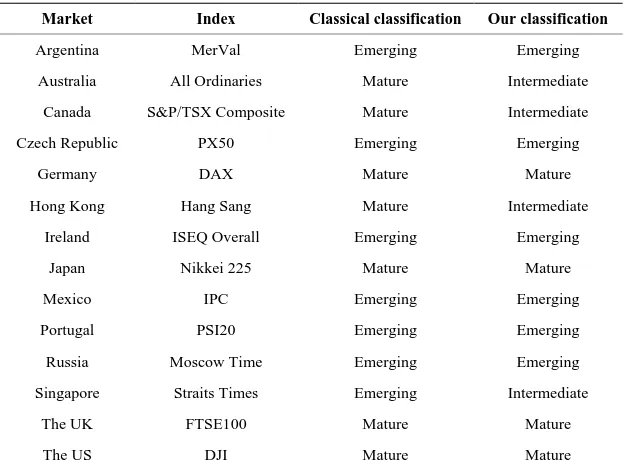
The World Bank classification of stock markets is given in Table 3, with the two basic groups consisting of:
• Emerging: Argentina, Czech Republic, Ireland, Mexico, Portugal, Russia and Singapore.
• Mature: Australia, Canada, Germany, Hong Kong, Japan, the UK and the US.
The energy percentages described by each wavelet component for the daily returns of the fourteen market indi- ces are given also in Table 1. This shows that the first two high frequency components (d1 and d2) explain more than 65% of the energy of these series, implying that movements are mainly caused by short-term fluctuations.
3.2. Empirical Results
The algorithm of Section 2.2, which is designed to measure the degree of development of a stock market, has been applied to fourteen global stock markets listed in Table 1. The results are given in Figure 1. Firstly, we need to clarify the following key points:
• Developing and Developed markets demonstrate persistent and anti-persistent behaviour respectively (with correspondingly, H >0.5 and H<0.5). The expectation, therefore, is that the stock market should move from persistence to anti-persistence as it develops.
• Our new approach allows for variation in H, but a market will fall on one side or another of the well-defined threshold of H=0.5 (Gaussian noise) when it is exhibiting clear persistent or anti-persistent behaviour. Note that these are fixed values of H=H
( )
τ θ, with τ = length of series (number of observations) and θ = number of trading days =1.• The behaviour of the linear fit of logarithms of stock market returns is compared with that of the generated fractional Gaussian noise (fGn) series for different values of H. The straight line fit for the fGn log series versus the wavelet components indicates that the d1 doublet explains the largest percentage of energy, d2 the next largest and so on.
For classification purposes, we compare the behaviour of the linear fit5 of the returns of stock market indices to that of the fractional Gaussian noise (fGn) series with different values of H. From Figure 1, we can see that: 3Simulate. FARIMA (0, d, 0), where d = H – 0.5.
4
Logarithm to base two is used because there are 2j coefficients in the jth wavelet component, where j = 1, 2, ···, 6.
OPEN ACCESS OJS
Table 1. Percentages of energy explained by wavelet components for the daily returns of indices series.
W. component →
market ↓ d1 d2 d3 d4 d5 d6 s6
Argentina 0.462 0.248 0.146 0.057 0.046 0.023 0.019
Australia 0.499 0.230 0.149 0.059 0.032 0.016 0.014
Canada 0.437 0.282 0.146 0.057 0.042 0.011 0.024
Czech Republic 0.440 0.259 0.141 0.073 0.038 0.025 0.023
Germany 0.534 0.221 0.129 0.056 0.034 0.009 0.018
Hong Kong 0.503 0.222 0.147 0.063 0.031 0.017 0.018
Ireland 0.423 0.271 0.146 0.074 0.033 0.025 0.029
Japan 0.530 0.246 0.120 0.052 0.027 0.012 0.013
Mexico 0.445 0.263 0.140 0.075 0.034 0.022 0.021
Portugal 0.413 0.278 0.131 0.081 0.036 0.023 0.038
Russia 0.438 0.261 0.139 0.068 0.036 0.031 0.027
Singapore 0.401 0.268 0.179 0.075 0.036 0.015 0.027
The UK 0.499 0.273 0.124 0.057 0.027 0.009 0.011
The US 0.500 0.264 0.129 0.052 0.032 0.010 0.013
fGn with H = 0.3 0.593 0.251 0.096 0.036 0.014 0.005 0.003
fGn with H = 0.4 0.552 0.252 0.111 0.049 0.021 0.009 0.007
fGn with H = 0.5 0.500 0.250 0.125 0.063 0.031 0.016 0.016
fGn with H = 0.6 0.440 0.242 0.134 0.080 0.044 0.025 0.035
fGn with H = 0.7 0.365 0.220 0.143 0.092 0.063 0.041 0.076
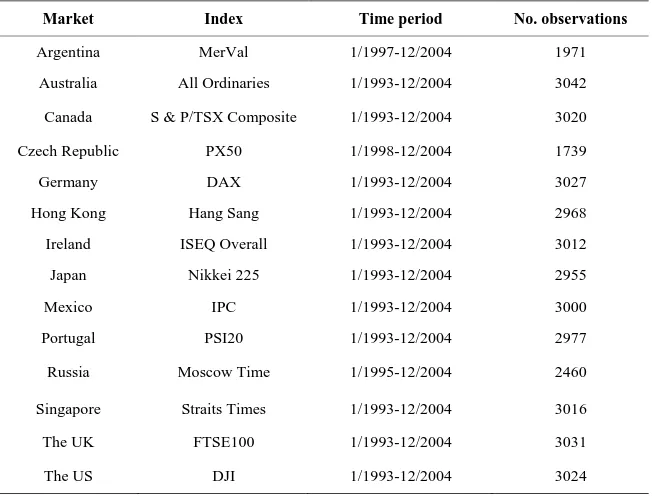
Table 2. The stock market indices.
Market Index Time period No. observations
Argentina MerVal 1/1997-12/2004 1971
Australia All Ordinaries 1/1993-12/2004 3042
Canada S & P/TSX Composite 1/1993-12/2004 3020
Czech Republic PX50 1/1998-12/2004 1739
Germany DAX 1/1993-12/2004 3027
Hong Kong Hang Sang 1/1993-12/2004 2968
Ireland ISEQ Overall 1/1993-12/2004 3012
Japan Nikkei 225 1/1993-12/2004 2955
Mexico IPC 1/1993-12/2004 3000
Portugal PSI20 1/1993-12/2004 2977
Russia Moscow Time 1/1995-12/2004 2460
Singapore Straits Times 1/1993-12/2004 3016
The UK FTSE100 1/1993-12/2004 3031
The US DJI 1/1993-12/2004 3024
[image:4.595.136.462.441.689.2]OPEN ACCESS OJS (a) (b)
(c) (d)
(e) (f)
OPEN ACCESS OJS (i) (j)
(k) (l)
[image:6.595.105.522.83.601.2](m) (n)
Figure 1. The logarithm to base two of the energy percentages (log2(energy%)). (a) Argentinean market. (b)
Australian market. (c) Canadian market. (d) Czech market. (e) German market. (f) Hong Kong market. (g) Irish market. (h) Japanese market. (i) Mexican market. (j) Portuguese market. (k) Russian market. (l) Singapore market. (m) UK market. (n) US market.
2) The Australian market behaves like to fGn with H≅0.5 (or Gaussian noise), meaning that this market has graduated from the emerging group, but is not yet in the mature one (Similarly, Canada, Hong Kong and Singapore).
3) However, the UK market fit is close to that for fGn with H<0.5 (anti-persistent), indicating that it is a mature market, (similar behaviour is demonstrated for the German, Japanese and US markets).
OPEN ACCESS OJS
Table 3. Classical and our new classifications of stock market.
Market Index Classical classification Our classification
Argentina MerVal Emerging Emerging
Australia All Ordinaries Mature Intermediate
Canada S&P/TSX Composite Mature Intermediate
Czech Republic PX50 Emerging Emerging
Germany DAX Mature Mature
Hong Kong Hang Sang Mature Intermediate
Ireland ISEQ Overall Emerging Emerging
Japan Nikkei 225 Mature Mature
Mexico IPC Emerging Emerging
Portugal PSI20 Emerging Emerging
Russia Moscow Time Emerging Emerging
Singapore Straits Times Emerging Intermediate
The UK FTSE100 Mature Mature
The US DJI Mature Mature
persistent (or intermediate memory) manner respectively. However, our classifier indicated that there are other stock markets which lie outside these two groups and show short memory (or independent) behaviour. On this basis, we suggest that stock markets should be classified into three different classes or categories, reflecting common characteristic and implying that stock markets bi-classification is inadequate (Table 3).
4. Conclusions
A novel wavelet-based algorithm was applied to the return series of fourteen stock market indices and the results show that stock market characterisation behaviour (persistent, anti-persistent or short-term) may be determined according to the Hurst exponent associated with its degree of development. This degree of development may be rooted in a number of factors, e.g. market size, liquidity, volatility, global integration, etc. The approach of using fGn and DWT, in particular, allows us to explore the overall behaviour of these markets.
Summarising the findings of this preliminary study, it appears therefore that wavelet-based approaches, in re- gard to stock market evolution/re-classification, show considerable potential. The implications of our method and the analysis performed are that stock markets can be grouped into three categories designated here as
emerging, intermediate (or young mature) and mature (or fully mature) markets. The properties associated with this new classification need to be examined in further detail, but it does seem clear that class 2 is a particularly interesting one due to the possibility of being a new “attractive” stock market type. These markets seem to be- have as Gaussian noise (or a pure random walk) indicating that they are less risky on average than emerging markets but also provide more returns than mature ones. Finally, added value applies in relation to grouping of the stocks themselves, in terms of the market composition (in [10], for example, the authors found that the new clustering, introduced in January 2006, of stocks from the FTSE100 index is more rational than the previous one because stocks from the same group (or sector) are more closely connected than those for the earlier case). This requirement to reclassify is due to rapid changes in individual stocks’ behaviour.
REFERENCES
[1] A. Demirgüc-Kunt and R. Levine, “Stock Market Development and Financial Intermediaries,” The World Bank, Policy Re-search Working Paper No. 1462, 1995.
[2] T. Di Matteo, T. Aste and M. M. Dacorogna, “Scaling Behaviours in Differently Developed Markets,” Physica A, Vol. 324, 2003, pp. 183-188. http://dx.doi.org/10.1016/S0378-4371(02)01996-9
OPEN ACCESS OJS http://dx.doi.org/10.1016/j.jbankfin.2004.08.004
[4] A. Sharkasi, H. J. Ruskin, M. Crane and J. A. M. Matos, “The Reaction of Stock Markets to Crashes and Events: A Compari-son Study between Emerging and Mature Markets Using Wavelet Transforms,” Physica A, Vol. 368, No. 2, 2008, pp. 3910- 3915.
[5] J. A. M. Matos, S. M. Gama, A. Sharkasi, H. J. Ruskin and M. Crane, “Time and Scale Hurst Exponent Analysis for Financial Markets,” Physica A, Vol. 387, No. 15, 2008, pp. 3910-3915. http://dx.doi.org/10.1016/j.physa.2008.01.060
[6] R. Fuss, “The Financial Characteristics between Emerging and Developed Equity Markets,” Proceedings of Policy Modelling International Conference, Brussels, July 2002.
[7] S. Patel and A. Sarkar, “Stock Market Crises in Developed and Emerging Stock Markets,” Federal Reserve Bank of New York, Research Paper No. 9809, 1998.
[8] R. Salomons and H. Grootveld, “The Equity Risk Premium: Emerging versus Developed Markets,” University Groningen SOM Working Paper No. 02E45, 2002.
[9] P. D. Wooldridge, D. Domanski and A. Cobau, “Changing Links between Mature and Emerging Financial Markets,” BIS Quarterly Review, 2002, pp. 45-54.