THE ANALYSIS OF EMOTIONAL RESPONSES EVOKED BY
CLOTHING STYLING
1,2 JIA LÜ, 3 DONGSHENG CHEN*
1
Ph.D. Candidate, College of Textile & Clothing, Jiangnan University, Wuxi, China
2 Fujian Universities Textile Engineering Research Center, Fuzhou, China 3 Prof., College of Clothing & Design, Minjiang University, Fuzhou, China
E-mail: 1,2 [email protected], 3 [email protected] *
ABSTRACT
The present paper demonstrated the different emotional responses between males and females triggered by sportswear styling, using SAM model and ERPs instrument to examine the interactions of human psychological emotions and their brainwave changes which indicate physiological activity of the central nervous system. The main purpose of this paper was to use brain imaging technology to recognize the differences of “inner” emotions between males and females from brain wave signals, and to examine the interactions of human’s psychological emotion dimensions and psychophysiological responses. Results indicated that males and females had similarity and inconsistency for the emotional response of different styling of clothing. The advantage over traditional methods of measuring emotion evoked by clothing, like self-reports is that they leave out the psychological and physiological biases of Emotions. The study’s findings should provide valuable information and reference to fashion designers, consumers and clothing manufacturers for future product design and development.
Keywords: Human-computer interaction; Emotional fashion design; Emotion dimension; Event-related
potentials (ERPs)
1. INTRODUCTION
Clothing is a form of communication for expressing human individuality, emotion, status, social position, and information surrounding their circumstances. The function of expressing emotions of clothing is associated with a corresponding aesthetic process and psychological process arising from objective things and human’s needs, including experiences (such as the subjective feeling about happiness, sadness or hate), physiological action (such as the neural activity of cortex, peripheral and central nervous system changes, etc.) and expression (such as facial expressions, posture, movement, etc). Therefore, well-designed clothing should not only satisfy requirements, but should also satisfy consumers’ psychological needs, such as emotional needs [1]. Different clothing styling could evoke consumer’s positive (interest, pleasure) or negative (disgust, unpleasure) responses. These responses refer to the brain activities in particular situations. Emotional stimuli evoked scalp-recorded brain potentials. Explored and analysis these emotions
could help us to understand human perception, cognition, affect and formulate design decision-making by empirical research.
brassiere and a newly devised low skin-pressured brassiere) on the autonomic nervous system (ANS) activities [4].
Based on this situation, the present paper concentrated on using a direct communication pathway between the maid-brain and an external device to quantitatively describe the emotions evoked by clothing styling, and associated with brain-computer science and psychophysiology to assess the emotional responses of the sportswear from the males and females viewers. The main purpose of this research was to use brain imaging technology to recognize the differences of “inner” emotions between males and females from brain wave signals, and to examine the interactions of human’s psychological emotion dimensions and psychophysiological responses by compared the emotional dimension of self-reported results with real-time brain wave data. This research detected emotional cues occurring during event-related potentials (ERPs) techniques. ERPs are a non-invasive method of measuring brain activity during cognitive processing, and could provide extremely high time resolution, in the range of one millisecond [5]. The advantage of this technique is that they are able to directly access the primary response to an emotional stimulus (revealed in the brain activity). It is a new method for fashion design that related the brain science research methods to the quantitative study of clothing visual emotion.
2. METHODS
2.1 Subjects
Twenty healthy college students (10 males, 10 females) aged 19-23 years (mean: 20.2) from different majors (e.g., design, finance, psychology, marketing, management, electronic, etc) of Minjiang University participated this study. All subjects were asked to abstain from drinking, eating, smoking, exercise for at least three hours before the experiment, and keep good rests.
2.2 Stimulus
The stimuli were 15 different uniforms of Minjiang University. To ensure the comparability, the basic styling was 165/84XL sportswear with cotton/polyester fabric, long-sleeved coat with zipper in the front and straight sports pants. Taken the front photograph by one model whose height was 165cm and worn white shoes. Set the brightness, contrast, pixel size and other attributes of stimulus pictures to the same value using Photoshop CS (Adobe). Each picture was numbered
1-15 and resized to fit 800 pixel×1200 pixel frame and saved as bmp file.
2.3 Procedure
2.3.1 psychological responses measure
The present experiment used Self-Assessment Manikin (SAM) rating system devised by Lang (1980) to assess the psychological responses of emotions from the aspect of pleasure, arousal, and dominance [6]. Nine-point rating scale were used for each dimension. Rating was scored such that 9 represented a high rating on each dimension (e.g., high pleasure, high arousal, high dominance), and 1 represented a low rating on each dimension (e.g., low pleasure, low arousal, low dominance), 5 represented the center segment of the scale. Explained the definition of pleasure, arousal, and dominance to the subjects before the experiment and make sure they fully understood the concept and evaluation criteria for each assessment. Each subject viewed the pictures one by one and assessed the scores. This experiment emphasized the first feeling of themselves. There was no right or wrong answers.
2.3.2 physiological responses measure
Physiological responses mainly measured the real-time brainwaves of each subject using EEG/ERP recording and analysis system of Neuroscan company on a dedicated recording computer. The stimuli presented through another dedicated stimulating computer with E-prime software for time and stimuli control.
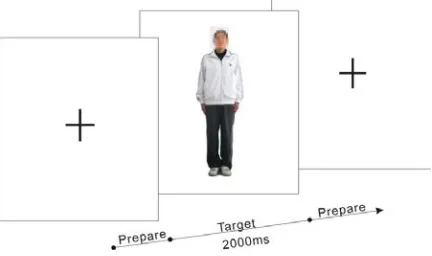
Each picture was perceptually random within a sequence, lasted 2000ms and occurred 10times. Each stimulus made mark in E-prime software, and then sent synchronization makers directly to the recording computer (Figure. 1). The subjects did not judge their emotional reactions while viewing the pictures, just concentrated on each picture.
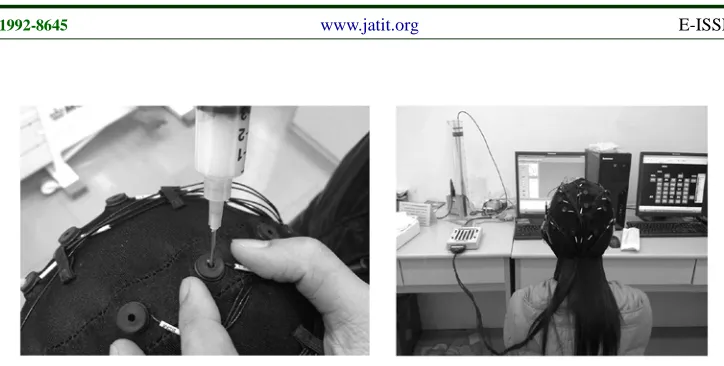
[image:2.612.313.529.469.597.2]The amplifier collected the stimulating codes and brainwaves at the same time. ERPs were recorded using an electrode cap from nine key sites (F3, Fz, F4, C3, Cz, C4, P3, Pz, P4) according to the International 10-20 Electrode system. All channels were recorded use both mastoids (A1, A2) as a reference electrode and Gnd channel as a ground electrode. Vertical and horizontal eye movements (VEOG, VHOG) were recorded also. All electrodes impedances were maintained below 5 kΩ. DC mode sample data, sample rate was 1000Hz/channel, high pass was 0Hz, low pass was 100Hz. Figure 2 showed a participant shortly before the start of the experiment.
2.4 Date Analysis
Mean factor scores for each picture (averaged all subjects) on each of the factors of pleasure, arousal and dominance were calculated using statistics analysis. Off-line analysis of the recorded brainwaves data used Scan 4.3 software. The analysis course began 100ms before onset of stimuli, and continued until 1900ms after the onset of the stimuli. Set 20 blinks of vertical EOG and each blink continued 400ms and horizontal EOG continued 800ms to remove the electric current of eye’s activities in the experiment. Following eye movement correction procedure, corrected baseline and rejected artifact. Then, averaged and flitted ERPs waveforms separately for each valence category and electrode site. At last, averaged the ERPs waveforms of all subjects (Figure.3).
3. RESULTS
3.1 Descriptive Statistics Analysis of
Psychological Responses
The data of descriptive statistics analysis for pleasure, arousal and dominance are present in figure 4 use line chart. After average each dimension value of all male subjects and female
[image:3.612.115.477.69.252.2]subjects, it is shown that the relationship between pleasure and arousal presents two kinds of trends. One showed pleasant and arousal presented positive correlation, the other showed negative correlation. But pleasant and dominance were positive correlation. When the value of pleasure was high, the value of dominance was high also. Oppositely, the value of pleasure was low with the decrease of
[image:3.612.88.526.495.596.2]Figure 2. A Participant Shortly Before the Experiment
dominance. The standard deviation of these two dimensions were approximated.
In addition, for males, No.5 & No.14 had the lowest arousal and dominance, No.15 had the highest pleasure, meanwhile, following the highest arousal and dominance, it demonstrated that this styling had higher wearing and consuming desire. And for females, No.8 had the lowest pleasure, arousal and dominance, No.3 & No.15 had the highest three dimension, It demonstrated that this styling had higher wearing and consuming desire. It indicated that males and females had similarity and inconsistency for the emotional response of different styling of clothing.
3.2 ERPs Data Analysis of Physiological Responses
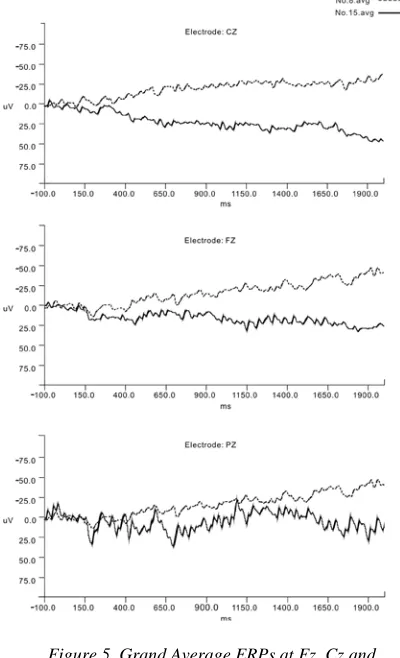
[image:4.612.91.279.120.355.2]Based on SAM results, we choosed the styling with the highest value in SAM model(No.15) and one of the lowest value(No.8) of Fz, Cz, and Pz to do ERPs data analysis. Used Scan4.3 software to average the brainwave data of all subjects (Figure.5). The amplitude and latency of ERPs components provide information regarding the strength and time course of underlying neural processes [7]. For pleasure and arousal, the largest change of brainwave was observed at Fz (Frontal), intermediate at Cz (Central), and the least at Pz (Parietal). For all area measures, different pleasure and arousal influenced amplitudes from 150ms after
different styling appearance. The styling with the highest value in SAM model presented last slow potentials(LSP)from 150ms to the end of stimulate in forehead area, and correlating with its high pleasure and arousal. LSP is followed by an extended positive slow wave associated with the processing of emotional pictures. Different pleasure and arousal presented different going of amplitude from 650ms in the middle of brain. Lower value in SAM model presented a early negative peak at 100ms and subsequent negative going lasted to the end of stimuli.
4. DISCUSS
4.1 Psychological Responses of Emotion
[image:4.612.311.511.244.573.2]The value of dominance getting higher following the value of pleasure was high. Oppositely, the value of pleasure was low with the decrease of dominance. It is demonstrated that emotion dimensions showed positive correlation between pleasant and dominance evoked by clothing styling. Therefore, the pleasure of emotion could be as an index of evaluate consume desire.
Figure 4. Line Chart of SAM Model Assessment
4.2 Physiological Responses of Emotion
Pleasure stimulating factors primarily modulated ERPs component amplitudes, with little changes in peak latency observed. Arousal effects were consistently obtained, and generally occured at longer latencies. Valence effects were inconsistently reported at several latency ranges, including very early components. That means amplitudes reflected the excited extent of brain, latentperiods reflected the speed and time of emotional activity and process.
4.3 The Relationship Between Psychological and Physiological Responses
The changes of three dimensions were basically consistency with the ERPs amplitudes. Higher pleasant and arousal reflected the higher excited extent of brain, and the bigger amplitude of ERPs in the middle of forehead area. Therefore, self-assessment could provide effectively reference for physiological measurement of emotion.
4.4 Styling Analysis of Clothing
It was showed that males and females had similarity and inconsistency for the emotional response of different clothing styling from the experimental analysis,. They all pay more attention on No.15 which had simple styling with light-colored, and looks neatly, comfortably and youthfully. Furthermore, the male students were inclined to green and linear decoration. For female college students, they paid more attention on the styling which had the color of red match white, green match white, and focus on simple styling.
5. CONCLUSION
Based on the present study, we demonstrated that visual evoked emotion with clothing styling could be measured through combine the interactive relationship between self-assessment and real-time brain potentials data. The research proposed a new scientific research method of clothing field, and provided scientific guidance for future trend and development of fashion design.
ACKNOWLEDGEMENTS:
This research was supported by Soft Science Program sponsored by Fujian Provincial Department of Science and Technology (2011R0073).
REFERENCES:
[1] F. P. Jean, Y. Bernard, “Measuring consumer perceptions for a better comprehension, specification and assessment of product semantics”, International Journal of Industrial Ergonomics, Vol. 33, No.6, 2004, pp.507–525. [2] C. Yoko, I. Kumiko, K. Etuko, “The image
formed and the feeling produced by clothing colors--from the relation to the comfortable factor observed in electroencephalography”,
Journal of home economics of Japan, vol. 55, No.11, 2004, pp. 845-851.
[3] Y. Horiba, M. Kamijo, S. Hosoya, et al, “Evaluation of tactile sensation for wearing by using event related potential”, Fiber, vol. 56, No.1, 2000, pp. 87-94.
[4] M. Aya, M. Tamaki, M. Sachiko, et al, “Effects of clothing pressure caused by different types of brassieres on autonomic nervous system activity evaluated by heart rate variability power spectral analysis”, Journal Physiological Anthropology Applied Human Science, vol. 21, No.1, 2002, pp. 67-74.
[5] K. O. Jonas, N. Steven, S. Henrique, et al, “Affective Picture Processing: An Integrative Review of ERP Findings”, Biological Psychology, vol. 77, No. 3, 2008, pp.247–265. [6] M. Margaret, M. M. Bradley, P. J. Lang,
“Measuring emotion: the self-assessment manikin and the semantic differential”, Journal of Behavior Therapy and Experimental Psychiatry, vol. 25, No.1, 1994, pp. 49-59. [7] T. S. Harald, F. Tobias, S. Jessica, et al,