AN EVOLUTIONARY PROGRAMMING APPROACH TO
OPTIMIZE SYNCHRONOUS GENERATOR INPUT POWER
USING AREA-BASED TRANSIENT STABILITY INDEXES
1
H. HASHIM, 2I. Z. ABIDIN, 3I. MUSIRIN, 4KEEM SIAH YAP, 5Y. R. OMAR, 6M. R. ZULKEPALI 1
Senior Lecturer, Department of Electrical Engineering, UNITEN, Malaysia
2Assoc. Prof., Department of Electrical Engineering, UNITEN, Malaysia 3Assoc. Prof., Department of Electrical Engineering, UITM, Malaysia 4Senior Lecturer, Department of Electrical Engineering, UNITEN, Malaysia 5
Senior Lecturer, Department of Electrical Engineering, UNITEN, Malaysia
6Electrical Engineer, Tenaga Nasional Berhad, Malaysia
E-mail:[email protected], [email protected], [email protected],
4[email protected],5[email protected]
,
6[email protected]ABSTRACT
Stable operation of a power system requires a continuous match between energy input to the prime movers and the electrical load of the system. Any change of load demand must be accompanied by a corresponding change in terms of the amount of energy prime mover given to the turbine system. When a power system is subjected to significant transient disturbances, the machine may lose synchronism to the system. If this were to happen, the machine’s rotor angle will undergo wide variations, voltage and frequency may deviate widely from normal values.This paper presents the applications of Area-Based Transient Stability Indexes (TSI): COI Angle and COI Speed as a new technique to evaluate the impact of disturbances to power system stability and to optimize the mechanical input power of synchronous generators in order to prevent transient instability in a power system using Evolutionary Programming (EP) approach. Transient analysis is carried out using PSSE software on IEEE 118 Bus Test System at system conditions with various types of loads, static and dynamic. The optimization of the input power to generator is carried out using transient stability indexes as fitness functions for a three area IEEE 30 Bus and IEEE 118 Bus Test Systems respectively. Results obtained from the experiment revealed that the EP approach is able to give an optimal solution.
Keywords: Area-Based Transient Stability Indexes: COI Angle and COI Speed, Optimization, Evolutionary Programming
1. INTRODUCTION
Transient stability is concerned with the ability of the power system to be in equilibrium when subjected to a severe disturbance [1]-[3] such as major fault on transmission facilities, large loss of load or generation. These types of fault may cause a large amount of kinetic energy being imposed to the power system, which will result to large flow of fault currents and variation of torque experienced by the machine concerned. When the difference between the mechanical input power to a generator,
Pm and the electrical output power, Pe is significant, an unbalanced torque may act on the rotor, which causes the generator to either accelerate or decelerate. In another word, the generator’s operating point may oscillate as such its oscillation
may lead to out-of-step or loss of synchronism due to the large excursion of generator rotor angle [1], [3]-[6]. The system is in a state of transient instability if one or more generators fall out of step with respect to the rest of the system [7]-[8]. If the mechanical input power does not rapidly match the electrical power load demand, the turbine speed of the generator will not be at its optimal speed; hence, system parameters will be affected, frequency and voltage will deviate from their nominal values. The impact is propagated in the respective power system network.
papers and journals used classical equal area criteria based on the accelerating and decelerating energies to analyze an out of step condition. However, some may monitor the variation of apparent impedance viewed at a line or generator terminals as a function of system voltages and angular separation between the systems. It is formulated during a loss of synchronism either between two system areas or between a generator and a system. Reference [7] applied a modified time domain equal area criterion technique to discriminate between stable and out-of-step swings based on the local voltage and current information available at the relay location while [8] detected an out-of-step phenomenon based on the variation of resistance, the behavior of the impedance loci.
Neural network is another method to identify the unstable out-of-step based on rotor angle excursion [9]: if the rotor angle of the generator under study reaches 180° within 1s the system is classified as unstable with a given stability index of 0, otherwise the sample is classified as stable, and it is given a stability index of 1. This method considered three factors: the pre-fault loading of the generator or the mechanical input power Pm; the generator kinetic energy deviation the instant of fault clearing; and the average acceleration during fault. An out-of-step condition can also be classified based on the three characteristics of the separation interface tie-lines [10]: first, the active power on these lines crosses zero and oscillates periodically; second, the existence of out-of-step center point on the separation interface, whose voltage fluctuation amplitude is significantly larger than that of other points; third, the reactive power flows into the interior from both sides of the separation interface. Similarly, reference [11] tracked the changing of the voltage oscillation center through synchrophasor measurements to detect the synchronism loss as an adaptive power system separation criterion.
An angular excursion of instantaneous voltage values can be translated into angular velocity and angular acceleration and used to detect an out-of-step condition [12]. A protective relay that applies this concept is more sensitive compared to distance relay, which applies impedance variation principle. Center of Inertia (COI) reference frame [3]-[5] is being widely used in transient stability analysis for various specific objective(s) and approaches including to monitor, evaluate and predict system stability, improve transient stability, optimize power flow, design a controller for STATCOM,
and split the system network [2], [13]-[21]. Important parameters such as angle, speed, power are converted to COI frame to derive a first swing stability index as an additional output quantity from the time domain simulation [13]. Reference [2] uses transient stability index as a new transient stability forecast, which can predict both transient stability status and tripped units. The values of measured rotor angles in the COI coordinates values, at fault clearing time and a few cycles after fault clearing time are considered as the input information of the forecast process. will determine the chances of saving or losing synchronism.
For a large power system it is easier to track the system stability based on the stability of interconnected areas where generators’ rotor angles in the system are being assessed based on area [13]-[14]. This reference introduced area-based Center of Inertia (COI) referred Transient Stability Index that represents a group of generators in the respective area to assess the stability of the system, focusing on the COI-referred rotor angles. The difference between this paper and reference [14] in terms of power system stability analysis is this paper evaluates the impact of disturbances in power system with different types of loads, static and dynamic loads using Area-Based: TSI COI Angle and TSI COI Speed. Nevertheless, reference [14] focused only on the COI-referred rotor angles. With TSI COI Speed included in the transient stability analysis, the evaluation becomes more firm to signify the dynamic state with the fact that a multi-machine system is in synchronism with all the machines turning at a constant speed [4]. Hence, the transient stability analysis in this paper includes the TSI COI Speed of the synchronous generators, which at the same time reflects the frequency of the system.
The angular and frequency stabilities are governed by two fitness functions: TSI COI Angle and TSI COI Speed respectively while voltage stability is being controlled by the constant and control variables. The algorithm is tested using three area system on two test systems: IEEE 30 Bus Test System with 6 generators and IEEE 118 Bus Test System with 28 generators.
Two optimization engines have been developed to optimize TSI COI Angle and TSI COI Speed, making them a single objective optimization implemented separately. Results obtained from the experiment revealed that the EP approach is able to give an optimal solution. The comparative studies are conducted with respect to the conclusions obtained from transient stability analysis on IEEE 118 bus test system so as to validate the acceptable numerical values for system stability analysis implemented using EP.
2. AREA-BASED:TSICOIANGLEANDTSI
COISPEED
Synchronism assessment among generators when the system is subjected to disturbances can be made by looking into the variation of rotor angle [2]. The system is not stable if the rotor angle of a generator increases with respect to the rest of the system. Similarly, the angular velocity can be translated to system frequency. For a multi-machine system, Area-Based TSI COI Angle and TSI COI Speed are common transformation used in transient stability analysis [4] being derived based on the swing equation.
(1)
Where M is the moment of inertia of the machine, δ is the electrical power angle, Pm is the mechanical power and Pe is the electrical power. The indexes shown in equation (2) and equation (6) relate to the rotor angle and angular speed of a particular area of a power grid and are based on an equivalent inertia representing the total inertia of the generators located in that area. The indexes are derived from the classical machine model by assuming that the dynamic behavior of generators in the system [3]-[5]. If the indexes calculated show an out of step condition after the fault is cleared, the system is considered to be in an unstable condition. In addition, if the multi-machine system is in synchronism with all the machines turning at a constant speed, the system frequency is equal to the dynamic frequency (possibly above or below the steady state speed, ωs) [4]. The COI reference transformation defines the COI Angle and COI Speed instead of referring to the angle of a specific machine. The COI reference transformation defines the TSI COI Angle as [14]: (2)
(3)
(4)
(5)
Where N is the number of generator, MT is the total system inertia, δi is the individual rotor angle, is the area equivalent rotor angle of each area, is the COI Angle of the system while r is total number of areas in a power system. The COI reference transformation defines the TSI COI Speed as: (6)
(7)
(8)
Where ωi is the individual rotor speed, is the area equivalent rotor speed and is the COI Speed of the system.
3. OPTIMIZATION OF MECHANICAL
INPUT POWER
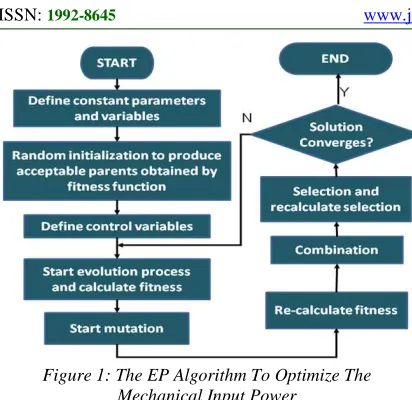
Figure 1: The EP Algorithm To Optimize The Mechanical Input Power
The problem formulation is based on the two equations derived by [1]:
(9)
(10) The fitness functions are based on Area-Based TSI COI Angle and TSI COI Speed taking into consideration the fault clearance time, which depends on the system voltage [23]. The criteria for system stability are the TSI COI Angle must be within ±180º and the TSI COI Speed is within certain limit depending on the tolerance of system frequency. With these two constraints, the fitness functions for TSI COI Angle and TSI COI Speed are formulated.
4. TEST SYSTEM
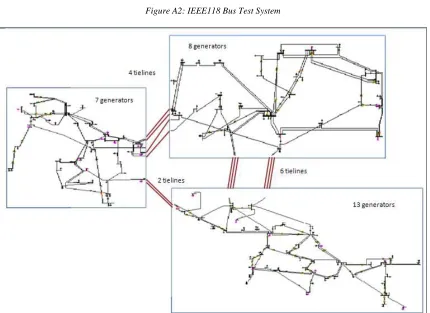
Two IEEE test systems are used in this paper: IEEE 30-Bus and IEEE 118-Bus test systems. IEEE 30 bus test system as shown in Figure A1 in the Appendix consists of 6 generators in 3 Areas, 40 lines including 7 tie-lines. IEEE 118-Bus Test System consists of 28 generators, 118 buses and 186 transmission lines. Figure A2 in the Appendix shows that this large network is divided into three areas, namely: Area 1 has 13 generators, Area 2 with 8 generators and Area 3 consists of 7 generators respectively based on geographical. Different types of power plants are modeled namely: hydro, coal and gas and they are connected to static loads and/or dynamic loads using PSSE software. The characteristic of rotor angle for each machine in the respective area with respect to randomly selected reference machine was plotted
during pre-fault, fault and post-fault conditions. To evaluate the stability of the system, data obtained from the simulation results were used to calculate the stabilityindexes. If the TSI COI Angle is within ±180º and the TSI COI Speed is very low, the system is in stable condition; however, if the TSI COI Angle exceeds ±180º [4], [14]-[15] and the TSI COI Speed is large, then the system is in an unstable condition.
In addition, the Evolutionary Programming based on the algorithm in Fig. 1 is implemented on a 3 area system that consists of 6 generators with two generators in each area: G1 and G2 in Area 1,
G3 and G4 in Area 2; G5 and G6 in Area 3. Results
obtained from both methods are analyzed using TSI COI Angle and TSI COI Speed.
5. RESULTS AND ANALYSES
The processed results obtained from transient analysis study on the IEEE 118-Bus Test System are used to validate the acceptable numerical values for system stability analysis implemented using EP.
5.1 PSS®E Simulation on IEEE 118-Bus Test System
Findings from the two case studies of transient study analysis are presented to show the applications of TSI COI Angle and TSI COI Speed. Case 1 shows the scenario for generators in synchronism. A fault was applied at Bus 49 with a fault clearance time of 100ms [23]. Figure 3 to 5 illustrate the behavior of the rotor angles in each area. All the generators other than Generator 49 are in synchronism at each area. The generators’ rotor angles settled at values which are lower than 90° in less than 10 seconds with small oscillation while generator 49 losses synchronism and its rotor angle infinitely increases.
[image:4.612.313.527.580.693.2]Figure 4: Generators’ response in Area 2 for a fault at Bus 49 in Area 2 – Case 1.
Figure 5: Generators’ response in Area 3 for a fault at Bus 49 in Area 2 – Case 1.
Table 1 tabulates the TSI COI Angle and TSI COI Speed respectively calculated at 20 seconds. The TSI COI Angle at each area is lesser than ±180°, which proves the system is in stable condition and reflects that the generators in Area 1, Area 2 and Area 3 are operating in synchronism.
Table 2 demonstrates that the TSI COI Speed is very low, which implies that this multi-machine system is in synchronism with all the machines in each area turning at almost a constant speed, either slightly above or below the steady state speed, ωs.
Hence, the system frequency is almost equal to the dynamic frequency. Thus, Table 2 supports the analysis made from Table 1, which indicates that the system is stable.
Table 1: Case 1 - TSI COI Angle at t = 15s for Bus 49 Fault with Dynamic Load
Table 2: Case 1 - TSI COI Speed at t = 15s for Bus 49 Fault with Dynamic Load
The stability of the system is further confirmed by analyzing the graphical illustrations of TSI COI Angle, TSI COI Speed and Accelerating Power for the three areas as in Figure 6 - 8: the graphs of TSI COI Angle versus time are at low values, lower than ±180°; the graphs of TSI COI Speed versus time are converging and similarly with the graph of Accelerating Power versus time.
Figure 6: Plots of TSI COI Angle for Bus 49 Fault with Dynamic Load
Figure 7: TSI COI Speed for Bus 49 Fault with Dynamic Load
Case 2 exhibits the phenomena when generators are out of synchronism. Bus 80 was disconnected due to a fault occurred in the system and cleared after 100ms. Fig. 8 to 10 demonstrate the behavior of the rotor angles in each area. Most of the generators in Area 1 are out of synchronism while the rotor angle of Generator 80 increases infinitely. In contrast, all generators in Area 2 and Area 3 remain in synchronism with small signal oscillations due to the occurrence of severe fault in the system.
Figure 9: Generators’ response in Area 1 for a fault at
Bus 80 Fault with Dynamic Load - Case2.
Figure 10: Generators’ response in Area 2 for a fault at
Bus 80 Fault with Dynamic Load – Case 2
Figure 11: Generators’ response in Area 3 for a fault at Bus 80 Fault with Dynamic Load – Case 2
Table 3 and Table 4 tabulate the value of Area-Based TSI: COI Angle and COI Speed respectively calculated at 15 seconds. The Area-Based TSI: COI Angle at each area is exceeding ±180°, which indicates that the system is unstable.
Table 3: Case 2 - TSI COI Angle at t = 15s for Bus 80 Fault with Dynamic Load
The values of Area-Based TSI: COI Speed are multiple times higher than the values in Table 2, which further emphasize that the system is in unstable condition.
T
he system frequency is not equal to the dynamic frequency.Table 4: Case 2 - TSI COI Speed at t = 15s for Bus 80 Fault with Dynamic Load
Figure 12 – 15 show the plotting of TSI COI Angle, TSI COI Speed and Accelerating Power of the three areas being plotted for 15 seconds for faults at Bus 80. The graphs of Area-Based TSI: COI Angle in Figure 11 shows that the system is out of synchronism with COI Angle in each area increases to value above ±180º.
Figure 12: TSI COI Angle for Bus 80 Fault with Dynamic Load – Case2
Figure 13: TSI COI Speed for Bus 80 Fault with Dynamic Load – Case2
[image:7.612.91.305.295.410.2]The Accelerating Power in Figure 14 proves that the rotor angles oscillate rapidly depending on the extent of the unbalance between the mechanical input power, Pm and the electrical output power of the generator, Pe.
Figure 14: Accelerating Power for Bus 80 Fault with Dynamic Load – Case2
5.2 Optimization of Mechanical Input Power for IEEE 30Bus Test System using Evolutionary Computation
Simulations are carried out using TSI COI Angle and TSI COI Speed as fitness functions in the optimization algorithm of mechanical input power to synchronous generator using EP. Samples of the results are tabulated in this paper to demonstrate the consistency of the results for different number of samples and test systems.
•
Case1 consists of 3 control variables ofrandomly different scenarios with fault clearance time of 100ms and fitness functions of:
- Change in frequency of zero and ± 0.5Hz respectively.
- Stability limit angle of ±180° and ±120° respectively. An angle stability limit is set at 120° in order to allow the system to have sufficient stability margin [2].
•
Case 2 are meant for 3 control variables of randomly different scenarios with fault clearance time of 150ms and fitness functions of:- Change in frequency of zero and ± 0.5Hz respectively.
- Stability limiting angle of ±180° and ±120° respectively.
[image:7.612.313.527.303.470.2]The results for optimization process to minimize the TSI COI Angle and TSI COI Speed for 3 control variables for 20 populations are tabulated. These output data in terms of control variables are then used to calculate the TSI COI Angle and TSI COI Speed to verify the validity of the results. Case 1 provides the same set of output for each different scenario irrespective of zero change in frequency or ±0.5Hz and stability limiting angle of ±180° or ±120°. The summary of the results are tabulated in Table 5 and Table 6.
[image:7.612.315.528.505.673.2]Table 5: Case 1 – Area-Based TSI COI Angle: Angle< ±180°; Frequency = 50Hz and t=100ms
Table 6: Case 1 – Area-Based TSI COI Speed: Angle< ±180°; Frequency = 50Hz and t=100ms
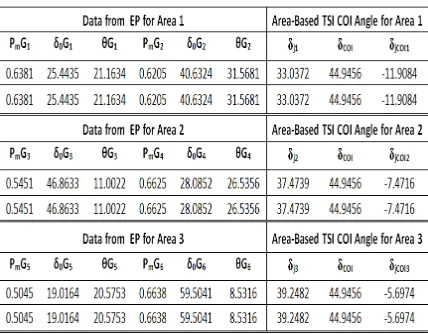
and Table 8 illustrate the results for fault clearance time of 150ms. The output of the algorithms remains to be within the acceptable range as before; however, due to the delay in the setting of fault clearance time by 50ms from Case 1, the values of TSI COI Angle and TSI COI Speed increase compared to Case 1 but still within the acceptable range.
Table 7: Area-Based TSI COI Angle; Fault Clearance Time of 150ms
Table 8: Area-Based TSI COI Speed; Fault Clearance Time of 150ms
If the critical clearance time needs to be longer due the performance of circuit breaker and/or the constraint of the communication system; for example, a total clearance time of 150ms based on circuit breaker clearance time of 100ms and communication time of 50ms, then the initial operating condition needs to be changed. From these findings we can deduce a conclusion that in addition to the initial operating condition of the
system, fault clearance time also plays an important role in keeping the system stable.
5.3 Optimization of Mechanical Input Power for
IEEE 180Bus Test System using
Evolutionary Computation
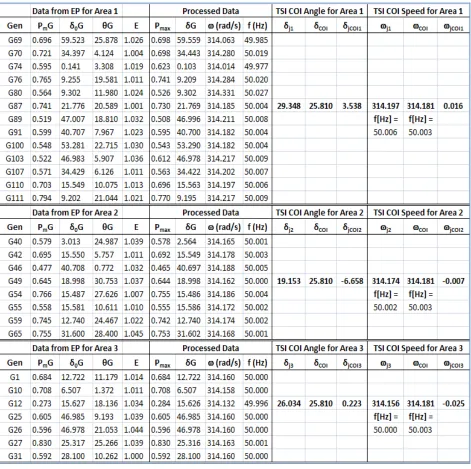
The algorithm is further tested on IEEE118 Test System with 4 control variables for 20 and 40 populations. Table A1 in the Appendix tabulates the results of the algorithm for 28 generators with a limiting angle set to ±180° and 50Hz frequency; similar results are obtained for a limiting angle of ±120° and 50Hz frequency for 20 and 40 populations. It is proven that the multi-machine in IEEE118 Bus Test System is in synchronism with all the machines turning at a constant speed; the system frequency is equal to the dynamic frequency either above or below the steady state speed, ωs [4].
6. CONCLUSIONS
This paper presents a novel contribution using Evolutionary Programming (EP) approach to optimize the mechanical input power in order to prevent transient instability in the system. The findings discovered from the experiment reveal that EP approach is able to give an optimal solution on the mechanical input power to synchronous generator and within the boundary of transient stability limit in terms of voltage, angle and frequency. While maintaining the system voltage and frequency within the acceptable limits, this approach helps to optimize the usage of fuel in generating power and also in managing the spinning reserve in power system.
REFERENCES:
[1] Hadi Saadat, Power System Analysis. Second Edition, New York:McGraw-Hill, 2002.
[2] Amjady, N.; Banihashemi, S.A.; Transient
Stability Prediction of Power Systems by a New
Synchronism Status Index and Hybrid
Classifier. Generation, Transmission &
Distribution, IET Volume: 4 Issue: 4, Page(s): 509 – 518, 2010.
[3] Kundur, P. Introduction to the Power System
Stability Problem – Basic Concept and Definitions, Mid-term and Long-Term Stability.
Power System Stability and Control: 33-34, McGraw-Hill.1994.
[4] Sauer P. W and M. A. Pai, Power System
[5] Machowski, J.; Bialek, J W.; Bumby, JR. Power
System Dynamics Stability and Control. 2nd
Edition, John Wiley & Sons, 2008.
[6] Hayes, K.F.; Rovnyak, S.M.; Lingyan Sun; Khaliq, A.; Thyagarajan,S.; Neural networks using apparent resistance for out-of-step relaying. Power Engineering Society Winter Meeting, Volume: 1. 2002 IEEE, Page(s): 459 – 463.
[7] Paudyal, S.; Ramakrishna, G.; Sachdev, M.S.;
Application of Equal Area Criterion
Conditions in the Time Domain for Out-of-Step Protection. Volume: 25, Issue: 2. 2010,
Page(s): 600-609.
[8] Billinton, R.; Kuruganty, P.R.S. A probabilistic Index for transient Stability.
Power Apparatus and Systems, IEEE Transactions on Volume: PAS-99 , Issue: 1 1980. Page(s): 195 – 206.
[9] Abdelaziz, A.Y.; Irving, M.R.; Mansour, M.M.; El-Arabaty, A.M.; Nosseir, A.I.; Adaptive
protection strategies for detecting power system out-of-step conditions using neural networks. Generation, Transmission and
Distribution, IEE Proceedings- Volume: 145. 1998 , Page(s): 387 – 394.
[10] Chao Wang; Peng Gao; Taoxi Zhu; Wei Shao;
New method of searching for the out-of-step separation interface based on reactive power.
Transmission and Distribution Conference and Exposition, 2008. T&D. IEEE/PES. Page(s):1-5
[11] Li Li; Yutian Liu; Out-of-step splitting framework based on adaptive separation detecting criterion. Transmission & Distribution Conference & Exposition: Asia and Pacific, 2009 Page(s): 1 – 5.
[12] So, K.H. ; Heo, J.Y. ; Kim, C.H. ; Aggarwal, R.K. ; Song, K.B. ; Out-of-step detection
algorithm using frequency deviation of
voltage. Generation, Transmission &
Distribution, IET. 2007 Page(s): 119-126
[13] Tang, C.K.; Graham, C.E.; El-Kady, M.; Alden, R.T.H. Transient Stability Index from Conventional Time Domain Simulation. Power Systems, IEEE Transactions on Volume: 9, Issue: 3 1994, Page(s): 1524 – 1530.
[14] A. W. Noor Izzri, A. Mohamed, Area-Based
COI-Referred Transient Stability Index for Large-Scale Power System. International
Journal of Power, Energy and Artificial Intelligence, No.1, Vol. 1. August 2008.
[15] Zulkepali, M.R.; Hashim, H.; Omar, Y.R.; Abidin, I.Z.; Yusof, S.; An Evaluation on Transient Stability of Power System using Transient Stability in Static and Dynamic Environment”APACEEE2010, CIRED. [16] Fabozzi,D.; Van Cutsem,T. On Angle
References in Long-Term Time-Domain
Simulations. Power Systems, IEEE
Transactions on Volume: PP , Issue: 99 2010 , Page(s): 1 – 2.
[17] Cheung, K.W.; An Improved Transient
Stability Index for Dynamic Security
Assessment Using a Marginally Unstable Injection (MUI) Approach. Power Engineering
Society Winter Meeting, 2000. IEEE Volume: 2 2000, Page(s): 931 - 936 vol.2. [18] Jun Qi; Guangzeng Wang; Quanyuan Jiang;
Yijia Cao Decentralized nonlinear excitation
control based on wide-area measurements.
Power Systems Conference and Exposition, 2009. PSCE '09.IEEE/PES 2009, Page(s):1–5. [19] Tangpatiphan, K.; Yokoyama, A. Evolutionary
Programming Incorporating Neural Network for Transient Stability Constrained Optimal Power Flow. Power System Technology and
IEEE Power India Conference, 2008. POWERCON 2008. Joint International Conference on 2008, Page(s): 1 – 8.
[20] Mariotto, L.; Pinheiro, H.; Cardoso, G.; Morais, A.P.; Muraro, M.R. Power systems
transient stability indices: an algorithm based on equivalent clusters of coherent generators.
Generation, Transmission & Distribution, IET Volume: 4, Issue: 11 2010, Page(s): 1223 – 1235.
[21] E. O. Schweitzer, III, D.E. Whitehead, A. Guzman, Y. Gong, and M. Donolo, Advanced
Real-Time Synchrophasor Application.
Journal of Reliable Power, 2008.
[22] PM Anderson. Power System Protection. McGraw-Hill. 1999.
[23] TNB Transmission Division, Protection and
Control Code of Practice (COP), Second
APPENDIX
[image:10.612.93.523.395.708.2]Figure A1: IEEE30 Bus Test System