PERFORMANCE ANALYSIS OF WLAN UNDER VARIABLE
NUMBER OF NODES USING THE ADJUSTABLE
PARAMETERS IN EDCA
1A.ANITHA, 2J.JAYAKUMARI
1
Asst.Prof. , Department of Computer Science and Engineering, Noorul Islam Centre for Higher Education, Kumaracoil, Tamilnadu, India
2Prof. & Head, Department of Electronics and Communication Engineering Noorul Islam Centre for Higher
Education, Kumaracoil, Tamilnadu, India
E-mail: [email protected], [email protected]
ABSTRACT
This paper deals with the performance analysis of WLAN under variable number of nodes using the adjustable parameters such as TXOPLimit, CWmin, CWmax and AIFS in EDCA. The comparative analysis is done by varying the number of nodes and the adjustable Access Category (AC) parameters in the EDCA access mechanism. The throughput and delay parameters of the QoS are measured. The simulation is done using the Network Simulator NS-2.28 tool in RedHat Linux environment. The simulation results obtained gave a better performance improvement using the adjustable altered parameters in EDCA access method than the existing methods. The high TXOP Limit gave a better performance increase than the other parameters.
Keywords: DCF, EDCA, TXOP Limit, QoS, Access Category
1. INTRODUCTION
Wireless Local Area Networks (WLANs) [8] are expanded tremendously for the support of Multimedia applications. For the transmission of multimedia applications the QoS parameters like increase in throughput and minimum access delay are the important parameters. The WLANs are specified by IEEE 802.11 standard. The 802.11 standard deployed many standards such as 802.11a, 802.11b, 802.11e, 802.11g etc. Among all the standards the 802.11e [8] is the standard which directly supports QoS in the wireless networks using MAC protocols. The IEEE 802.11e standard defines the protocols to enable multimedia applications, traffic prioritization, high speed bursting of data. The IEEE 802.11 MAC protocols use the Distributed Coordination Function (DCF), causes overhead which degrades the throughput.
To improve this issue Transmission opportunity mechanism in EDCA [10] is used. It is a scheme in IEEE 802.11e standard. TXOP is, after a station gains the channel multiple consecutive frames can be transmitted within the burst. The station can transmit the frames consecutively within the occupancy time called TXOP Limit. In this paper with the TXOP Limit and the adjustable parameters are altered and the performance of the WLAN network is analysed. For different set of nodes the
packets are transmitted and the QoS parameters are measured. Based on the measured parameters the performance is analysed. The results obtained produced better performance than the existing methods.
The rest of the paper is organized as follows: Section II explains the previous research which surveys the past approaches of the 802.11e standard. Section III the proposed work which explains the methods used in this paper. Section 1V is with the Results and Discussion which analyses the performance of the parameters used in this paper and the Section V concludes the paper.
2. PREVIOUS RESEARCH
Bianchi [1] proposed a scheme which is based on Distributed Coordination Function. The nodes used were finite and the throughput was analysed under
the DCF mode of transmission. Peng et al [2]
Jelena Misic et al [3] proposed an EDCA method with single hop wireless networks. This method used a maximum of 5 nodes. The TXOP bandwidth is allocated sequentially in a frame-by-frame fashion until maximum TXOP Limit is reached. In this method the higher priority nodes gets more chance for transmitting than the lower priority nodes. Under high loads the maximum TXOP allocation is achieved and under low loads most nodes transmit only single frames.
Suong H Nguyen et al [4] proposed an EDCA mechanism which investigated the interaction between the saturated and the unsaturated sources. The saturated sources are the non- real time sources and the unsaturated sources are the real time sources. Here the TXOP Limit, CWmin, CWmax parameters are adjusted and the performance is analysed. The AIFS parameter is assumed same for all the stations. For the large TXOP Limits the throughput decreases. For the saturated sources, the collision probability increases and the throughput decreases. For the unsaturated sources, the collision probability increases and the delay decreases.
Jelena Misic et al [5] proposed an EDCA method to investigate the TXOP values affect the
boundaries between the saturation and
nonsaturation condition. This method also aimed to improve the performance under bursty arrival. Here single hop network with 5 nodes are considered. In saturation condition the buffersize of every station is set as 32KB which results in the buffer overflow of all the stations, leads to performance degradation. In nonsaturation condition, the throughput is increased for a large TXOPLimit, which increases the medium utilization. In nonsaturation condition the lower priority nodes has given more chance to access the TXOP period.
Geyong Min et al [6] proposed an EDCA method to investigate the impacts of traffic loads, TXOP Limits and number of stations under different channel conditions. Here two channel conditions good, bad conditions are considered. .Under this scheme the throughput and buffer overflow is analysed under NS-2 environment A maximum of 10 stations are considered. If the number of station is 5, then there is no buffer overflow and the network works under light load and the performance is equal to the DCF.If the number of station is 10, the throughput is increased by 17% and the buffer overflow is decreased by 60%.If the number of stations is increased above 10, the throughput is decreased under both good and bad state conditions, the collision probability is higher than the channel errors.
Tainaka et al [7] proposed a method to analyse the performance of DCF and EDCA methods for the IEEE based multihop networks. Here the overhead caused by the DCF mechanism is reduced by the TXOP mechanism used. The throughput is analysed for both DCF and EDCA mechanism under bursty transmission. In this method in the TXOP period the nodes have the right to access occupies the medium a large period of time which leads to the queue overflow of other nodes waiting for the medium to access. This overflow of frames of the waiting nodes deteriorates the performance of the multihop networks.
3. PROPOSED WORK
This work deals with the performance
improvement of the WLAN under different sets of nodes using the EDCA mechanism with the adjustable parameters and compares the results with the DCF mechanism of 802.11e WLANs. For each set of increasing nodes the DCF mechanism is analysed. Then for the same set the EDCA access method is analysed. Then to improve the performance of the network the adjustable EDCA parameters such as CWmin, CWmax, AIFS, TXOPLimit are adjusted and the QoS parameters are measured. The EDCA has four Access Categories (ACs) [9] for the different data traffic sources. Each AC has a set of four parameters. The priorities of the ACs are called as User Priorities (UP) and it is assigned according to the type of traffic or application of the arrived frame belongs to. The priority ranges from 0 to 7.The priority is assigned at the higher layers and it can be assigned by the user using the application which should be compatible with 802.11e standard. The CWmin for AC_VI and CWmax for the AC_VO can be calculated using equation 1.The CWmin for the AC_VO is calculated using equation 2.Using the default and the altered parameter values the DCF and the EDCA access methods are performed in our transmission and the QoS parameters such as throughput and delay is measured and analysed.
CWmin/CWmax = (CWmin+1)/2 + 1 (1)
CWmin = (CWmin+1)/4 - 1 (2)
fair performance improvement in our different set of nodes in 802.11e standard but the TXOP Limit gains the top.
From the analysis, increasing the CW values decreased the collision rate which in turn increased the delay and decreased the throughput. The increase in TXOP increases the throughput for increasing number of nodes.
4. RESULTS AND DISCUSSION 4.1. Performance Analysis
The performance is evaluated using ns- 2.28 simulator in a Red Hat Linux environment. The simulation set up is done by setting the grid as 1000X1000, the packet size is 2030 byts, topology used is mesh topology. The nodes in the network are allowed to communicate with each other and the nodes are able to communicate with other nodes in the network. For each set of nodes the DCF access method is analysed and the QoS parameters are measured. First the analysis is done by 10 nodes. Then the nodes are increased to 15 and the analysis is done. Likewise the nodes are increased till 50 nodes as a multiple of five and the analysis is done for each access method and the differentiation parameters. Then the QoS parameters for each set of nodes are analysed and concludes which parameter set method suits for the particular set of nodes. The parameters of the default EDCA access method is shown in Table 1. Table 2 is the set of parameter values taken by decreasing the CWmin and CWmax values. The increased CWmin and CWmax values used for the analysis are shown in Table 3. The AIFS values are altered and are shown in Table 4. Table 5 gives the parameter values used for the analysis by increasing the TXOP Limit.
4.1.1. Throughput analysis
The throughput analysis is first done for 10 nodes. The simulation results of DCF method shows that while transmitting data with minimum number of nodes it gives a fair throughput. Then for EDCA method the throughput is increased 4% than the DCF method. Then the analysis is done by altering the adjustable parameters. Thus first we decreased the CW and the result shows that decrease in CW increases the throughput with the parameters as in Table 2. Then we increased the CW values as per Table 3 which gave a decrease in throughput than the EDCA method but increase in DCF method. Then the analysis is done by increasing the TXOP Limit value as in Table 5. The first increase in TXOP Limit gave the same value as EDCA method. But when the TXOP values are further increased the throughput value started
decreasing. Then the analysis is done by altering the AIFS value. An increase in AIFS value gave an increase in throughput than DCF method but less then EDCA method.
For 15 nodes the throughput using EDCA method is increased 10% than the DCF method. While decreasing the CW values the throughput started decreasing. An increase in CW values gave a 3% increase in throughput than the EDCA method thereby a total increase of 13% than the DCF access method. But for high CW value we obtained a decreased throughput value. From this we noticed that for 15 nodes, an increase in CW value increases the throughput of the network. The increase in TXOP Limit gave a decrease in throughput but achieved a fair one. While altering the AIFS values a moderate decrease in the throughput is attained. Thus for 15 nodes the moderate increase in CW values gave a better throughput.
Then we analysed for 20 nodes by using the same parameter set. The EDCA method gave only a 3% increase in throughput than the DCF method. It gave a decrease in throughput than the EDCA method while decreasing the CW values. For an increase in CW values the throughput increased gradually and for high CW values it gave a high increase in throughput than the EDCA method. For an increase in TXOP and AIFS gave a decrease in throughput than the DCF method. Thus for 20 nodes the increase in CW value gave a best result.
For 25 nodes, 7% increase in throughput is obtained by the EDCA method than the DCF method. The decrease in CW values gave a decrease in throughput. But when the CW value is slightly increased we achieved a throughput increase of 9% than the DCF method. Then for a high CW value we obtained a 12 % increase in throughput than the DCF method. Then for increase in TXOP and AIFS gave a decrease in throughput but not worse than DCF method.
Table 1 : Default EDCA Parameters in IEEE 802.11e
Method Paramet
ers AC 0 AC1 AC2 AC3
EDCA Default parameter method
AIFS
(µs) 2 2 3 7
CWmin
(ms) 7 15 31 31
Cwmax
(ms) 15 31 1023 1023
TXOP Limit(s)
0.0003 264
0.0060
[image:4.612.83.302.237.414.2]16 0 0
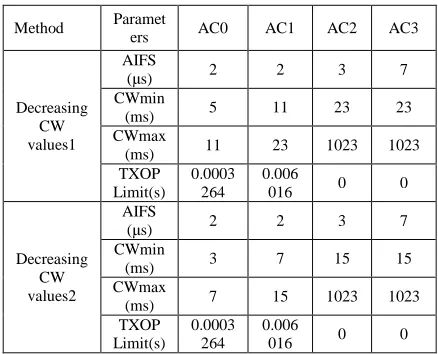
Table 2 : Parameters with decreased CWmin and CWmax
35 nodes gave a 5% increase in throughput than the DCF method. The throughput is decreased when the CW values are decreased and it is good than the DCF method. For an increase in CW value, we obtained an increase in throughput than the EDCA method and it started decreasing for high CW values but it gave a fair result than the DCF mechanism. Then for the increase in TXOPLimit 35 nodes gave an increasing throughput and are the maximum throughput value. An increase in AIFS gave a constant throughput value for all change which is fair than the DCF method.
For 45 nodes, the EDCA method gave an increase in throughput than the DCF method. The decrease in the CW values gave a moderate increase in throughput .The small increase in CW value increased the throughput and further increasing the CW values decreased the throughput but not below DCF method. The increase in TXOP Limit and AIFS too gave a fair increase in throughput.
For 50 nodes, EDCA method gave better throughput than DCF method. When we decreased the CW values the throughput decreased and increased for small CW values. A small increase in CW values from default value gave a high
throughput than EDCA method. But for higher values of CW there is a gradual decrease in throughput. An increase in TXOP Limit gave a constant increase in throughput than EDCA default method. Increase in AIFS gave a gradual decrease in throughput.
From the simulation results we have studied that the EDCA access method is the best method than the DCF access method in the IEEE 802.11e WLAN network. From the adjustable parameters we have noticed that the TXOP Limit adjustments are best suited for the 45 nodes and 50 nodes. From the results, we have studied that the increase in TXOP Limit is best suited for the high number of nodes. The minimum CW values are best suited for minimum number of nodes. The high CW values are best suited for medium number of nodes. The AIFS values give a fair result for all type of networks.
The Figure 1 shows the comparison of DCF and the EDCA default parameters for the different types of node network i.e., 10,15,20,25,30,35,40, 45 and 50 nodes. The figure 2 shows the analysis by the same set of node networks by decreasing and increasing the CW values as per equation 2 and equation 3 for the different access categories and the values listed in the Table 3.The CW1 refers to the values in decreasing CW values1 and CW2 refers to the values in decreasing CW values2 in Table 3. Figure 3 explains the variation in throughput values by increasing the TXOP Limit. The TXOP1 refers to the increasing TXOP Limit1 and TXOP2 refers to the increasing TXOP Limit2 in the Table 6. Figure 4 explains the throughput variation by increasing the AIFS values. AIFS1 refers to the increasing AIFS value1 and AIFS2 refers to the increasing AIFS value2 in the Table 5.
4.1.2. Delay analysis
Next we analysed the average delay on the same set of nodes as in throughput analysis. From the simulation results, for 10 nodes a low average delay is obtained when the TXOP Limit is increased. For 15 nodes, the delay is increased in the EDCA method than the DCF method and is decreased when we gradually decrease the CW values but we didn’t obtain a fair result. Then we increased the CW values, but the delay started to increase. Then we altered the TXOP Limit. The increase in TXOP Limit gave a drastic decrease in delay than the other methods. The AIFS gave a high delay.
Method Paramet
ers AC0 AC1 AC2 AC3
Decreasing CW values1
AIFS
(µs) 2 2 3 7
CWmin
(ms) 5 11 23 23
CWmax
(ms) 11 23 1023 1023
TXOP Limit(s)
0.0003 264
0.006
016 0 0
Decreasing CW values2
AIFS
(µs) 2 2 3 7
CWmin
(ms) 3 7 15 15
CWmax
(ms) 7 15 1023 1023
TXOP Limit(s)
0.0003 264
0.006
10 20 30 40 50 0.60
0.61 0.62 0.63 0.64 0.65 0.66 0.67 0.68 0.69
T
h
ro
u
g
h
p
u
t
Number of nodes
DCF Access Method EDCA Default Parameter
Figure 1:Throughput Analysis –DCF Vs EDCA
0 20 40 60 80 100 120 140 160 180 200 0.600
0.605 0.610 0.615 0.620 0.625 0.630 0.635 0.640 0.645 0.650 0.655 0.660 0.665
T
h
ro
u
g
h
p
u
t
CWmin
[image:5.612.91.520.68.282.2]10 nodes 20 nodes 30 nodes 35 nodes 45 nodes 50 nodes
Figure 2:Throughput analysis by increasing and decreasing CWmin values
The 20 nodes result shows a low delay in EDCA method than the DCF method. The gradual decrease in CW values gave a gradual decrease in delay. But the increase in CW values increased the delay in 20 nodes. The increase in TXOP Limit decreased the delay which gave a fair result than the other method. The result of 25 nodes is same as the 15 nodes behavior which gave a low delay in the high TXOP Limit. We observed the same result of the 35,50 node network as the 20 node network. The simulation results obtained is shown in the Figure.7 shows the adjustments in the TXOP Limit gives a fair delay in all types of low, medium and high nodes.
10 20 30 40 50
0.648 0.650 0.652 0.654 0.656 0.658 0.660
T
h
ro
u
g
h
p
u
t
Number of nodes
[image:5.612.104.294.308.499.2]TXOP1 TXOP2
Figure 3:Throughput analysis by increasing the TXOP Limit
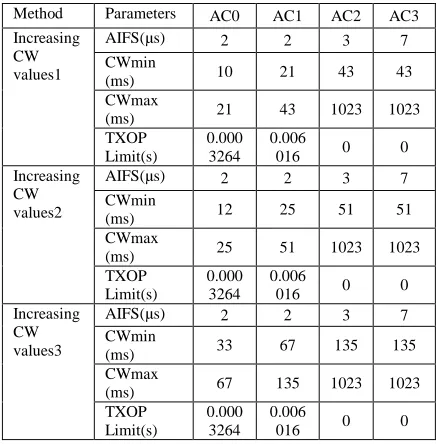
Table 3: Parameters with increased CWmin and CWmax
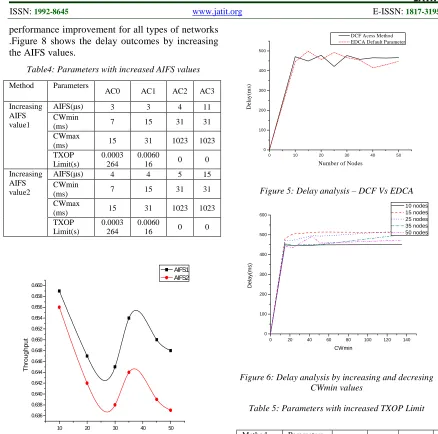
The delay analysis result shows that the increase in the TXOP Limit is best suited for small, medium and large number of nodes. Figure 5 shows the result for the delay analysis of DCF and EDCA method .The figure shows that EDCA method is better than the DCF method for all set of nodes. Figure 6 shows the delay analysis by increasing and
decreasing in congestion window and the
parameters used are same as the throughput analysis as per the Table 3. Figure 8 shows the delay analysis as per the Table 4 values. Figure 7 shows the delay analysis by increasing the TXOPLimit to all the set of node networks which gave a fair
Method Parameters AC0 AC1 AC2 AC3
Increasing CW values1
AIFS(µs) 2 2 3 7
CWmin
(ms) 10 21 43 43
CWmax
(ms) 21 43 1023 1023
TXOP Limit(s)
0.000 3264
0.006
016 0 0
Increasing CW values2
AIFS(µs) 2 2 3 7
CWmin
(ms) 12 25 51 51
CWmax
(ms) 25 51 1023 1023
TXOP Limit(s)
0.000 3264
0.006
016 0 0
Increasing CW values3
AIFS(µs) 2 2 3 7
CWmin
(ms) 33 67 135 135
CWmax
(ms) 67 135 1023 1023
TXOP Limit(s)
0.000 3264
0.006
[image:5.612.306.525.352.574.2]performance improvement for all types of networks .Figure 8 shows the delay outcomes by increasing the AIFS values.
Table4: Parameters with increased AIFS values
10 20 30 40 50
0.636 0.638 0.640 0.642 0.644 0.646 0.648 0.650 0.652 0.654 0.656 0.658 0.660
T
h
ro
u
g
h
p
u
t
Number of nodes
AIFS1 AIFS2
Figure 4: Throughput analysis by increasing AIFS value
The AC0, AC1, AC2, AC3 in the Tables are the Access Category 0, Access Category 1, Access Category 2 and Access Category3 for different sets of the altered parameters in the EDCA access mechanism.
0 10 20 30 40 50
0 100 200 300 400 500
D
el
ay
(m
s)
Number of Nodes
DCF Acess Method EDCA Default Parameter
Figure 5: Delay analysis – DCF Vs EDCA
0 20 40 60 80 100 120 140
0 100 200 300 400 500 600
D
e
la
y
(m
s
)
CWmin
10 nodes 15 nodes 25 nodes 35 nodes 50 nodes
[image:6.612.81.519.70.504.2]Figure 6: Delay analysis by increasing and decresing CWmin values
Table 5: Parameters with increased TXOP Limit
Method Parameters
AC0 AC1 AC2 AC3
Increasing AIFS value1
AIFS(µs) 3 3 4 11
CWmin
(ms) 7 15 31 31
CWmax
(ms) 15 31 1023 1023
TXOP Limit(s)
0.0003 264
0.0060
16 0 0
Increasing AIFS value2
AIFS(µs) 4 4 5 15
CWmin
(ms) 7 15 31 31
CWmax
(ms) 15 31 1023 1023
TXOP Limit(s)
0.0003 264
0.0060
16 0 0
Method Parameters
AC0 AC1 AC2 AC3
Increasing TXOP Limit1
AIFS(µs) 2 2 3 7
CWmin
(ms) 7 15 31 31
CWmax
(ms) 15 31 1023 1023
TXOP Limit(s)
0.0060 16
0.601
6 0 0
Increasing TXOP Limit2
AIFS(µs) 2 2 3 7
CWmin
(ms) 7 15 31 31
CWmax
(ms) 15 31 1023 1023
TXOP
Limit(s) 0.6016 1 0 0
Increasing TXOP Limit
AIFS(µs) 2 2 3 7
CWmin
(ms) 7 15 31 31
CWmax
(ms) 15 31 1023 1023
TXOP
0 10 20 30 40 50 0
100 200 300 400 500 600
D
e
la
y
(m
s)
Number of Nodes
TXOP 1 TXOP2
Figure 7: Delay analysis by increasing the TXOP Limit
0 10 20 30 40 50
0 100 200 300 400 500
D
e
la
y
(m
s)
Number of Nodes
AIFS1 AIFS 2
Figure 8: Delay analysis by increasing AIFS value
5. CONCLUSION
In this paper the performance of the WLAN is improved by altering the adjustable parameters in EDCA and the results are compared with the basic DCF access method. We have analysed the average throughput and average delay for the different set of nodes. First the DCF mechanism is used for all the set of nodes and the parameters are measured. Then for the same set of nodes the EDCA access mechanism with four ACs are used and the parameters are measured. Then the methods are compared and the performance is analysed. The
EDCA method gives better performance
improvement than the DCF access method but not a fair improvement. Then the EDCA method with the adjustable parameter values of the ACs is altered and the analysis is done. This analysis gave a good improvement in the performance for all set of nodes including small, medium and large. Increasing the TXOP Limit gave a very low drop and delay compared to the DCF and EDCA methods. The increase in the TXOP Limit gave a high throughput result for more number of nodes which gave a high performance improvement than the other access method parameters. To further improve the throughput the rate adaptation scheme can be applied to the high TXOP Limit EDCA access method.
REFERENCES:
[1]. G. Bianchi, “Performance analysis of the IEEE
802.11 distributed coordination
function," IEEE J. Sel. Areas Commun., vol. 18, no. 3, pp. 535-48, 2000.
[2]. F. Peng, H. M. Alnuweiri, and V. C. M. Leung, “Analysis of burst transmission in IEEE 802.11e wireless LANs," in Proc. IEEE ICC, June 2006, vol. 2, pp. 535-539.
[3]. Jelena Misic, Saeed Rashwand, Vojislav B.
Misic, “Analysis of Impact of TXOP
Allocation on IEEE 802.11e EDCA under Variable Network Load”, IEEE Transactions
on Parallel and Distributed Systems, vol. 23,
no. 5,pp.785-799,2012.
[4]. Suong H. Nguyen, Hai L. Vu, Lachlan L. H. Andrew,” Performance Analysis of IEEE
802.11 WLANsWith Saturated and Unsaturated Sources”, IEEE Transactions on Vehicular
Technology,IEEE Transactions on Vehicular Technology, Vol. 61, no. 1, pp.333-345, 2012. [5]. Jelena Misic, Saeed Rashwand, “IEEE 802.11e
EDCA under bursty traffic- How much TXOP can improve performance”, IEEE Transactions
on Vehicular Technology, Vol 60,No 3, pp. 1099-1115,2011 .
[6]. Geyong Min, Jai Hu, Weijia Jia, Mike E Woodward,’’ Performance Analysis of the
TXOP Scheme in IEEE 802.11e WLANs with bursty error channels” Proc.IEEEWCNC, pp
.1185-1190,2009.
[7]. Tomoya Tainaka,Masuyama Shoji kasahara & Yutaka Takahashi, “Performance Analysis of
burst transmission mechanism for IEEE 802.11 based multihop wireless LANs” IEEE
transactions on wireless communications
vol.10, No. 9, pp. 2908-2917,2011 .
[8]. IEEE 802.11e/D13.0, Draft Supplement to Part 11: Wireless LAN Medium Access Control
(MAC) and Physical Layer (PHY) Specifications: Medium Access Control (MAC) Quality of Service (QoS) Enhancements.
January 2005.
[9]. S.Choi, J.Prado, S.Manglod and S.Shankar,
“IEEE 802.11e contention-based channel
Access (EDCF) performance evaluation”, in
Proc. IEEE PIMRC, Sep.2002, pp.1151- 1156 . [10]. T.Suzuki, A.Noguchi, and S.Tasaka, “Effect of
TXOP-bursting and transmission Error on application-level and user-level QoS in audio-video transmission with IEEE 802.11e EDCA,”