Citation:
Broom, DR and Flint, SW (2018) Gotta catch ‘em all: Impact of Pokémon Go on physical activity, sitting time and perceptions of physical activity and health at baseline and three months follow up. Games for Health Journal, 7 (6). ISSN 2161-783X DOI: https://doi.org/10.1089/g4h.2018.0002
Link to Leeds Beckett Repository record: http://eprints.leedsbeckett.ac.uk/5112/
Document Version: Article
The aim of the Leeds Beckett Repository is to provide open access to our research, as required by funder policies and permitted by publishers and copyright law.
The Leeds Beckett repository holds a wide range of publications, each of which has been checked for copyright and the relevant embargo period has been applied by the Research Services team.
We operate on a standard take-down policy. If you are the author or publisher of an output and you would like it removed from the repository, please contact us and we will investigate on a case-by-case basis.
1
Gotta catch ‘em all: Impact of Pokémon Go on physical activity, sitting time and perceptions of 1
physical activity and health at baseline and three months follow up 2
3
Broom, D.R.1* and Flint, S.W.2 4
5
1Academy of Sport and Physical Activity, Sheffield Hallam University, United Kingdom. 6
2School of Sport, Leeds Beckett University, Fairfax Hall, Headingley Campus, Leeds, United Kingdom. 7
8
Running title – Pokémon Go, Physical Activity and Sitting Time 9
10
Word count: 4623 11
12
Keywords: Pokémon Go, physical activity, sitting time, gamification, mobile health. 13
14
*Correspondence: [email protected] 15
16 17
2 Abstract
19
Objective: The objective was to examine differences in physical activity, sitting time and perceptions 20
of physical activity and health between Pokémon Go users’ and non-users’ at baseline (launch of the 21
application in the UK) and 3-months follow up. 22
Materials and Methods: The self-administered, short version of the 7-day recall, International Physical 23
Activity Questionnaire was adapted to develop the 'Physical Activity and Pokémon Go questionnaire’ 24
which was distributed using social media. Four weeks after the launch of the application, 461 25
participants (n = 193 male, n = 265 female, n = 3 transgender), had completed the questionnaire. At 3-26
months follow up, 127 participants repeated the questionnaire. 27
Results: At baseline, mixed models ANOVA revealed main effects for Pokémon Go users’ versus non-28
users’ in the amount of days of vigorous physical activity, moderate physical activity and walking (All 29
p < 0.01). Users’ reported that they undertook less days of vigorous physical activity than non-users’ 30
but more days of moderate physical activity and walking. There were no differences in BMI, minutes 31
of vigorous or moderate physical activity, and walking, or sitting on weekdays (All p > 0.05). Repeated 32
measures ANOVA identified increased sitting on weekdays (p < 0.05), but maintained vigorous, 33
moderate and walking physical activity behaviours in users’ who remained users’. 34
Conclusion: Pokémon Go use can increase the frequency of days of physical activity benefitting health. 35
Users’ at both time points maintained their physical activity behaviour but increased sitting time on 36
3 Objective
38
39
Mobile phone applications to increase physical activity and encourage healthy eating behaviour have 40
been evaluated, with reports that the most effective are those that incorporate virtual avatars, gaming 41
and social media.1 The use of technological devices has great potential given the possibility of reaching 42
large populations at low cost. For instance, Ofcom2 reported that 93% of UK adults personally own or 43
use a mobile phone. One such intervention delivered via a smartphone application is Pokémon Go, 44
which is a free-to-play, location-based augmented reality game that was released globally in July 2016. 45
Using Global Positioning System (GPS) and the mobile phone camera, the application encourages 46
users’ to collect animated Pokémon characters by moving to locations within their environment. The 47
aim is to collect as many characters as possible which is encapsulated by the developer’s slogan ‘Gotta 48
catch ‘em all’. When a user is near a Pokémon character, the mobile phone vibrates to alert the user to 49
move to the characters location and catch it by throwing a Pokéball. To level up, users’ need to be 50
physically active, travelling 2-10 km, and by doing so, hatch the eggs they have incubated on the 51
application. 52
53
To date, few articles have examined the impact of Pokémon Go. One study estimated that Pokémon Go 54
users’ have accrued 144 billion steps in the US3. Likewise, Xian et al4 reported an increase in physical 55
activity from pre- to post-launch and that the number of users’ reaching the ≥10,000 daily steps 56
recommendation significantly increased from 15.3% to 27.5%. They also reported the greatest increase 57
in physical activity for those using the application most often, people who are overweight or with 58
obesity and those with the lowest pre-launch physical activity levels. Similarly, Wong5 reported the 59
greatest increases in physical activity amongst users’ who were classified as sedentary prior to the 60
launch of Pokémon Go. 61
62
To the authors’ knowledge, only one study has reported data representing the impact of Pokémon Go 63
4
increase in users’ steps dissipated and returned to pre-launch levels. As this is the only study to examine 65
Pokémon Go users’ physical activity over time, this has not been confirmed. 66
As sedentary behaviour is an independent risk factor for non-communicable diseases7, the potential of 67
Pokémon Go to reduce sitting time warrants examination. It was hypothesised that Pokémon Go users’ 68
would report higher levels of physical activity than non-users’ at baseline (hypothesis 1). Whilst no 69
research has presented data on sitting time, in line with previous research reporting increased physical 70
activity, it was hypothesised that sitting time would be lower in Pokémon Go users’ (hypothesis 2). 71
Finally, in line with Howe et al.6 it was hypothesised that increased physical activity, would have 72
reduced at 3-months follow up (hypothesis 3). 73
74
Materials and Methods 75
76
Design 77
A repeated measures design was used to examine the impact of Pokémon Go on physical activity, sitting 78
time and perceptions of physical activity and health. 79
80
Participants 81
Participants could complete the 'Physical Activity and Pokémon Go Questionnaire’ during a four-week 82
period after Pokémon Go was released in the UK. After 4 weeks, 461 participants (n = 193 male, n = 83
265 female, n = 3 transgender), predominantly white (n = 420), not self-reporting a disability (n = 443). 84
None reporting a disability were excluded as it was deemed that it would not impact on their physical 85
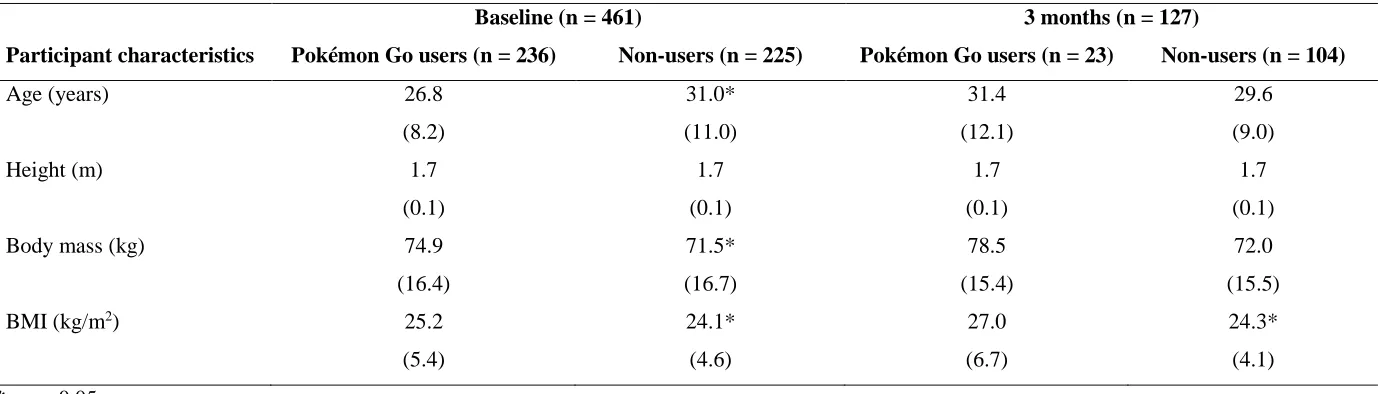
activity. Users’ and non-users’ mean ± SD age, height, body mass and body mass index (BMI) at 86
baseline is highlighted in Table 1 87
88
When invited to participate in future research, 234 participants provided their email addresses. At follow 89
up, 127 (55%; n = 54 male, n = 72 female, n = 1 transgender), predominantly white (n = 117), not self-90
reporting a disability (n =122), provided consent and repeated the questionnaire at 3-months. Users’ 91
5
There were 23 users’ and 104 non-users’; 56 were users’ at baseline and 71 were non-users’. Thus, 33 93
participants ceased using Pokémon Go within 3-months and nobody became users’. 94
95
Measures 96
The self-administered, short version of the 7-day recall, International Physical Activity Questionnaire 97
(IPAQ)8 was adapted to develop the 'Physical Activity and Pokémon Go Questionnaire’ and was 98
distributed via, QualtricsTM.9 Questions were presented in four sections as follows: 99
100
1) Demographics, anthropometrics and confirmation of whether participants had used Pokémon Go - 101
completed by all participants. 102
103
2) IPAQ, with the addition of the weekend sitting time question taken directly from the self-104
administered long version of the 7-day recall IPAQ8 - completed by all participants. 105
106
3) IPAQ adapted to ascertain the amount of physical activity undertaken solely when using Pokémon 107
Go. Thus, for each item of the IPAQ, the statement, ‘because you used the Pokémon GoTM app’ was 108
added. Questions were developed in-house to examine perceptions of the benefits of Pokémon Go on 109
physical activity and health. Likert scales were used ranging from ‘Strongly Disagree’ to ‘Strongly 110
Agree’ - completed by Pokémon Go users’ only. 111
112
4) Perceptions of the benefits of Pokémon Go on physical activity and health. (as in section 3) - 113
completed by non-users’ only. 114
115
Procedures 116
Following approval from Sheffield Hallam University’s Faculty of Health and Wellbeing ethics 117
committee, the questionnaire was distributed through social media from 22nd July 2016 using a bespoke 118
6
not been able to undertake their typical amount of physical activity due to injury, illness or for any other 120
reason. After 3-months, participants who provided an email were contacted again. 121
122
Data Analysis 123
Mixed models Analysis of Variance (ANOVA) examining between subject factors (e.g. user versus 124
non- user) and within subject factors (e.g. baseline versus 3-months) were used. Bonferroni correction 125
for confidence interval adjustment and follow up post-hoc tests with Scheffé correction were used to 126
examine the impact of Pokémon Go use and gender on self-reported BMI, days and minutes of vigorous 127
and moderate physical activity and walking, sitting on weekdays and weekends, and perceptions of the 128
impact of Pokémon Go on physical activity and health, at baseline and 3-months follow up. 129
130
Mann-Whitney U tests were used to examine gender differences in users’ perceptions of the specific 131
impact that using the application had on physical activity and sitting time at baseline and 3-months 132
follow up. 133
134
Repeated measures ANOVA with Bonferroni correction for confidence interval adjustment and follow 135
up post-hoc tests with Scheffé correction were used to examined gender differences in self-reported 136
BMI, days of vigorous and moderate physical activity and walking, and minutes of vigorous and 137
moderate physical activity and walking, sitting on weekdays and weekends at baseline compared to 3-138
months follow up for: 1) users’ who remained users’; 2) users’ who became users’; and 3) non-139
users’ who remained non-users’. Follow up independent t-tests examined significant gender effects. 140
141
Statistical significance was accepted if p < 0.05. Effect sizes were quantified using partial eta squared 142
(η2), with 0.1, 0.3, and > 0.5 considered small, medium, and large effects, respectively. Data are 143
presented as mean ± SD unless otherwise stated. 144
145
Results 146
7
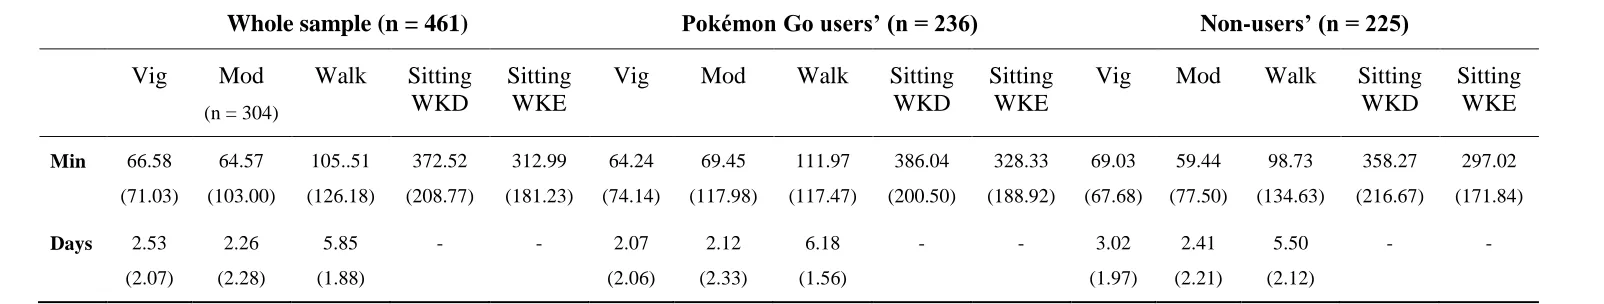
Descriptive statistics for study population physical activity and sitting time at baseline are shown in 148
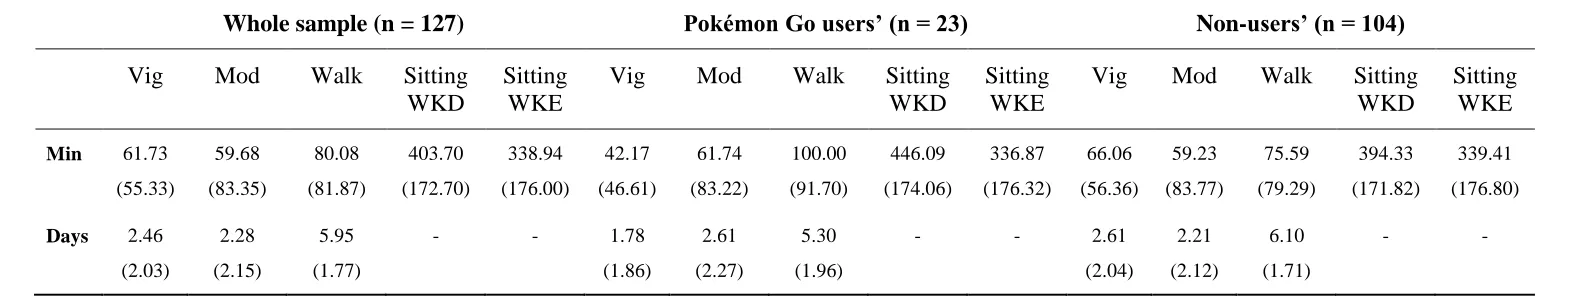
Table 2; study population physical activity and sitting time at 3-months are shown in Table 3;
and
149
users’ physical activity and reduced sitting time reported specifically due to Pokémon Go
use 150are shown in Table 4. 151
152
Baseline 153
Mixed model ANOVA highlighted main effects for Pokémon Go users’ or non-users’ on the amount of 154
days of vigorous and moderate physical activity and walking (F(1, 418) = 24.52, p < 0.01,
2p = 0.03;155
F(1, 418) = 4.25, p < 0.05,
2p = 0.01; F(1, 418) = 10.52, p < 0.01,
2p = 0.03 respectively). Users’ 156reported less days of vigorous physical activity than non-users’. However, users’ also reported they 157
undertook more days of moderate physical activity and walking compared to non-users’. There were no 158
differences in BMI, minutes of vigorous and moderate physical activity or walking between Pokémon 159
Go users’ and non-users’ (p > 0.05). Likewise, there were no differences in sitting time on weekdays or 160
weekends (p > 0.05). 161
162
Main effects of gender were observed on the amount of days participants reported undertaking vigorous 163
and moderate physical activity and walking (F(2, 418) = 6.56, p < 0.01,
2p = 0.03; F(2, 418) = 3.26 p 164< 0.05,
2p = 0.01; F(2, 418) = 4.76, p < 0.01,
2p = 0.02 respectively), and the amount of minutes of 165vigorous physical activity (F(2, 418) = 8.02, p < 0.01,
2p = 0.03). Males reported more days of166
vigorous and moderate physical activity, and walking and more minutes of vigorous physical activity 167
than females. There were no gender differences for BMI, minutes of moderate physical activity or 168
walking (p > 0.05). There were also no gender differences for sitting time on weekdays or weekends (p 169
> 0.05). 170
8
There was an interaction between using Pokémon Go and gender on BMI and minutes of moderate 172
physical activity (F(1, 418) = 4.08, p < 0.05,
2p = 0.10; F(1, 418) = 7.11, p < 0.01,
2p = 0.02). The 173interactions demonstrated that female users’ reported a higher BMI than non-users’, whilst male users’ 174
reported a lower BMI compared to non-users’. The interaction also demonstrated that male users’ 175
reported more minutes of moderate physical activity than non-users’, whilst female users’ reported less 176
minutes of moderate physical activity compared to non-users’. There were no interaction effects for 177
Pokémon Go use and gender on the amount of days of vigorous physical activity and walking, or 178
minutes of vigorous physical activity and walking (p > 0.05). Likewise, there were no interactions for 179
sitting time on weekdays or weekends (p > 0.05). 180
181
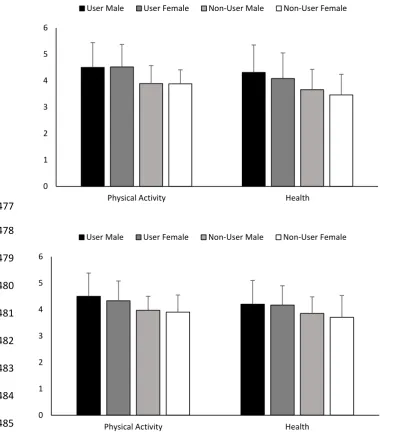
Perceptions of whether Pokémon Go use can increase physical activity and improve health 182
Perceptions of whether Pokémon Go use can increase physical activity and improve health at baseline 183
are highlighted in Figure 1. Mixed models ANOVA revealed a main effect for using Pokémon Go or 184
not on perceptions of whether Pokémon Go can increase physical activity and improve health at baseline 185
(F(1, 422) = 5.95, p < 0.05,
p2 = 0.01; F(1, 422) = 4.32, p < 0.05,
2p = 0.01 respectively). Users’ had 186a stronger perception that Pokémon Go use can increase physical activity and improve health compared 187
to non-users’ at baseline (p < 0.05). 188
189
There was a main effect of gender on perceptions of whether Pokémon Go can improve health (F(2, 190
422) = 3.65, p < 0.05,
2p = 0.02), where males reported a stronger perception that Pokémon Go use 191can improve health compared to females (p < 0.05). There was no main effect at baseline for gender on 192
perceptions that Pokémon Go use can increase physical activity (p > 0.05). There was no interaction 193
between Pokémon Go use and gender for perceptions of whether Pokémon Go use can increase physical 194
activity and improve health(p > 0.05). 195
196
9
When users’ were specifically asked how the application impacted their physical activity and sitting 198
time, Mann-Whitney U tests revealed that there was no gender difference for the days or minutes of 199
vigorous and moderate physical activity, and walking (p > 0.05). Likewise, there was no gender 200
difference on sitting time on weekdays and weekends (p > 0.05). 201
202
Three months follow up 203
Mixed models ANOVA highlighted main effects for Pokémon Go use or not on days of vigorous 204
physical activity, minutes of vigorous physical activity, and minutes walking (F(1, 104) = 4.71, p < 205
0.05,
2p = 0.04; F(1, 104) = 4.24, p < 0.05, 2 p
= 0.04; F(1, 104) = 4.48, p < 0.05,
2p = 0.04206
respectively). Users’ reported less days and minutes of vigorous physical than non-users’. Users’ 207
reported more minutes of walking compared to non-users’. There were no significant differences for 208
BMI, days of moderate physical activity or walking between users’ and non-users’ (p > 0.05). Likewise, 209
there was no significant differences in sitting time on weekdays or weekends between users’ and non-210
users’ (p > 0.05). 211
212
There were no significant gender differences for BMI, or days and minutes of vigorous and moderate 213
physical activity and walking (p > 0.05). Likewise, there were no significant gender differences for 214
sitting time on weekdays or weekends (p > 0.05). 215
216
There was a significant interaction between using Pokémon Go or not and gender on BMI and the 217
amount of days of walking (F(1, 104) = 4.76, p < 0.05,
2p = 0.04; F(1, 104) = 5.45, p < 0.05, 2 p
= 2180.05 respectively). The interactions demonstrated that female users’ reported a higher BMI than non-219
users’, whilst male users’ reported a lower BMI compared to non-users’. Interactions also demonstrated 220
that male users’ reported more days of walking than non-users’, whilst female users’ reported less days 221
of walking compared to non-users’. There were no interactions between Pokémon Go use and gender 222
10
were no interactions between Pokémon Go use and gender for sitting time on weekdays and weekends 224
(p > 0.05). 225
226
Perceptions of whether Pokémon Go use can increase physical activity and improve health 227
Perceptions of whether Pokémon Go use can increase physical activity and improve health at 3-months 228
are highlighted in Figure 1. Mixed models ANOVA highlighted a main effect of Pokémon Go use on 229
perceptions of whether Pokémon Go can increase physical activity and improve health at 3-months 230
(F(1, 102) = 6.67, p < 0.05,
p2 = 0.06; F(1, 102) = 4.50, p < 0.05, 2 p
= 0.04 respectively). Users’ had 231a stronger perception that Pokémon Go use can increase physical activity and improve health compared 232
to non-users’ (p < 0.05). At 3-months, there was no main effect of gender on perceptions of whether 233
Pokémon Go use can increase physical activity or improve health (p > 0.05). There were no interactions 234
between gender and Pokémon Go use at 3-months (p > 0.05). 235
236
Physical activity and reduced sitting time specifically due to Pokémon Go 237
When users’ were specifically asked how the application impacted their physical activity and sitting 238
time, Mann-Whitney U tests revealed that there was no gender difference for the days or minutes of 239
vigorous physical activity, moderate physical activity, and walking (p > 0.05). Likewise, there was no 240
gender difference for sitting on weekdays or weekends (p > 0.05). 241
242
Comparison of Pokémon Go users’ at baseline and 3-months 243
Repeated measures ANOVA revealed that there was a main effect of sitting time on a weekday from 244
baseline to 3-months, where participants reported more sitting at 3-months (F(1, 20) = 5.37, p < 0.05, 245
2 p
= 0.21). Repeated measures ANOVA highlighted that there was no main effect of time (baseline vs 2463-months) on BMI, days or minutes of vigorous and moderate physical activity, and walking (p > 0.05). 247
Likewise, there was no main effect of time (baseline vs 3-months) on sitting time at weekends (p > 248
0.05). 249
11
There were no gender differences at baseline compared to 3-months follow up for BMI, the amount of 251
days or minutes of vigorous and moderate physical activity, and walking (p > 0.05). Likewise, there 252
were no gender differences at baseline compared to 3-months follow up for sitting time on weekdays 253
and weekends (p > 0.05). 254
255
There were no gender interactions of Pokémon Go use and time (baseline vs 3-months) for BMI, the 256
amount or days or minutes of vigorous and moderate physical activity, and walking (p > 0.05). 257
Likewise, there were no gender interactions of Pokémon Go use and time (baseline vs 3-months) for 258
sitting time on weekdays and weekends (p > 0.05). 259
260
Physical activity and reduced sitting time specifically due to Pokémon Go 261
When users’ were specifically asked how the application impacted their physical activity and sitting 262
time, repeated measures ANOVA revealed that there were no main effects, gender differences or 263
interactions for the impact of Pokémon Go and gender between baseline and 3-months on the days or 264
minutes of vigorous and moderate physical activity, and walking (p > 0.05). Likewise, there were no 265
main effects, gender differences or interactions for the impact of Pokémon Go and gender between 266
baseline and 3-months for sitting time on weekdays and weekends (p > 0.05). 267
268
Comparison of Pokémon Go users’ at baseline who became non-users’ at 3-months 269
Repeated measures ANOVA highlighted there was a main effect of time (baseline vs 3-months) where 270
participants reported more sitting at 3-months (F(1, 31) = 6.97, p < 0.05,
p2= 0.18). However, there 271was no main effect of time on BMI, the days or minutes of vigorous and moderate physical activity, 272
and walking, (p > 0.05). Likewise, there was no main effect of time for sitting time on weekdays (p > 273
0.05). 274
12
There were no gender differences between baseline and 3-months for BMI, the amount or days or 276
minutes of vigorous and moderate physical activity, and walking (p > 0.05). Likewise, there were no 277
gender differences between baseline and 3-months for sitting time on weekdays or weekends (p > 0.05). 278
279
There were interactions between baseline and 3-months for gender and days of vigorous physical 280
activity and sitting time on weekends (F(1, 31) = 5.52, p < 0.05,
2p = 0.15; F(1, 31) = 6.97, p < 0.05,281
2 p
= 0.18; F(1, 31) = 7.35, p < 0.05,
2p = 0.19 respectively). Males reported more days of vigorous 282physical activity and maintained their sitting time on weekends at 3-months compared to baseline, 283
whilst females reported more days of vigorous physical activity and less sitting time on weekends at 284
baseline compared to months follow up. There were no gender interactions between baseline and 3-285
months for BMI, the amount or days of moderate physical activity, and walking, or minutes of vigorous 286
and moderate physical activity and walking (p > 0.05). Likewise, there were no gender interactions 287
between baseline and 3-months for sitting time on weekdays (p > 0.05). 288
289
Comparison of non-users’ at baseline and at 3-months 290
Repeated measures ANOVA highlighted there was no main effect of time (baseline vs 3-months) on 291
BMI, the days or minutes of vigorous and moderate physical activity, and walking (p > 0.05). Likewise, 292
there was no main effect of time for sitting time on weekdays and weekends (p > 0.05). 293
294
Repeated measures ANOVA highlighted there was a gender effect of BMI, days of vigorous physical 295
activity from baseline to 3-months (F(1, 69) = 6.36, p < 0.05,
2p= 0.09; F(1, 69) = 7.97, p < 0.05,
2p 296= 0.10). Follow up independent t-tests revealed males reported a higher BMI at baseline and at 3-months 297
compared to females (t(67) = 2.92, p < 0.01; t(65) = 2.14, p < 0.05). There was no difference at baseline 298
between males and females for the amount of days of vigorous physical activity (p > 0.05), however, 299
there was a difference at 3-months follow up (t(69) = 3.00, p < 0.01). There were no gender differences 300
between baseline and 3-months follow up for moderate physical activity, and walking, or minutes of 301
13
differences between baseline and 3-months follow up for sitting time on weekdays or weekends (p > 303
0.05). 304
305
There was a gender interaction between baseline and 3-months for minutes of moderate physical activity 306
(F(1, 69) = 4.55, p < 0.05,
2p = 0.06). Females reported more minutes of moderate physical activity at 307baseline compared to 3-months, whilst males reported less minutes of moderate physical activity 308
compared to 3-months. There were no gender interactions between baseline and 3-months for BMI, the 309
amount or days of vigorous and moderate physical activity, and walking, or minutes of vigorous 310
physical activity and walking (p > 0.05). Likewise, there were no gender interactions between baseline 311
and 3-months for sitting time on weekdays or weekends (p > 0.05). 312
313
Discussion 314
This study examined the impact of Pokémon Go on physical activity, sitting time and perceptions of 315
the physical activity and health benefits. It was hypthesized that users’ would report higher levels of 316
physical activity and less sitting time than non-users’ at baseline. Significant differences were identified 317
for the amount of days of vigorous physical activity, moderate physical activity and walking at baseline. 318
Users’ reported more days of moderate physical activity and days of walking compared to non-users’. 319
However, they also reported less days of vigorous physical activity, which only partially supports 320
hypothesis 1. This is understandable, given that the objective of using Pokémon Go is to find Pokémon 321
characters, which is unlikely to involve vigorous physical activity. The exploratory nature of the 322
application, where users’ need to search to find characters, means there is a greater likelihood of 323
moderate physical activity or walking. 324
325
There was a significant interaction between using Pokémon Go or not and gender, where BMI and 326
moderate physical activity differed for males and females. Interestingly, female users’ had a higher BMI 327
14
BMI was associated with more minutes of moderate physical activity, which in this case was evident 329
for male users’ and female non-users’. This suggests that Pokémon Go use is not determined by BMI. 330
331
At baseline, there was a gender difference in perceptions of whether Pokémon Go can improve health, 332
where males reported a stronger perception that the application can improve health compared to 333
females. Whilst males had a more favourable perception compared to females, both genders reported 334
positive perceptions of the potential impact of Pokémon Go. A systematic review of physical activity 335
applications, reported that there is high potential for such technology to encourage physical activity 336
based on positive user perceptions of their usefulness and viability. 11 337
338
At 3-months, only 18% of participants continued to use Pokémon Go, 56% were non-users’ at baseline 339
and at 3-months follow up, and 26% were users’ that became users’. Zero participants were non-340
users’ that became users’. Thus, the number of users’ from baseline to 3-months follow up decreased. 341
Despite this, for users’ who remained users’, there were no differences in physical activity at baseline 342
compared to 3-months follow up. Thus, any impact of Pokémon Go on physical activity was sustained 343
over time. Our study lends support for previous work that has also identified the potential benefits of 344
utilising smartphone applications to encourage behaviour change over time.12-13 However, participants 345
reported an increase in sitting time on weekdays at 3-months compared to baseline, suggesting that any 346
benefit in reducing sitting time on weekdays dissipates. There were no significant gender differences in 347
physical activity or sitting time when comparing baseline to 3-months follow up suggesting males and 348
females respond and interact the same with Pokémon Go. 349
350
There was no difference in physical activity or sitting time amongst users’ at baseline who became non-351
users’ at 3-months follow up. Thus, ceasing Pokémon Go use did not significantly effect physical 352
activity or sitting time. This suggests that these participants have replaced Pokémon Go with another 353
form of physical activity given that at baseline users’ reported more physical activity than non-users’. 354
15
At 3-months, there were no significant gender differences in physical activity, sitting time or 356
perceptions of whether Pokémon Go can increase physical activity and improve health. However, there 357
was an interaction between using Pokémon Go or not and gender on BMI and days of walking. Akin to 358
baseline, female users’ reported a higher BMI than non-users’, whilst male users’ reported a lower BMI 359
than non-users’ at 3-months follow up. Thus, Pokémon Go usage at both baseline and 3-months was 360
evident for males with a lower BMI and females with a higher BMI. Male users’ reported more days of 361
walking compared to users’, whilst female users’ reported less days of walking compared to non-362
users’ at 3-months. Thus, Pokémon Go use appears to have a beneficial impact on the amount of days’ 363
that males engaged in walking, but this effect was not observed in females where they engaged in 364
significantly less days of walking compared to non-users’. The current study findings therefore suggest 365
that Pokémon Go can therefore be a useful application to encourage walking behaviour in males. 366
367
This study is the first to examine the impact of Pokémon Go on sitting time. Given the evidence 368
demonstrating the importance of reducing sitting time, particularly in people who are already inactive, 369
interventions are warranted and require evaluation. This study has also reported the longest follow up 370
period, providing an indication of use and impact of Pokémon Go and compared to Howe et al.6, 371
collected data at two time points rather than assessing drop off. The only significant difference between 372
baseline and 3-months, was in the minutes of sitting time on weekdays for users’ who remained users’ 373
at 3-months. Thus, physical activity was maintained, yet users’ reported sitting more at 3-months 374
compared to baseline. Increased sitting time suggests that users’ are replacing light intensity physical 375
activity with more sitting, which the IPAQ8 does not measure. 376
377
Pokémon Go is a fad where the number of users’ has reduced over time. Therefore, the potential of 378
Pokémon Go to be an effective intervention to increase physical activity, as seen in the current study, 379
is likely to be short lived. Once participants have collected all Pokémon characters, they would no 380
longer be motivated to continue using the application for this reason. This would make sense given that 381
the motivation to continue using Pokémon Go is likely to be low, as the application does not evolve, 382
16
timely evolution, Pokémon Go might encourage behaviour change and continued motivation, and this 384
should be a focus for future work. Future work should also examine the use of Pokémon Go in younger 385
people, given the likely appeal to children and adolescents. 386
387
This study is not without its limitations including self-selection bias which was unavoidable due to 388
collecting the data using an online questionnaire. There is also a reliance on participants accurately self-389
reporting their physical activity (which is typically prone to over-reporting) and body mass (which is 390
typically prone to under reporting). The physical activity and sitting time data was recalled for the week 391
prior to completion rather than a continuation of data collection. Objective measures of physical activity 392
and sitting time could have provided more valid data, although such measures have their own 393
limitations. Whilst the IPAQ has strong psychometric properties we acknowledge that results 394
specifically from the adapted section need to be interpreted with caution since validity and reliability 395
may have been compromised. We are confident that including the weekend sitting time item was 396
appropriate to measure overall sitting time for the week. Finally, whilst the sample size of users’ who 397
continued to be users’ was small it was pleasing that there was an even representation of users’ and 398
non-users’ at baseline and attrition of participants was favourable compared to other research utilising 399
online questionnaires. 400
401
Conclusion 402
This is the first study to examine the use of Pokémon Go to reduce sitting time and both users’ and non-403
users’ perceptions on whether the application can benefit physical activity and health. Additionally, the 404
follow up is greater compared to other studies examining Pokémon Go use. Key findings are that users’ 405
spent less days engaging in vigorous physical activity but more days engaging in moderate physical 406
activity and walking compared to non-users’. Despite the number of users’ declining, there was no 407
change in physical activity over the 3-months follow up period for users’, and thus, physical activity 408
was maintained from baseline. Importantly, this sustained physical activity level was evident for users’ 409
who maintained use, but also those who stopped using the application suggesting that an alternative 410
17
who remained users’ at 3-months follow up, reported more sitting time on weekdays at 3-months 412
compared to baseline. Thus, the application did not prevent increased sitting time on weekdays 413
highlighting the need for other interventions. 414
415
Abbreviations 416
ANOVA: Analysis of Variance; BMI: Body Mass Index 417
418
Acknowledgements 419
The authors would like to express thanks to the participants and Tom Parkington, Matt Debney, Chloe 420
Rodgers, Rob Wilson and Jessica Sharpe for piloting the questionnaire. The authors would like to thank 421
the delegates of the ‘gamification’ session at the International Society of Behavioral Nutrition and 422
Physical Activity (ISBNPA) 2017 conference who provided ideas for analysis during question time. 423
424
Author Disclosure Statement 425
The authors declare no conflicts of interest and have received no funding for this research. 426
427
Availability of data 428
Data will be deposited in SHURA and is available on request. 429
430
Author contributions 431
DRB conceived the idea and developed the initial questionnaire. Both DRB and SWF then contributed 432
equally to all remaining aspects of the development of the research and the manuscript and agree to be 433
accountable. 434
435
References 436
1. Hswen Y, Murti V, Vormawor AA, et al. Virtual avatars, gaming, and social media: 437
Designing a mobile health app to help children choose healthier food options. J Mob Technol 438
18
2.
Ofcom. Fast facts. 2017. https://www.ofcom.org.uk/about-ofcom/latest/media/facts.
440
[Last accessed 12 March 2018].
441
3. Althoff T, White RW, Horvitz E. Influence of Pokémon Go on physical activity: study and 442
implications. J Med Internet Res 2016; 18(12). 443
4. Xian Y, Xu H, Xu H, Liang L, Hernandez AF, Wang TY, Peterson ED. An Initial Evaluation 444
of the Impact of Pokémon GO on Physical Activity. J Am Heart Assoc 2017; 6(5):e005341. 445
5. Wong FY. Influence of Pokémon Go on physical activity levels of university players: a cross-446
sectional study. Int J Health Geogr 2017; 16(1):8. 447
6. Howe KB, Suharlim C, Ueda P, et al. Gotta catch’em all! Pokémon GO and physical activity 448
among young adults: difference in differences study. BMJ 2016; 355: i6270. 449
7. Owen N, Bauman A, Brown W. Too much sitting: a novel and important predictor of chronic 450
disease risk? Br J Sport Med 2009; 43(2):81-83. 451
8. Craig CL, Marshall AL, Sjostrom M, et al. International physical activity questionnaire: 12-452
country reliability and validity. Med Sci Sp Ex 2003; 35(8):1381-1395. 453
9. Qualtrics. (2017). Qualtrics. www.qualtrics.com. [Last accessed 27 December 2017]. 454
10. Pokémon Go Physical Activity Questionnaire. 2017. Physical Activity & Pokémon Go. 455
https://shusls.eu.qualtrics.com/SE/?SID=SV_4Git5qVSH4ZA1al. [Last Accessed 27 456
December 2017]. 457
11. Bort-Roig J, Gilson ND, Puig-Ribera A, et al. Measuring and influencing physical activity 458
with smartphone technology: a systematic review. Sports Med 2014; 44(5):671-86. 459
12. Payne HE, Lister C, West JH, et al. Behavioral functionality of mobile apps in health 460
interventions: a systematic review of the literature. JMIR mHealth and uHealth. 2015; 3(1). 461
13. Schoeppe S, Alley S, Van Lippevelde W, et al. Efficacy of interventions that use apps to 462
improve diet, physical activity and sedentary behaviour: a systematic review. Int J of Behav 463
Nutr and Phys Act 2016; 13(1): 127. 464
465
19 Academy of Sport and Physical Activity,
467
Sheffield Hallam University, 468
Sheffield, 469
UK, 470
S10 2BP 471
472
T: 0044 114 2254369 473
F: 0044 114 2254356 474
E: [email protected] 475
20 477
478
479
480
481
482
483
484
[image:21.595.40.434.78.517.2]485
Figure 1 - Mean and standard deviation of Pokémon Go users’ and non-users’ perception that
486
the application can increase physical activity and improve health at baseline (Panel A) and
3-487
months follow up (Panel B). All mean scores are based on Likert scales ranging from 1
488
‘strongly disagree’ – 5 ‘strongly agree’. * Denotes significant difference between Pokémon Go
489
users’ and non-users’.
490
491 0 1 2 3 4 5 6
Physical Activity Health
User Male User Female Non-User Male Non-User Female
0 1 2 3 4 5 6
Physical Activity Health
21
Table 1: Demographic characteristics of Pokémon Go users’ and non-users’ at baseline and 3 months follow up. Values are mean (standard deviation) 492
Baseline (n = 461) 3 months (n = 127)
Participant characteristics Pokémon Go users (n = 236) Non-users (n = 225) Pokémon Go users (n = 23) Non-users (n = 104)
Age (years) 26.8
(8.2)
31.0*
(11.0)
31.4
(12.1)
29.6
(9.0)
Height (m) 1.7
(0.1)
1.7
(0.1)
1.7
(0.1)
1.7
(0.1)
Body mass (kg) 74.9
(16.4)
71.5*
(16.7)
78.5
(15.4)
72.0
(15.5)
BMI (kg/m2) 25.2
(5.4)
24.1*
(4.6)
27.0
(6.7)
24.3*
(4.1)
*p = < 0.05 493
494
22
Table 2:
Study population physical activity and sitting time at baseline
496
Whole sample (n = 461)
Pokémon Go users’ (n = 236)
Non-users’ (n = 225)
Vig
Mod
(n = 304)
Walk
Sitting
WKD
Sitting
WKE
Vig
Mod
Walk
Sitting
WKD
Sitting
WKE
Vig
Mod
Walk
Sitting
WKD
Sitting
WKE
Min 66.58
(71.03) 64.57 (103.00) 105..51 (126.18) 372.52 (208.77) 312.99 (181.23) 64.24 (74.14) 69.45 (117.98) 111.97 (117.47) 386.04 (200.50) 328.33 (188.92) 69.03 (67.68) 59.44 (77.50) 98.73 (134.63) 358.27 (216.67) 297.02 (171.84) Days 2.53 (2.07) 2.26 (2.28) 5.85 (1.88)
- - 2.07
(2.06)
2.12
(2.33)
6.18
(1.56)
- - 3.02
(1.97) 2.41 (2.21) 5.50 (2.12) - - 497
Mean and standard deviation of the whole sample, Pokémon Go users’ and non-users’ vigorous physical activity, moderate physical activity,
498
walking, sitting on weekdays and sitting on weekends at baseline. Vig = Vigorous physical activity; Mod = Moderate physical activity; Walk =
499
Walking; WKD = Weekday; WKE = Weekend; Min = Minutes
500
501
23
Table 3:
Study population physical activity and sitting time at 3-months
503
Whole sample (n = 127)
Pokémon Go users’ (n = 23)
Non-users’ (n = 104)
Vig
Mod
Walk
Sitting
WKD
Sitting
WKE
Vig
Mod
Walk
Sitting
WKD
Sitting
WKE
Vig
Mod
Walk
Sitting
WKD
Sitting
WKE
Min 61.73
(55.33)
59.68
(83.35)
80.08
(81.87)
403.70
(172.70)
338.94
(176.00)
42.17
(46.61)
61.74
(83.22)
100.00
(91.70)
446.09
(174.06)
336.87
(176.32)
66.06
(56.36)
59.23
(83.77)
75.59
(79.29)
394.33
(171.82)
339.41
(176.80)
Days 2.46
(2.03)
2.28
(2.15)
5.95
(1.77)
- - 1.78
(1.86)
2.61
(2.27)
5.30
(1.96)
- - 2.61
(2.04)
2.21
(2.12)
6.10
(1.71)
- -
504
Mean and standard deviation of the whole sample, Pokémon Go users’ and non-users’ vigorous physical activity, moderate physical activity,
505
walking, sitting on weekdays and sitting on weekends at 3-months follow up. Vig = Vigorous physical activity; Mod = Moderate physical activity;
506
Walk = Walking; WKD = Weekday; WKE = Weekend; Min = Minutes
507
24
Table 4:
Users physical activity and reduced sitting time reported specifically due to Pokémon Go
509
Baseline (n = 236) 3-months follow up (n = 23)
Vig
Mod
Walk
Reduced
sitting
WKD
Reduced
sitting
WKE
Vig
Mod
Walk
Reduced
sitting
WKD
Reduced
sitting
WKE
Min 13.64
(49.30)
27.45
(63.06)
85.93
(100.11)
85.43
(92.53)
97.90
(102.53)
5.87
(15.79)
11.09
(28.05)
53.26
(56.31)
28.26
(46.76)
69.57
(104.61)
Days 0.38
(1.17)
0.84
(1.74)
4.77
(2.20)
- - 0.17
(0.48)
0.48
(1.21)
3.30
(2.42)
- -
510
Mean and standard deviation of Pokémon Go users’ perceptions of the amount of vigorous physical activity, moderate physical activity, walking,
511
reduced sitting on weekdays and sitting on weekends due to Pokémon Go use Vig = Vigorous physical activity; Mod = Moderate physical activity;
512
Walk = Walking; WKD = Weekday; WKE = Weekend; Min = Minutes
513