2017 2nd International Conference on Software, Multimedia and Communication Engineering (SMCE 2017) ISBN: 978-1-60595-458-5
DNA Sequence Alignment Algorithm Based on
k
-tuple Statistics
Jun-yan ZHANG
*, Chen-hui YANG and Hai-ying WANG
College of Information Science and Engineering, Chengdu University, Chengdu 610106, China
Key Laboratory of Pattern Recognition and Intelligent Information Processing of Sichuan Chengdu University, Chengdu 610106, China
*Corresponding author
Keywords: Sequence alignment, k-tuple statistic, Markov model, Similarity measurement.
Abstract. DNA Sequence Alignment is one of the most basic and most important operations in bioinformatics. In this paper, we put forward to SDkS algorithm based on k-tuple statistic, which is a kind of probability method. The positive transition probability matrix, the negative transition probability matrix, and the logarithmic ration are computed based on Markov model. After obtaining converting sequence, we get the results of k-tuple statistic. Subsequently, the similarity measurement can be gained according to above parameters. When the minimum support is given, we can identify two DNA sequences is similarity or not. The experimental results show that SDkS algorithm has better effective performance in saving computing time.
Introduction
Deoxyribonucleic acid (DNA) molecules are information macromolecules which form the blueprint for life on earth, and each strand of the famous double helix is a linear combination of the polymerized nucleotides (bases) adenine (A), guanine (G), cytosine (C), and thymine (T). Therefore, one DNA sequence can be treated as a string of characters with a four-character set ={A,C,G,T}. Thus, each DNA sequence S*[1].
DNA Sequence Alignment is one of the most basic and most important operations in bioinformatics. The critical functions, structures and evolution features of biological sequences can be found by this operation. The basic task of sequence alignment is comparing the biological molecular sequences, and then: (1) figuring out their similarities to determine the similarity measurement; (2) finding out the common regions of the sequences to decide the important patterns; and (3) identifying the differences between the sequences to describe the features of DNA sequences. The main purpose of this study is to analyze the phylogenetic relationships between the sequences so as to identify the homology between the sequences [2]. Sequence alignment problem has been proved to be an NP complete problem. Therefore, how to develop a sequence alignment algorithm with high sensitivity is an urgent problem to be solved in molecular biology [3].
for sequence alignment because of the mathematical features of DNA sequence itself. The typical algorithms include SAMSA, SAGA, DIALIGN, and PSOMSA, in which the genetic algorithm, simulated annealing, and Markov model are widely employed [8].
Most existing algorithms have obtained very inspiring results, but there is still room for improvement. For this purpose, we propose a sequence alignment algorithm for estimating the similarity between the DNA sequences, which employs Markov model and k-tuple statistic. The remainder of this paper is organized as follows. In the next section, some relative concepts and methods are given as the preliminaries. And then, we describe the problem-solving ideas and put forward to our own algorithm. The performance of the proposed algorithm in term of the results of contrast experiments is discussed in next section. Finally, we conclude this paper.
Preliminaries
In this section, the relative concepts and methods which are employed to solve the problem of DNA sequence alignments are presented.
Markov Model
The Markov process shows no after-effect property. Informally, the “future” is not dependent on the “past” when the “now” of the process is known. The distribution function can be used to describe the Markov model. First of all, we suppose Y is the set of discrete time and Y= {0, 1, 2,...}. The state space of stochastic processes {X(y), yY} is I. If the following conditional distribution function is established, we call it a Markov process.
P{X(ynxn|X(y1)=x1, X(y2)=x2,…, X(yn-1)=xn-1}=P{X(yn-1) xn|X(yn-1)= xn-1}. (1)
Here, XiI (i=1,2,...,n-1), and y1<y2<...<yn (n3). The Markov process with the discrete time and
condition is called Markov chain, which can be denoted by {Xn=X(n), n=0,1,2,...}.
Definition 1. Suppose the state space I={a1, a2,...}, for any positive integer n and r, we have:
P{Xm+n=ai|Xt1=ai1, Xt2=ai2,..., Xtr=air, Xm=ai}=P{Xm+n=ai|Xm=ai}. The right part of the equation is
written as Pij(m, m+n). Thus, we get the following conditional probability which is named transition
probability from state ai to state aj.
Pij(m, m+n)=P{Xm+n=ai|Xm=ai}. (2)
The transition probability is usually called transition probability matrix because it is only relative with i, j and time interval n. It is able to be described as: Pij(m, m+n)=Pij(n). According to Definition 1,
Pij(n)=P{Xm+n=ai|Xm=ai}. It is also called n-step transition probability, and P(n)=Pij(n)=P{Xm+n} is
named n-step transition probability matrix. When n=1, it becomes one-step transition probability matrix [1], which is also named positive transition probability matrix and denoted by P+. On the other hand, P is employed to describe the negative transition probability matrix which means the next state of ai isn’t aj. Thus, P+={pij+}, and P={pij-}.
Definition 2. Given two DNA sequences S1 and S2, P+ and P are the positive transition probability
matrix and negative transition probability matrix of S1 respectively. L is the length of S2, i.e.,
L=|S2|.We use logarithmic ratio R to represent the similarity between S1 and S2, and R can be
calculated according to Eq.3:
R=
L
i p
p L
P P
i i
i i
1 1
1 1
, ,
log
log . (3)
K-tuple Statistic
the Markov process, where the value of the k is no less than two [9]. We employ k-tuple statistic to act as an important factor of determining sequence similarity. Therefore, we put forward to the following definition.
Definition 3. The total number of matching in successive runs of length k or much longer is defined as the k-tuple statistic, which can be denoted mathematically as follows. Here, n is the length of the sequence. mn,k is the number of successive runs of length exactly k (non-overlap counting) in a
sequence.
Mn,K=
n k k n km 1, . (4)
In this paper, the similarity measurement between DNA sequences S1 and S2 will be calculated by
use of the logarithmic ration R and the k-tuple statistic Mn,K in term of Eq. 5, where n=|S2|.
=| , |
n MnK
R . (5) When the minimum support Smin is given, we can conclude that two DNA sequences S1 and S2 have
similarity on the basis of probability if Smin.
Algorithm
In order to illustrate the idea of this approach, one example is given. Supposed two DNA sequences: S1=GCCTATATTTAG, and S2=TCCTATCTTCTG. We can compute the P+ and P of S1 according
to Definition 1. The results are:
P+=
4 0 0 0 6 0 0 0 1 0 5 0 0 5 0 0 67 0 33 0 0 0 . . . . . .
, P=
20 0 33 0 33 0 14 0 29 0 29 0 13 0 29 0 17 0 33 0 17 0 33 0 12 0 22 0 33 0 33 0 . . . . . . . . . . . . . . . . .
And then, we calculate R in term of Eq. 3. L=|S2|, we obtain the value of R as follows, where the
term whose value is zero is omitted.
R=
TT TT AT AT TA TA CT CT CC CC p p p p p p p p p p log log log log log 3 12 1 =0.30.
Now we align S1 on top of S2, and then we convert them into a sequence of matching (M) and
mismatching (U) of aligned alphabet: Scvt=UMMMMMUMMUUM. If k=2, the total number of
matching in successive runs of length 2 or longer for Scvt can be computed based on Eq. 4:
M12,2=2m12,2+5m12,5=21+51=7.
Next, we work out the similarity measurement in accordance with Eq. 5, where n=|Scvt|=12.
=|0.30-(7/12)|=0.28.
If Smin=0.20, we can conclude S1 and S2 are similarity because 0.28>0.20. Otherwise, if Smin=0.30,
we can conclude S1 and S2 aren’t similarity because 0.28<0.30.
Now, we present our DNA sequences similarity determination algorithm based on k-tuple statistics-SDkS in this section.
Algorithm: DNA Sequences Similarity Determination based on k-tuple Statistics (SDkS)
Input: K=2, S1, S2, Smin
Output: True (similarity) or False (dissimilarity) Begin{
L1=|S1|; L2=|S2|; i, j={A,C,G,T}; Scvt=“” ; n=0;
countij+=0;//it is the number of state j is after the sate i;
countij=0;//it is the number of state j isn’t after the sate i;
for(position=1; position<L1; position++)
if(S1.regionMatches(position, “ij”, 1, 2)) countij+ ++;
else countij++;}
for(i='A'; i<='T'; i++)//calculate P+ and Pof S1
for(j='A'; j<='T'; j++){
pij+=countij+/
' '
' '
T
A
j ij
count ; pij=countij/
' '
' '
T
A
j ij
count ;}
for(position=1; position<L1&& position<L2; position++){
if(S1.substring(position,1,1)== S2.substring(position,1,1)) Scvt.append(“M”);
else Scvt.append(“U”); n++;}
for(k=1; k<=n; k++){Calculate Mn,K=
n
k nk
km
1
, ;}
Calculate =| , |
n MnK
R ;
if(Smin) return (True); else return (False);
End of SDkS
Our SDkS algorithm can be used to achieve pair-wise sequence alignment. It needed to be executed for more than one time if SDkS algorithm is applied to multiply sequence alignment. Its time complexity is only related to the length of DNA sequences because there are only four alphabets in . Therefore, the frequency of loop statements in line 9 and line 10 can be regarded as a constant. Accordingly, the time complexity of SDkS is O(n), where n=max(L1, L2).
Experiments and Results
In this section, SHR algorithm and GMTB algorithm are selected to do the contrast experiments with our SDkS algorithm. SHR makes use of probabilistic and statistical methods which also has linear time complexity [1]. GMTB algorithm is a kind of the dynamic programming alignment algorithm whose time complexity is O(logn) [7]. So, these three algorithms have good time complexity. In order to achieve the contrast experiments, three algorithms are implemented by use of Java programming language and executed in the same hardware environment.
First of all, Smin=0.8 is given and k=2 is employed for SDkS algorithm. And then, we select six
DNA sequences and three sequence fragments which are same as the data in literature [1]. That is to say, S1=V0062, S2=U20753, S3=D38114, S4=V00711, S5=AJ001588, and S6=AJ002189. All of them
can be downloaded from the National Center for Biotechnology Information website (See: http://www.ncbi.nlm.nih.gov). Three fragments are: D1=GATCACAGGTCT, D2=CTGAGATCTGA,
and D3=TCGATCTGACTTT respectively. In each experiment, we record two things: (1) the
[image:4.595.66.474.70.306.2]conclusion of sequence alignment (c), the value of which is T or F, i.e., matching or mismatching; and (2) the time to obtain this conclusion (t), whose unit is second.
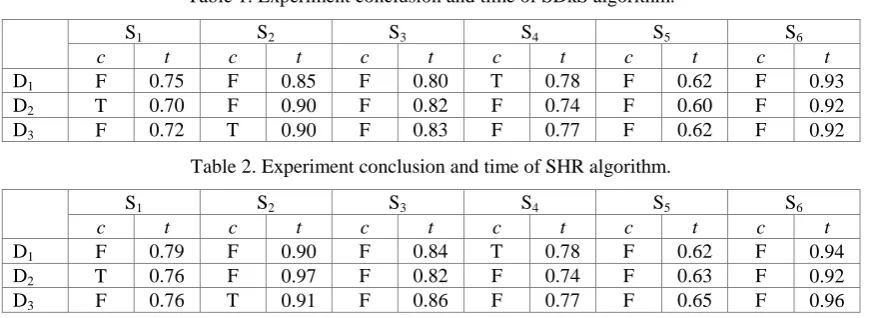
Table 1. Experiment conclusion and time of SDkS algorithm.
S1 S2 S3 S4 S5 S6
c t c t c t c t c t c t
D1 F 0.75 F 0.85 F 0.80 T 0.78 F 0.62 F 0.93
D2 T 0.70 F 0.90 F 0.82 F 0.74 F 0.60 F 0.92
D3 F 0.72 T 0.90 F 0.83 F 0.77 F 0.62 F 0.92
Table 2. Experiment conclusion and time of SHR algorithm.
S1 S2 S3 S4 S5 S6
c t c t c t c t c t c t
D1 F 0.79 F 0.90 F 0.84 T 0.78 F 0.62 F 0.94
D2 T 0.76 F 0.97 F 0.82 F 0.74 F 0.63 F 0.92
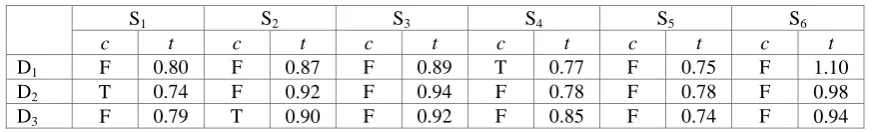
[image:4.595.82.518.613.772.2]Table 3. Experiment conclusion and time of GMTP algorithm.
S1 S2 S3 S4 S5 S6
c t c t c t c t c t c t
D1 F 0.80 F 0.87 F 0.89 T 0.77 F 0.75 F 1.10
D2 T 0.74 F 0.92 F 0.94 F 0.78 F 0.78 F 0.98
D3 F 0.79 T 0.90 F 0.92 F 0.85 F 0.74 F 0.94
From the above three tables, we can obtain the same conclusions: D1 and S4 are matched, D2 and S1
are matched, as well as D3 and S2 are matched. These show that SDkS algorithm has correctness. On
the other hand, when we deal with the same data set in the same experimental environment, SDkS algorithm costs less time than SHR algorithm and GMTP algorithm in most time. Thus, we can conclude that SDkS algorithm has better performance of effectiveness.
Summary
DNA Sequence Alignment is one of the most basic and most important operations in bioinformatics. In this paper, we put forward to SDkS algorithm based on k-tuple statistic which is better applicable for pair-wise sequence alignment. SDkS algorithm is a kind of probability method because DNA sequences satisfy the Markov model. Therefore, we first calculate the positive transition probability matrix and the negative transition probability matrix for one DNA sequence. And then, the logarithmic ration is computed by use of the two transition probability matrices. In order to obtain the results of k-tuple statistic, we convert the sequence comparison into a sequence of matching or mismatching. Subsequently, the similarity measurement can be gained according to above parameters. If the minimum support is given, we can identify two DNA sequences is similarity or not. The contrast experiments are done between our SDkS algorithm and other two different algorithms. The experimental results show that SDkS algorithm has better effective performance in saving computing time. SDkS algorithm has its limitation. It is very time consuming when it is used to process multiple sequence alignment problems.
Acknowledgement
This research was financially supported by the Education Department of Sichuan Province of China (No. 15ZB0373).
References
[1] J. Y. Zhang, C. H. Yang, X. D. Chen, DNA Sequence Homology Recognition based on Similarity Measurement, Proc. of International Conference on Intelligent Systems Research and Mechatronics Engineering, (2015) 96-100.
[2] Z. R. Chen, Assessing sequence comparison methods with the average Precision criterion, J. Bioinformatics, 19 (2012) 2456-2460.
[3] L. Jose, R. Daniel, S. Anuj, RNA global alignment in the joint sequence-structure space using elastic shape analysis, J. Nucleic Acids Research, 4 (2013) 34-52.
[4] X. Y. Zhu, K. L. Li, A. Salah, A data parallel strategy for aligning multiple biological sequences on multi-core computers, J. Computers in Biology and Medicine, 3 (2013) 123-131.
[5] M. Orobitg, F. Cores, C. Notredame, Improving multiple sequence alignment biological accuracy through genetic algorithms, J. Supercomputing, 6 (2013) 53-61.
[7] F. Ye, N. Yi, Y. F. Wang, EM algorithm for training high order hidden Markov model with multiple observation sequences, J. Information and Computational Science, 8 (2011) 1761-1777.
[8] J. Y. Zhang, C. H. Yang, Research on DNA Sequence Homology based on Second Order Markov Model, J. Fiber Bioengineering and Informatics, 8 (2015) 539-546.