2017 2nd International Conference on Computational Modeling, Simulation and Applied Mathematics (CMSAM 2017) ISBN: 978-1-60595-499-8
Reliability Prediction of Power Communication Network Based on BP
Neural Network Optimized by Genetic Algorithm
Ji-hai YANG
1, Xi-dan PENG
2and Yu-jian CHAO
31Full addState Grid Jiangxi Electric Power Company Information & Telecommunication Branch,
Nanchang 330077, China
2Grid Jiangxi Electric Power Company, Nanchang 330077, China
3NARI Group Corporation State Grid Electric Power Research Institute, Nanjing 210003, China
Keywords: Power communication network reliability index system BP neural network genetic algorithm.
Abstract. The power communication network is a communication network which serves the power
system. Its reliability has an important influence on the safe and stable operation of the power system. It is of great practical significance to study the reliability of the power communication network. However, the current research on the power communication network lag, the reliability of the quantitative measurement, in practice, mostly artificial evaluation of the business, subjective and arbitrariness. In order to achieve the transition from expert to data-driven, this paper is based on the business segment, with two sites and between a cable as a research object. Based on the construction of the index system, BP neural network and genetic algorithm optimization BP neural network prediction model are established respectively. Using the real data and simulation data of the national grid in Jiangxi Province, the empirical experiment is carried out to compare the effect of the model. The example shows the effectiveness of the model.
Introduction
Power communication network is a digital carrier-based, power line carrier communication, supplemented by optical transmission network, scheduling data network, integrated data network and communication monitoring network and other complex network [1], requires a high degree of stability , In order to make the power system can respond quickly, the deployment of intelligent communication infrastructure is a key step [2]. Therefore, the power system is highly dependent on the communication network, making the reliability of power communication network research is placed in a very important position [3,4].
Most of the existing research using qualitative analysis, from the communication network and the two aspects of business analysis model [5,6]. Some theoretical research focuses on the reliability of power communication network construction and development direction and the method of safety maintenance and management [7,8]. From the topological structure, there are some quantitative methods to form the reliability logic model based on the series-parallel reliability relation model [9], and the clustering properties of the local network, considering the node reliability, the link Reliability and link weight, to calculate the reliability of clustering [10].
Reliability Model of Power Communication Network
Business Model
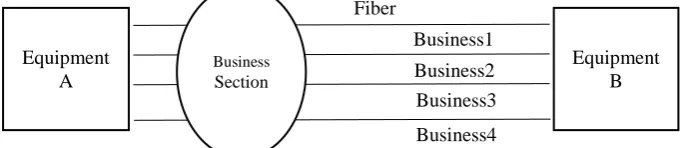
[image:2.595.137.482.159.233.2]The service section refers to the sum of all kinds of services carried on a physical line composed of all the communication lines and nodes between the two communication nodes in the communication network. The composition of the business section is shown in Figure 1.
Figure 1. Schematic diagram of the business section.
The research object is based on the business in the business model, and each service passes through one of the simplest physical links between the communication nodes A and B, that is, one of the two communication nodes (stations) and one of the middle optical cables Physical line, we focus on one of the business, that is, a simplified physical line of a business as a research object.
Reliability Model
In the actual scenario, the power communication network is composed of fiber optic cable and site, the site has a variety of equipment, fiber optic cable and equipment to calculate the time ratio of failure. There are load balancing in the practical application as the guarantee of reliability, that is, the route between the two nodes can communicate more than one, when a device or cable failure, there will be other equipment or fiber cable to complete the normal communication.
A common reliability model at both ends is a device with an optical cable in the middle. Assume that a physical route through a service consists of device A, device B, and cable C. In a period of
time Tinterval the time of failure occurs A, B, C respectively. The definition of reliability R
is RABC. In the application will also appear the following: 1. cable parallel: two devices between the two cables, one of which as a backup. Assuming device A, device B, fiber
optic cable C1 and cable C2, the reliability is defined as RAB(C1 C2). 2. The parallel equipment: the end of the line by two can replace each other equipment. Assuming
equipment A1,A2, B and fiber C, the reliability is defined as: R(A1 A2)B C.
Power Communication Network Business Reliability Index System
Factors that affect the reliability of the power communication network from the network itself can be divided into internal factors and external factors, external factors mainly refers to some controllable or uncontrollable environmental factors or emergencies. Internal factors refer to the reliability of the communication equipment itself, the network topology design, the network organization and management and operation and maintenance. The key to the reliability research of power communication network lies in the development of a set of practical and complete measurement indicators, and use these indicators to evaluate the reliability of power communication network and improve the reliability of communication network [11]. Reliability design objectives should focus on the whole network, in the scope of the study and reliability measures should be toward a higher level of expansion [12]. And the reliability index system of power communication network should be different from the public network, has its own characteristics [13]. Based on the concept of reliability stratification, this paper analyzes the reliability factors of power communication network and constructs the corresponding reliability evaluation index system.
First determine the evaluation objectives, according to 1.2 in the use of equipment failure time to determine the reliability of the evaluation objectives, describes the business layer attributes. On the
Business1 Business2 Business3
Business4 Equipment
A
Equipment B
Business
Section
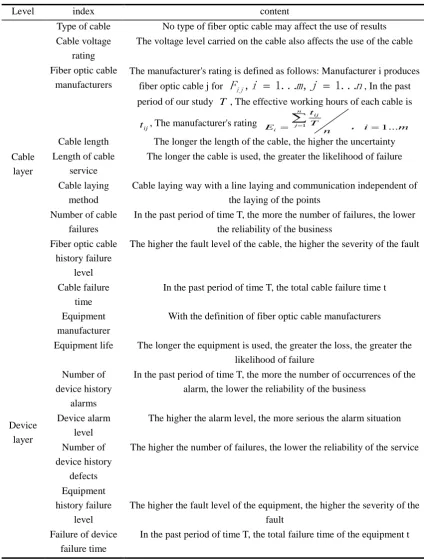
basis of the above factors, the 16 index system of the cable layer and the equipment layer are determined according to the principle of establishing the index.
Table 1. Indicator System Table.
Level index content
Cable layer
Type of cable No type of fiber optic cable may affect the use of results Cable voltage
rating
The voltage level carried on the cable also affects the use of the cable
Fiber optic cable manufacturers
The manufacturer's rating is defined as follows: Manufacturer i produces fiber optic cable j for Fij,i 1...m,j 1...n, In the past period of our study T, The effective working hours of each cable is
ij
t , The manufacturer's rating i m
n T t
E
n
j ij
i 1...
1
,
Cable length The longer the length of the cable, the higher the uncertainty Length of cable
service
The longer the cable is used, the greater the likelihood of failure
Cable laying method
Cable laying way with a line laying and communication independent of the laying of the points
Number of cable failures
In the past period of time T, the more the number of failures, the lower the reliability of the business
Fiber optic cable history failure
level
The higher the fault level of the cable, the higher the severity of the fault
Cable failure time
In the past period of time T, the total cable failure time t
Device layer
Equipment manufacturer
With the definition of fiber optic cable manufacturers
Equipment life The longer the equipment is used, the greater the loss, the greater the likelihood of failure
Number of device history
alarms
In the past period of time T, the more the number of occurrences of the alarm, the lower the reliability of the business
Device alarm level
The higher the alarm level, the more serious the alarm situation
Number of device history
defects
The higher the number of failures, the lower the reliability of the service
Equipment history failure
level
The higher the fault level of the equipment, the higher the severity of the fault
Failure of device failure time
In the past period of time T, the total failure time of the equipment t
Power Communication Network Business Reliability Forecasting Method
BP Neural Network Prediction
The BP algorithm steps are as follows: Enter the training sample, including the sample input X and
layer is n, the number of output nodes is m, and the number of hidden layer nodes, which are usually obtained according to the following formula or determined by experience and experiment.
10 1
,
m n d d
l Among them, i1,2,...,n,j1,2,...,l,k1,2,..,m; a. Network
initialization. Is the random value for the connection weight wij, wjk and the thresholds a, b are given the [-1, + 1] interval. b. Implicit and output layer output calculations. Connect the weights
and thresholds of the layers, calculate the hidden layer from the input layer input signal Hj, and
calculate the output layer by the hidden layer Ok,
n i j i ij j f x a H 1 ) ( ,
l j k jk jk H b
O
1
c. Error calculation and weight, threshold adjustment. Calculate the prediction error ek based on
the predicted output Ok and the expected output Y, and constantly adjust the initial set weights
and thresholds
m
k
k k
k Y O
e 1 2 ) ( 2 1
. d. Continue to calculate the transmission and error of the reverse propagation, calculate the global error E, by determining whether the global error tends to a
minimum to determine whether the end of training
m t m k k k O Y t E 1 1 2 ) ( 2 1 .Propagation of BP Neural Network Based on Genetic Algorithm
BP neural network has some drawbacks, such as easy to fall into the local extreme point of the error function or in some cases can not guarantee convergence to the global minimum point and the initial connection weight and threshold on the results of a large impact, but there is no fixed calculation method. Genetic algorithm is a global search optimization algorithm based on biological mechanism. In this paper, we combine the two together to optimize the initial weights and thresholds of the BP neural network by genetic algorithm, and then use the error back propagation method to find the optimal solution. Based on the BP neural network prediction, the genetic algorithm is used to optimize.
Genetic algorithm optimization BP neural network steps are as follows: a. Population
initialization. The length of the chromosome is S(N1).L(L1).M, a 3-layer BP neural network with N implicit layers of N input layers and M output layers. b. Fitness function. The prediction value of the predicted sample and the norm of the error matrix of the expected value are output as
the objective function
s
t m
k Yk Oks F 1 1 2 ) ( 2 1
. The fitness function uses the sorted fitness function, where obj is the output of the objective function. c. Selection, crossover and mutation. The crossover operator adopts the single-point crossover operator to generate the number of mutated genes with a certain probability, and randomly selects the genes that are mutated. d. Repeat b and c until the evolutionary algebra is reached or the error requirement is met. At this time, the connection weights and thresholds of BP neural networks optimized by genetic algorithm are obtained. Will be optimized as the initial weights and thresholds of the BP neural network. e. Conduct standard BP neural network training.
Example Analysis
Data Sources and Preprocessing
In the index system, the failure time of fiber optic cable and equipment are predicted by using the indicators of the transport layer and the index of the network element. The maximum and minimum normalized data are normalized to the 0,1 interval.
BP Neural Network Test Results
50 of the data of the equipment, randomly selected 40 of them as training set, the remaining 10 as a test set, the use of BP neural network to predict the 10 objects in the next month's failure time, the input data is normalized after the transport layer Index data. The average relative error predicted is 31032. For the 48 data of the cable, 40 of them were randomly selected as the training set and the remaining 8 were used as the test set. The BP neural network was used to predict the time of failure of the eight objects in the coming month. After the input data was normalized Index data. The predicted average relative error is 2500.
[image:5.595.84.512.286.347.2]Virtual three basic communication lines, given the corresponding equipment and fiber optic cable data, the use of BP neural network to predict the three lines of the evaluation results are as follows:
Table 2. Business reliability evaluation results table.
Line number Device A failure rate Device B failure rate Cable failure rate reliability
1 0.00228 0.00205 0.00425 0.99145
2 0.00240 0.00250 0.00470 0.99044
3 0.00191 0.00426 0.00493 0.98893
BP Neural Network Test Results Based on Genetic Algorithm Optimization
[image:5.595.90.506.434.610.2]The data predicted by the equipment is the same as above. The average relative error predicted is 24476. The data predicted by the cable are the same as above. The predicted average relative error is 2125.BP neural network based on genetic algorithm and ordinary BP neural network prediction of cable and equipment failure time duration comparison chart is as follows:
Figure 2. Equipment and cable prediction results comparison chart.
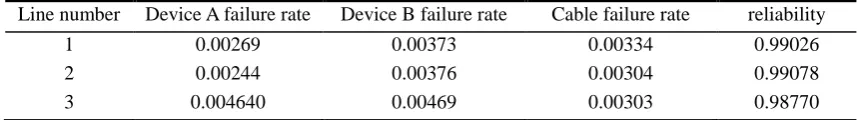
Virtual three basic communication lines, given the corresponding equipment and fiber optic cable data, the use of BP neural network to predict the three lines of the evaluation results are as follows:
Table 3. Business reliability evaluation results table.
Line number Device A failure rate Device B failure rate Cable failure rate reliability
1 0.00269 0.00373 0.00334 0.99026
2 0.00244 0.00376 0.00304 0.99078
3 0.004640 0.00469 0.00303 0.98770
From the prediction results of the two models, both models can effectively predict the fault time of the equipment or fiber optic cable on the basis of constructing the index system. Among them, the BP neural network based on genetic algorithm is better than ordinary BP Neural network, in
0 0.001 0.002 0.003 0.004 0.005
1 2 3 4 5 6 7 8 9 1 0
EQUIPMENT
FORECAST
Actual value GA optimization BP
0 0.001 0.002 0.003 0.004 0.005 0.006
1 2 3 4 5 6 7 8
CABLE FORECAST
Actual value GA optimization
[image:5.595.82.511.683.743.2]practice, BP neural network based on genetic algorithm can be used to predict the fault time of equipment and fiber optic cable, so as to calculate the failure rate and reliability.
Conclusion
Based on the factors influencing the failure of power communication network, this paper constructs the fault time-long forecasting index system from the two layers of transmission layer and network element layer, and quantifies each index. Then, based on this index system, BP neural network model and BP neural network based on genetic algorithm optimization are used to predict the fault time of each service. On the basis of business model, the quantitative reliability model is constructed, and the method of measuring reliability is given. The reliability of the predicted model can be used to evaluate the reliability of the business. Which provides a solution for quantitative evaluation of reliability.
References
[1] Chen Jiantao. National Electric Power Communication Network Integrated Monitoring and Management System [J]. Power System Communications, 2002 (8): 3-10.
[2] J.W. Hughes, D.W. Von Dollen. Developing an integrated energy and communications systems architecture: the initial steps. In: Proceeding of the Power Systems Conference and Exposition, 2004. IEEE PES 10-13. 2004. 1651-1654.
[3] C.H. Hauser, D.E. Bakken, A. Bose. A failure to communicate: next generation communication requirements, technologies, and architecture for the electric power grid. IEEE Power& Energy Magazine, 2005, 3(2):47~55.
[4] X. Zhaoxia, G. Manimaran, V. Vittal. An information architecture for future power systems and its reliability analysis. IEEE Transactions on Power Systems, 2002, 17(3): 857~863.
[5] Zeng Ying. Study on reliability analysis and evaluation method of power communication network [J]. Power System Communications, 2011, (08): 13-16.
[6] Liu Jian, Teng An, Fan Li-Feng, He Ping. Discussion on Reliability Analysis and Evaluation Method of Power Communication Network [J]. Communications, 2016, (15): 32-33.
[7] Zhang Xiaobin. Reliability Analysis of Power Communication System [J]. Science and Technology Outlook, 2017, (05): 99.
[8] Guo Pengfei. Study on reliability of power communication network [J]. Enterprise Technology Development, 2013, (Z2): 64-66.
[9] Li Jie, Li Gang, Chen Xi, Miao Xin, Zhao Han-Qi, Zhao Ziyan. Reliability model and simulation of power communication network [J]. Power System Communications, 2012, (01): 23-27.
[10] Zeng Ying, Zhu Wen-Hong, Zhang Nai-Fu, Tang Liang-rui. Research on Reliability Evaluation Method of Power Communication Network Based on Clustering Reliability [J]. Journal of Computer Applications, 2014, (S1): 21-27.
[11] Shaoyuan Huang, Bin Wang, Senping Tian. Study on the measurement index of reliability engineering of electric power communication network [J]. Power System Communications, 2008, 29 (192): 61-67.
[12] A.B. Godfrey, A.C. Endres. The evolution of quality management with IEEE Communications Magazine. 1994,32 (10): 26-34.