Urban Transit Routing Problem
Matthew P. John1,2, Christine L. Mumford1, and Rhyd Lewis2
1
Cardiff School of Computer Science & Informatics, Wales
2
Cardiff School of Mathematics, Wales
Abstract. The determination of efficient routes and schedules in public
transport systems is complex due to the vast search space and multi-ple constraints involved. In this paper we focus on the Urban Transit Routing Problem concerned with the physical network design of pub-lic transport systems. Historically, route planners have used their local knowledge coupled with simple guidelines to produce network designs. Several major studies have identified the need for automated tools to aid in the design and evaluation of public transport networks. We propose a new construction heuristic used to seed a multi-objective evolutionary al-gorithm. Several problem specific mutation operators are then combined with an NSGAII framework leading to improvements upon previously published results.
1
Introduction
The Urban Transit Network Design Problem (UTNDP) involves the determina-tion of an efficient set of routes and schedules for public transportadetermina-tion systems such as bus, rail and tram networks. Ceder and Wilson [1] identified five main stages for bus service planning: network design, frequency setting, timetable de-velopment, bus scheduling and driver scheduling. Given that each stage of the UTNDP is NP-hard [2], it is usually considered impractical to solve all the stages simultaneously.
In this paper we focus on the network design element, which is tasked with determining an efficient set of routes on an already established road (or rail) network, usually with previously identified pickup and drop off locations (e.g. bus stops). Building upon recently published work by Mumford [3], we present a much improved multi-objective approach based upon NSGAII [4]. Our approach considers the trade offs between passenger and operator costs by producing ap-proximate Pareto optimal sets for consideration by a human decision maker. Furthermore, we provide a discussion of the many specialised heuristics and operators we have tested during the development of our approach.
Historically, route planners have used a combination of local knowledge and simple guidelines to produce route sets. Several major studies (see [5, 6]) have identified the need for automated computer based tools for the design and eval-uation of public transport networks. Automation is, however, highly complex
and computationally expensive due to the large search space and multiple con-straints involved in public transportation planning. The increase in congestion, pollution, greenhouse gas emissions and dwindling oil resources have placed em-phasis on the use of public transport in recent years in an attempt to reduce the reliance of the private car. Achieving an increase in public transportation usage is clearly desirable but is also an extremely complex issue. However frequent and reliable cost-effective services are clearly key attributes.
Bagloee and Ceder [7] have recently pointed out that many public transit net-works have not been reappraised from anywhere between 20 to 50 years. Land use patterns have changed considerably in this time period with the migration away from town centres into surrounding suburban areas; however public trans-port has been relatively slow to respond. It is our view that the development of automated tools to aid public transport networks is timely.
Prior to 1979, the few papers published on the UTNDP considered only highly specific problem instances [8, 9]. In 1979, Christoph Mandl [10, 11] approached the problem in a rather more generic form. He concentrated on the network de-sign phase, and developed a two-stage solution. First a set of feasible routes is generated, second, heuristics are applied to improve the quality of the routes in this set. Following Mandl’s pioneering work, heuristic methods have been widely used to solve the UTNDP, e.g. [1, 12]. With the advancement of computing tech-nology over the last two decades however, metaheuristic techniques have become increasingly popular for solving these problems, particularly genetic algorithms (GAs) [13–16]. Other metaheuristic methods such as tabu search and simulated annealing can also be seen in [17, 18]. Nevertheless, comparative work has been limited to Mandl’s 15 vertex instance.
One of the first approaches using a GA was proposed by Pattnaik et al. [15] utilising a route set generation procedure guided by a demand matrix, designer knowledge, and route constraints to produce a set of candidate routes. The role of the GA is simply to select a number of routes from the candidate set, where each route is given a unique identifier encoded in binary. This approach is similar to those proposed by Tom and Mohan [16] and Fan and Machemehl [19].
Chakroborty and Dwivedi [14] generated an initial set of candidate route sets each with a fixed number of routes. A GA was then applied using two crossover operators: 1) Inter-string crossover which exchanges routes from the parent route sets, and 2) Intra-string crossover which exchanges parts of a route in a parent if two routes share a common vertex. Mutation is then applied by randomly selecting a vertex and changing it to any of its acceptable adjacent vertices.
Similar to Chakroborty and Dwivedi, Fan et al. [20] generated an initial population of feasible route sets. Their GA used a mutation operator where a vertex can be either added to the end of a route or removed from the start. However, their GA lacked a crossover operator.
Bagloee and Ceder [7] tackled real sized road networks using a combination of heuristics, a GA and an ant-system. They determined the location of stops based upon the distance to high concentrations of travel demand and then used a system inspired by Newtonian gravity theory to produce a set of candidate
routes. A GA was then used to search through the candidate routes to find a good solution – the frequencies of the routes was computed simultaneously.
Recently Mumford [3] presented an approach using a constructive heuristic to generate an initial population. This was then evolved using a multi-objective evolutionary algorithm (MOEA). Mumford’s crossover operator alternates the selection of routes between two parents, favoring routes containing vertices that are not currently present in the partial solution, while ensuring route connec-tivity. Two mutation operators are also proposed that add or delete a bounded random number of vertices from a route set. Four benchmark instances based on real-world bus route networks were also created and made publicly available [3].
2
Problem Description
The network design problem can be formally stated as follows. Given a graph
G= (V, E) where V ={v1, . . . , vn}is a set of vertices andE ={e1, . . . , em} is a set of edges, we are given:
– A weight for each edge,Wei, which defines the time it takes to traverse edge ei;
– A matrixDn×n whereDvi,vj gives the passenger demand between a pair of
verticesvi andvj.
A route Ri is defined as a simple path (i.e. no loops/repeated vertices) through the graphG. LetGRi = (VRi, ERi) be the subgraph induced by a route Ri. A solution is defined as a set of overlapping routesR={R1, . . . , Rr} where the number of routes,r, and the minimum,m1, and maximum,m2, number of vertices in a route are to be specified by the user. In order forRto be valid the following conditions must hold:
|R| [ i=1 VRi=V (1) m1≤ |VRi| ≤m2∀Ri∈ R (2) GR= ( |R| [ i=1 VRi, |R| [ i=1 ERi) is connected (3) |R|=r (4)
Constraint (1) ensures that all vertices in V are in at least one route in R. Constraint (2) specifies that each route should contain between m1 andm2 vertices (these values are based on considerations such as driver fatigue and the difficulty of maintaining the schedule [6]). Constraint (3) specifies that a path exists between all pairs of vertices in GR. If Constraint (1) is satisfied then
GR= (V, |R|
S
i=1
ERi). Finally, Constraint (4) ensures that the solution contains the
correct number of routes.
For this problem formulation, the following assumptions are also made: 1. There will always be sufficient vehicles on each routeRi∈ Rto ensure that
the demand between every pair of vertices is satisfied.
2. A vehicle will travel back and forth along the same route, reversing its di-rection each time it reaches a terminal vertex.
3. The transfer penalty (representing the inconvenience of moving from one vehicle to another) is set at a fixed constant. In this study a value of 5 minutes is used in line with previous studies (e.g. [14, 21]).
4. Passenger choice of routes is based on shortest travel time (which includes transfer penalties).
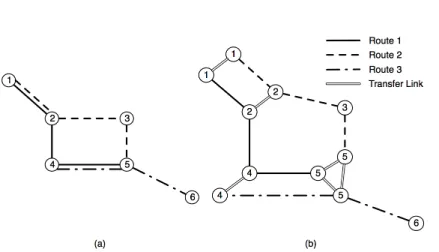
In this problem we consider both thepassenger costandoperator cost. In gen-eral, passengers would like to travel to their destination in the shortest possible time, but avoiding the inconvenience of making too many transfers. We define a shortest path between two vertices using the route set Ras αvi,vj(R). A path
may include both transport links and transfer links (a transfer link facilitates the changing from one vehicle to another with the associated time penalty). This is shown in Fig. 1 with the original network expanded to include transfer vertices and transfer links. The shortest path evaluation is thus completed on the transit network Fig. 1(b). The minimum journey time,αvi,vj(R), from any given pair of
vertices is thus made up of two components: in vehicle travel time and transfer penalty. We define thepassenger cost for a route setRto be the mean journey time over all passengers as given by Mumford [3]:
F1(R) = Pn i,j=1Dvi,vjαvi,vj(R) Pn i,j=1Dvi,vj (5) Operator costs depend on many factors, such as the number of vehicles needed to maintain the required level of service, the daily distance travelled by the vehicles and the costs of employing sufficient drivers. We use a simple proxy for operator costs: the sum of the costs (in time) for traversing all the routes in one direction, as given by Mumford [3]:
F2(R) = X ∀Ri∈R X ∀ej∈Ri Wej (6)
3
Methodology
In this paper we propose an approach that seeds a MOEA with a high qual-ity initial population formed using a powerful heuristic construction procedure. NSGAII [4] is then used with the crossover and repair operators proposed by Mumford [3] along with several new mutation operators.
Fig. 1.(a) Route network – road network with routes overlayed (b) Transit network – network used for evaluation.
3.1 NSGAII
NSGAII is an elitist non-dominated sorting MOEA widely used to solve multi-objective optimization problems. It has been shown to find a better spread of solutions and convergence nearer to the true Pareto-optimal front compared with other Pareto based methods [4] .
The basic form of an NSGAII generation proceeds by creating an offspring population of size N. This is then combined with the parent population of size
N to produce a population, P = {R1,R2, . . . ,R2N}. Let us now define two attributes of a route setRi: 1)Rirank the non-dominated front thatRi belongs
to, and 2)Ridistthe crowding distance associated withRias defined by Deb et al.
[4]. P is then sorted such that∀Ri,Rj ∈P Rirank ≤ Rjrank andRidist ≥ Rjdist
fori < j. The successor population is then formed by taking the firstNsolutions
in P.
Similar to [4], in our case a new population is generated using binary tourna-ment selection with a crossover probability of 0.9. The probability of mutating each route in an offspring is set as 1r.
3.2 Heuristic Construction
As mentioned earlier, heuristic construction was widely used for the network design stage before the use of metaheuristic algorithms became more widespread in the literature. Our construction heuristic creates solutions by incorporating knowledge that exploits the underlying structure of the problem.
The majority of previous approaches for tackling network design (see [18, 19, 15]) generate a candidate pool of routes using Dijkstra’s shortest path algorithm and Yen’s [22] k-shortest path algorithm to enumerate all possible routes. An optimization algorithm is then applied to find the best combination of routes from the candidate pool, although there is still no guarantee that the optimal
configuration of routes will be selected. As such we have chosen to combine our approach with that used by Shih and Mahmassani [21] with modifications to produce route sets that balance the cost to the operator and passengers whilst ensuring the constraints of the problem are adhered to. Shih and Mahmassani [21] generate an initial route set using a heuristic procedure that continually adds routes until user-defined levels on directness and coverage are reached. This contrasts with our approach where the number of routes is fixed. Furthermore, our method ensures that all vertices are present within a route set, allowing a passenger to reach any vertex in the network using transfers if necessary.
Our approach generates a set of weighted graphs using a weighted sum of normalized travel time and (1 −normalized demand) with weights specified in advance by the user. A route set, R, is then generated from a given weighted graph. A spanning subgraph is first created using an iterative procedure with the objective of minimizing the sum of the weighted edge costs. In the first iteration of this procedure the pair of vertices (seed pair) with the lowest weighted edge cost are selected. In subsequent iterations a seed pair contains one vertex already contained in the subgraph, ensuring that routes remain connected. A seed pair is then expanded to form a route by adding adjacent vertices.
During this expansion process vertices that are adjacent to the first or last vertex in the route are sorted against their weighted edge cost. The minimum cost unused vertex is then added to the route. If there are no unused vertices the minimum cost adjacent vertex is instead added to the route providing of course that the vertex is not present in the current route under construction. If multiple vertices are in the set of potential vertices with equal weight a random vertex from this set is selected. Vertices are continually inserted until a vertex can no longer be inserted that would not cause a constraint to be violated.
Providing that |R|< r the next stage of the heuristic procedure is applied using an approach utilized by Shih and Mahmassani [21]. The vertex pairs (vi, vj) that are yet to be satisfied directly (i.e. it is not possible to travel between the vertices without having to make a transfer) are extracted from the network and sorted in non-ascending order based upon the demand Dvi,vj. The unsatisfied
vertex pairs are taken in order and Yen’s k-shortest path algorithm is applied to determine if a valid route, originating at vi and terminating at vj, can be constructed that obeys all of the constraints. In our case a maximum of ten ‘shortest’ paths are explored for each vertex pair. An alternative to satisfying the vertex pairs that are not satisfied directly is to minimize the travel time for passengers on high demand vertex pairs. In this instance all the vertex pairs are extracted and sorted based upon non-ascending demand. If a valid route is found, the cost of the route is calculated and compared with theαvi,vj(R). If the
cost is less than αvi,vj(R) the route is inserted into R. This process is applied
iteratively until|R|=r. 3.3 Genetic Operators
Crossover: We use the crossover operator proposed by Mumford [3], which en-sures that the problem constraints are obeyed. Given two parents, the crossover
operator constructs an offspring, R0, by alternatively selecting a route from
each parent that maximises the proportion of unseen vertices, until |R0| = r.
The set of unseen vertices is defined as Vunseen = V −VR0. Consider a route Ri =h1,7,8,9,12,14i that is contained in one of the parents and is being con-sidered for insertion into R0. If R0 = {R
1} where R1 = h12,15,0,5,3i then
Vunseen=Ri−R1={1,7,8,9,14}. Therefore the proportion of unseen vertices is |Vunseen|
|Ri| =
5
6 in this case.
After crossover has been applied it is possible that the offspring will not contain all the vertices inV. In these cases the repair procedure used by Mumford is applied that attempts to add the missing vertices to either the back or front of the routes.
Mutation: In our approach eight mutation operators are used. Some of these apply heuristics to mutate the route set in a way that encourages an improvement in quality. Mutation must be carefully controlled to prevent violation of the prob-lem constraints. The names of these mutation operators areadd-nodes,del-nodes,
exchange,merge,replace, remove-overlapping,two-opt andinvert-exchange.
Add-nodesanddel-nodeswere both proposed in [3]. At the start ofadd-nodes
ordel-nodesan integerI is generated uniform randomly in the range [1,r×m2
2 ], giving the number of vertices to be added or removed fromR. A routeRi ∈ R is then selected at random and, in the case ofadd-nodes, vertices are added to the end of the route until the addition of a vertex would cause Constraint (2) to be violated or, result in Ri no longer being a simple path. Following a similar approach, vertices are then added to the front of the route if possible. This process is repeated for eachRi∈ RuntilI vertices have been added toRor all routes have been exhausted. The case is the same for del-nodes withI vertices being removed fromRwhilst ensuring feasibility.
TheExchange operator, as proposed by Mandl [10], selects a route at
ran-dom. The route set is then searched to determine if there exists a route with a common vertex to the selected route. The problem constraints are also checked to determine ifRwill be valid after the mutation has been applied. If valid, the two routes are split at the first common vertex, creating four route segments. The two original routes are then replaced by exchanging the segments to create two new routes. The exchange of route parts attempts to reduce the number of transfers passengers must make.
Similar toexchange, themergeoperator, selects a random route and searches the remaining routes to find a route that shares a common terminal vertex. The two routes are then merged creating one continuous route, disregarding one of the common terminal vertices – providing that Constraint (2) is not violated and the merged route is a simple path. If successful, a route generation procedure (route-gen) is then used to generate a new route for insertion. The route generation procedure is as follows: vertex pairs that are not yet satisfied directly are extracted from the route set and sorted via non-ascending demand (i.e. given every pair of vertices in the network we are only interested in those that cannot be reached without transfers, given the current configuration ofR).
Yen’sk-shortest path algorithm is then used to generate a bounded number of paths, in our case ten, between the two vertices and a random path selected for insertion. If the number of vertex pairs yet to be satisfied directly is zero, a path is generated between the vertices with the highest demand in the network.
TheReplace operator removes a routeRi∈ Rthat satisfies the least demand
directly compared with all other routes inR. A replacement route is then gener-ated using theroute-genprocedure described above. The purpose of thereplace
mutation is to sacrifice routes that serve a relatively low demand in place of high demand routes.Replace can cause a route set to become invalid if the removed route acted as a transfer hub for routes, i.e. the route set was only connected when the removed route was present. If this situation occurs the repair proce-dure used during crossover is applied and, if successful, the mutated solution is returned. Otherwise the mutation is abandoned.
The Remove-overlapping operator replaces a route that is a subset of
an-other route. If an overlapping route is discovered, it is removed and the route generation procedure described above is used to produce a replacement route. Replacing the route provides the operator with the ability to remove duplicate services and use these resources to serve other passenger demand.
Two-opt, proposed in 1958 by Croes [23] for use with the traveling salesman
problem selects two vertices at random in a route and inverts the vertices between them. Its original purpose was to remove crossover points in a route, however this is not allowed to occur in this context. In our case it reorders the vertices in a route attempting to reduce the travel time between vertex pairs, abandoning infeasible attempts.
Invert-exchange selects two routes at random and generates two random
index locations. The vertices between the two random index locations are then inverted and exchanged between the two routes. For example, given two routes
R1 = h3,5,8,10,12,15i and R2 = h1,6,9,8,11,7i with the selected indices of
3 and5. We invert everything inR1 between the indices givingh12,10,8ithen replace the vertices in R2 between the indices with the inverted section from
R1. In this case the resultant two routes would be R3 =h3,5,11,8,9,15i and
R4 = h1,6,12,10,8,7i. Invert-exchange attempts to decrease the travel time
between vertices and prevent passengers having to make a transfer. Similar to
two-opt there is a high possibility that the majority of routes created using this
approach will be infeasible. As such, two routes are continually chosen at random until the routes have been exhausted or a feasible solution has been found.
4
Results
In this section we show how the algorithm of Mumford [3] (Algorithm A), based on the SEAMO2 framework, can be improved, by seeding the MOEA with our heuristically generated solutions (Algorithm B). We then look at the effects of adding our mutation operators (Algorithm C) and finally look at the effects of using the NSGAII framework (Algorithm D) as opposed to SEAMO2. All exper-iments use an initial population of size 200 and are run for 200 generations, the
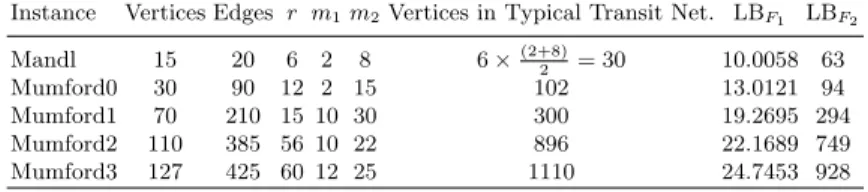
Table 1.Problem instances used for comparison with the lower bound (LB) for each objective.
Instance Vertices Edges r m1m2Vertices in Typical Transit Net. LBF1 LBF2
Mandl 15 20 6 2 8 6×(2+8) 2 = 30 10.0058 63 Mumford0 30 90 12 2 15 102 13.0121 94 Mumford1 70 210 15 10 30 300 19.2695 294 Mumford2 110 385 56 10 22 896 22.1689 749 Mumford3 127 425 60 12 25 1110 24.7453 928
same as in [3] so that valid comparisons can be made. Running times range from a couple of seconds for Mandl’s instance up to two days for Mumford3. Twenty replicate runs are used and the results have been combined into approximate Pareto sets for comparison. Problem instances generated by Mumford [3] along with Mandl’s [10] benchmark are used. Table 1 summarises the details of each instance along with the parameters used and lower bounds as given in [3].
Using our heuristic construction procedure, a subset of unique solutions are randomly selected for insertion into an initial population. Randomly generated solutions are then used to top-up the initial population if there are too few heuristic solutions. These random solutions are created using the same approach as Mumford [3] to seed her MOEA. In summary this approach constructs a route set one route at a time. A route length is randomly generated between
m1 and m2 and a random vertex, v ∈ V, is selected as the seed. A randomly selected adjacent vertex is then added to the back of the route, and this process is repeated. Once the vertices that can be added to the back are exhausted the process is repeated from the front of the route until the desired length is achieved.
We firstly augment Mumford’s SEAMO2 algorithm with our heuristic method for generating the initial population (Algorithm B). Table 2 presents the best solutions from the passenger and operator perspective compared to the findings of [3]. We see that our heuristic is clearly beneficial, producing an improvement over all the instances. Where an improvement is made in the objective value, ei-ther from the passenger or operator perspective, we can see that an improvement is also made to the other objective on the majority of instances. An improve-ment from the operator perspective on Mandl’s instance is not possible as 63 is the lower bound for this instance [3]. However, a decrease is observed in the passenger objective associated with the operator objective of 63 compared to that found by Mumford.
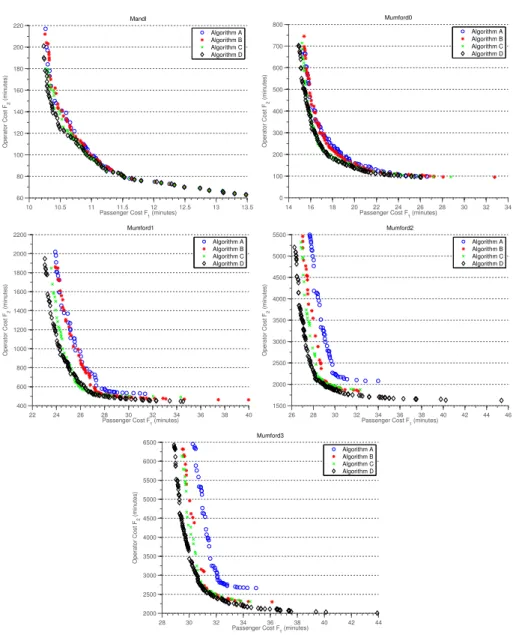
Taking the best algorithm (Algorithm B) from the previous experiment we now examine the effect of augmenting the algorithm with our proposed mutation operators. Comparing S-metric values for Algorithms B and C (Table 3) we can see that an improvement is achieved with all instances apart from Mumford2. If the Pareto set is plotted for Mumford2 (Fig. 2) it can be seen that there is an improvement in the passenger objective for the majority of solutions. However, we struggle to make improvements in the extremes of the operator objective.
Table 2. Best objective values extracted from twenty replicate runs using heuristic seeding for the initial population (Algorithm B). Mumford’s [3] results are given in brackets.
Mandl Mumford0 Mumford1 Mumford2 Mumford3
Best for F110.25(10.33)15.40(16.05)23.91(24.79)27.02(28.65)29.50(31.44)
passengerF2212(224) 745(759) 1861(2038) 5461(5632) 6320(6665)
Best for F113.48(15.13) 32.78(32.40) 39.98(34.69) 32.33(36.54) 36.12(36.92)
operator F263(63) 95(111) 462(568) 1875(2244) 2301(2830)
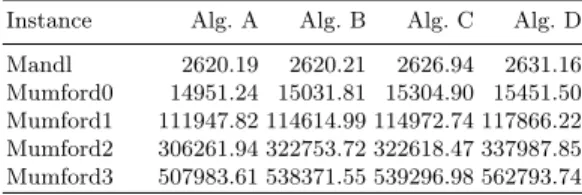
Table 3. S-metric comparison over the five benchmark instances for our proposed
modifications.
Instance Alg. A Alg. B Alg. C Alg. D
Mandl 2620.19 2620.21 2626.94 2631.16
Mumford0 14951.24 15031.81 15304.90 15451.50
Mumford1 111947.82 114614.99 114972.74 117866.22
Mumford2 306261.94 322753.72 322618.47 337987.85
Mumford3 507983.61 538371.55 539296.98 562793.74
Given the popularity of NSGAII and its stated ability to produce a Pareto set closer to the true Pareto-optimal front compared with other Pareto based meth-ods [4], it was used instead of SEAMO2 in our third set of experiments. Here, we used our mutation operators and heuristic seeding, together with Mumford’s crossover operator. As mentioned earlier a probability of crossover and mutation of 0.9 and 1r respectively are used. A comparison of S-metric values, Table 3, shows that NSGAII gives an improvement over all the problem instances. This is displayed graphically in Fig. 2. These improvements can be attributed to the fol-lowing: 1) A higher selection pressure compared with SEAMO2, and 2) Increased rate of mutation leading to a greater exploration of the search space.
5
Conclusion
This paper has presented a new construction heuristic for creating initial so-lutions to the transit network design problem. For this problem it has been shown that the use of heuristic solutions in a MOEA’s initial population can produce an improvement in the resultant Pareto set – compared with the use of solely randomly generated solutions. Several mutation operators have also been proposed and combined with our construction heuristic to produce an im-provement over previously published results. Finally, we have also shown that further improvements can be found if NSGAII is used in place of SEAMO2. We are currently investigating the introduction of frequency setting to the MOEA framework using more realistic evaluation, allowing our model to more accu-rately reflect passenger choice. In addition we are collecting real-world data to enable the production of more benchmark instances.
10 10.5 11 11.5 12 12.5 13 13.5 60 80 100 120 140 160 180 200 220 Mandl
Passenger Cost F1 (minutes)
Operator Cost F 2 (minutes) Algorithm A Algorithm B Algorithm C Algorithm D 14 16 18 20 22 24 26 28 30 32 34 0 100 200 300 400 500 600 700 800 Mumford0
Passenger Cost F1 (minutes)
Operator Cost F 2 (minutes) Algorithm A Algorithm B Algorithm C Algorithm D 22 24 26 28 30 32 34 36 38 40 400 600 800 1000 1200 1400 1600 1800 2000 2200 Mumford1
Passenger Cost F1 (minutes)
Operator Cost F 2 (minutes) Algorithm A Algorithm B Algorithm C Algorithm D 26 28 30 32 34 36 38 40 42 44 46 1500 2000 2500 3000 3500 4000 4500 5000 5500 Mumford2
Passenger Cost F1 (minutes)
Operator Cost F 2 (minutes) Algorithm A Algorithm B Algorithm C Algorithm D 28 30 32 34 36 38 40 42 44 2000 2500 3000 3500 4000 4500 5000 5500 6000 6500 Mumford3 Passenger Cost F 1 (minutes) Operator Cost F 2 (minutes) Algorithm A Algorithm B Algorithm C Algorithm D
Fig. 2.Combined Pareto fronts extracted from twenty runs for each of the five
bench-mark instances using the four algorithms.
References
1. Ceder, A., Wilson, N.H.M.: Bus network design. Transportation Research Part B 20(4) (1986) 331–344
2. Magnanti, T.L., Wong, R.T.: Network design and transportation planning: Models
3. Mumford, C.L.: New heuristic and evolutionary operators for the multi-objective
urban transit routing problem. Evolutionary Computation (CEC), 2013 IEEE
Congress on (2013) 939–946
4. Deb, K., Pratap, A., Agarwal, S., Meyarivan, T.: A fast and elitist multiobjective genetic algorithm: NSGA-II. IEEE Transactions on Evolutionary Computation 6(2) (2002) 182–197
5. Nielsen, G., Nelson, J.D., Mulley, C., Tegner, G., Lind, G., Lange, T.: Public transport–planning the networks. HiTrans Best Practice Guide. (2005)
6. Zhao, F., Gan, A.: Optimization of transit network to minimize transfers. (2003) 7. Bagloee, S.A., Ceder, A.A.: Transit-network design methodology for actual-size
road networks. Transportation Research Part B45(10) (2011) 1787–1804
8. Lampkin, W., Saalmans, P.D.: The design of routes, service frequencies, and sched-ules for a municipal bus undertaking: A case study. OR (1967) 375–397
9. Silman, L.A., Barzily, Z., Passy, U.: Planning the route system for urban buses.
Computers & Operations Research1(2) (1974) 201–211
10. Mandl, C.E.: Applied network optimization. Academic Pr (1979)
11. Mandl, C.E.: Evaluation and optimization of urban public transportation networks.
European Journal of Operational Research5(6) (1980) 396–404
12. Baaj, M.H., Mahmassani, H.S.: Hybrid route generation heuristic algorithm for
the design of transit networks. Transportation Research Part C3(1) (1995) 31–50
13. Agrawal, J., Mathew, T.V.: Transit route network design using parallel genetic
algorithm. Journal of Computing in Civil Engineering18(3) (2004) 248–256
14. Chakroborty, P., Dwivedi, T.: Optimal route network design for transit systems
using genetic algorithms. Engineering Optimization34(1) (2002) 83–100
15. Pattnaik, S.B., Mohan, S., Tom, V.M.: Urban bus transit route network design
using genetic algorithm. Journal of Transportation Engineering 124(4) (1998)
368–375
16. Tom, V.M., Mohan, S.: Transit route network design using frequency coded genetic
algorithm. Journal of Transportation Engineering129(2) (2003) 186–195
17. Fan, W., Machemehl, R.B.: A tabu search based heuristic method for the transit route network design problem. Computer-aided Systems in Public Transport (2008) 387–408
18. Fan, W., Machemehl, R.B.: Using a simulated annealing algorithm to solve the
transit route network design problem. Journal of Transportation Engineering
132(2) (2006) 122–132
19. Fan, W., Machemehl, R.B.: Optimal transit route network design problem with variable transit demand: genetic algorithm approach. Journal of Transportation
Engineering132(1) (2006) 40–51
20. Fan, L., Mumford, C.L., Evans, D.: A simple multi-objective optimization algo-rithm for the urban transit routing problem. Evolutionary Computation, 2009. CEC’09. IEEE Congress on (2009) 1–7
21. Shih, M.C., Mahmassani, H.S.: A design methodology for bus transit networks with coordinated operations. Technical Report SWUTC/94/60016-1 (1994) 22. Yen, J.Y.: Finding the k shortest loopless paths in a network. Management science
17(11) (1971) 712–716
23. Croes, G.A.: A method for solving traveling-salesman problems. Operations