Title Impact of Foreign Entry in Banking Sector: Case of Thailandduring 1999 - 2014
Author(s) Lu, Wanxue; Mieno, Fumiharu
Citation Japan-ASEAN Transdisciplinary Studies Working Paper Series(TDWPS) = 日ASEAN超学際研究プロジェクトワーキング ペーパーシリーズ (TDWPS) (2018), 1: 1-33
Issue Date 2018-02
URL http://hdl.handle.net/2433/235924
Right
Type Research Paper
Textversion publisher
February 2018
1 Japan-ASEAN Transdisciplinary Studies Working Paper Series No.
Wanxue Lu
Fumiharu Mieno
Impact of Foreign Entry in Banking Sector:
Case of Thailand during 1999 ‒ 2014
1
Impact of Foreign Entry in Banking Sector:
Case of Thailand during 1999 - 2014
Wanxue Lu* and Fumiharu Mieno**
Abstract
The paper examines the effect of foreign capital entry on the cost and profit structure of commercial banking in Thailand with using a bank-level panel data in 1999 - 2014. We distinguish the dimensions of the market-level effect and the individual bank-level effect in foreign entry and find that an increase of bank-level foreign ownership results in increase of interest rate spread and improvement of loan quality, but at the same time, increase of operational expenses. On the other hand, the market-level foreign bank entry brings an increase of interest rate spread, non-interest income and reduce of operation expenses, realizing higher ROA as a result. Overall, foreign bank entry improves banking performance.
JEL Classification Codes: G21, O16, O53
Keywords: foreign entry, bank performance, financial regulation, Thailand
* Ph.D. Candidate, Graduate School of Asian and African Area Studies, Kyoto University, E-mail: luwanxue @asafas.kyoto-u.ac.jp
2 1. Introduction
ASEAN regional formation process has been accelerated in recent years. For the banking sector, ASEAN Banking Integration Framework (ABIF) is endorsed in 2014 under ASEAN Economic Community, aiming at realizing better access to regional market and flexible operation. As one aspect of regionalization, mutual concern on banking sector in ASEAN members has enlarged, and the entry into banking market in ASEAN countries from the world and Asian neighbors has increased in recent years. In Thailand, for example, the number of foreign banks counted for nine among the total nineteen commercial banks; seven are based in Asian neighbor countries, and four are new players entered in the past 4 years.
The paper aims to examine the effects of foreign capital entry in banking industry, focusing on the case of Thailand. The analysis are based on originally constructed micro database covering most of all commercial banks in 1999-2014. With the database we observes a long period of restructure and deregulation process in financial sector after Asian financial crisis (AFC) in 1997.
Thailand is one of the most typical cases that financial reform after AFC purport to modernize banking industry, to make competitive market, by inviting foreign capital to commercial banks. Before the late 1990s, the regulation on foreign bank entry was strict. Foreign bank was not allowed to get a full banking license, only to operate as a foreign branch. The indigenous ownership structure of commercial banking sector has been criticized as hotbed of weak corporate governance, inefficient connected lending, and corruption, which is regarded as one of the major cause of AFC.
Facing AFC in1997, many financial companies and commercial banks have experienced the process of bankruptcies, government control and foreign financial institutions’ acquisition. Encouraged by international financial institutions, the financial reforms with reorganization and deregulation of the sector was implemented to realize more transparent, competitive and self-disciplined financial system. Through the period of reform, Thai banking sector had gone through dramatic change of their ownership structure even in surviving banks. In most cases, the capital share by foreign investors and foreign banks increased drastically, the weight of traditional founder tycoon
3
families declined. Until the mid-2010s, two decades later since then, the scenery of Thai bank’s ownership have drastically changed; foreign capital entry has sharply increased in both forms of new banking institution and of investment to existing banks.
For such a drastic change of banking ownership in Asian countries such as Thailand, studies to investigate foreign entry effects in the region has been limited. And, most of a few studies focuses only on the early stage of the reforms before mid-2000s (Unite and Sullivan, 2003; Okuda and Rungsomboon, 2007).
The paper focuses on a longer period of 1999 - 2014, and aims to investigate the effect of banks’ ownership change and foreign entry on the performance and the efficiency, revisiting the arguments in relevant literatures that foreign entry may render more competitive market condition and overall improvement of banks performance in a long run. In the analysis we observe difference of the performance between domestic and foreign bank, market structure and scale effect.
The rest of the paper is organized as follows. Section 2 reviews the literatures related to foreign entry effect in banking market. Section 3 makes a descriptive observation on change of Thai banking sector since AFC. Section 4 discusses the methodology on the empirical study and the measures on foreign entry. Section 5 examine the result of estimation, and Section 6 conclude the paper.
2. Literature Review
Various existing studies on the impact of foreign bank entry on domestic banking market can be classified by three dimensions: (1) whether the observation case is cross-country level or a sing-cross-country; (2) whether the observation term is short or long; and (3) whether research question focus on the restriction of foreign bank entry or the evolution of foreign ownership.
Cross-country studies uses a panel data of financial statements of banks, represented by Claessens et al. (2001). Majority of single country studies discusses European and Latin American countries case such as Bhattacharaya (1993 & 1997), Clarke et al. (1999), Barajas et al. (2000). As the studies on Asian countries, major studies are Unite et al. (2003), Chantapong (2005), Okuda et al. (2007).
4
Claessens et al. (2001) came up with a most comprehensive model to investigate effect of foreign bank entry from overall banking performance across country in rather long-term (1988 to 1995). Based on a large sample of 7900 banks in 80 countries from, they found that foreign bank penetration may throw an effect on promoting the domestic banks to operate more efficiency and heightening the competition in a long term. It’s supported by the empirical results that foreign bank entry is associated with a reduction in the profitability, business diversification and operational cost. They assert that overall, foreign bank entry may improve the functioning of national banking market in a long run. Generally, weakness of cross country is that they neglect the factor of discrepancies on the economic environment and regulatory system.
In single country studies side, Clarke et al. (1999) analyze the effect of foreign entry on the domestic banking sector of Argentina. Through examining an intense period of foreign entry from 1995 to 1997, they find that domestic banks throughout that period experienced declining net margins and increasing operational cost. They also point out that local banks still keep their advantages for a shot run despite of direct foreign competition, excluding in the areas of manufacturing firms and mortgage lending that foreign banks concentrated in. Unite and Sullivan (2003) discusses the effects of domestic Philippine banks to the relaxation of foreign entry regulations that occurred in the Philippines for a period from 1990 to 1998. They adopt two type of foreign entry indices: (1) the foreign bank entry ratio of numbers of foreign banks in the market; (2) the change of foreign ownership as the measurement of foreign presence. By investigating the banking performance through three different models with a reference of the ownership structure of banks, they argued that foreign bank entry is inversely related to interest rate spreads and profits in a short run, but only in cases when those banks are affiliated to a domestic family business group. Non-lending activities decreased along with the higher foreign participation as well as the operation cost increase. They point out greater foreign monitoring may force domestic banks to focus on traditional banking business and input more on intermediation cost, labor cost and equipment cost. Generally, foreign entry corresponds with improvements on operating efficiencies but a deterioration of risk control.
5
Chantapong (2005) and Okuda and Rungsomboon (2007) study on Thai banking market. By pooling cross-bank time series data with the major balance sheet and income statement ratios, Chantapong (2005) proved that all banks were found to have reduced their credit exposure during the crisis years, and to have gradually improved their profitability during the post-crisis years in Thailand from 1995 to 2000. Okuda and Rungsomboon (2007) investigate the impact of foreign ownership change on Thai domestic banks by using panel data on 17 domestic commercial banks from 1990 to 2002. They also investigate the effect of financial regulation and market concentration. They find that an increase in foreign bank presence leads to a rise in larger operational cost and smaller interest spreads, resulting a decline in profits of domestic banks.
The limitation of the above studies exists mainly in their too short observation period compared with the long and complicated process Thailand experienced. Before AFC, foreign investment in Thai domestic banking is rare for a long time. The first foreign bank in Thailand appeared in 1998 (after AFC), and the door of full-blown foreign entry became open since then. Okuda and Rungsomboon (2007) argues based on the data until 2002 that increased competition from foreign banks negatively affects domestic banks. The blown field and green field entry however, accelerated since the mid-2000s in Thailand. Considering the observations in Claessens et al. (2001) and other studies that the change of domestic bank performance by foreign entry occurs in a long term, there is a room for further research on what the foreign entry brought to Thai banking sector with information of longer span.
On the theoretical side, a few studies discuss the mechanism that foreign entry brings the change of local banking sector and market. Levine (1996) provides a detailed theoretical illustration on the merit and demerit of foreign bank entry. It will enhance linkage from home country to international financial market and introduce more foreign investment. The entry strengthens market competition and enable local banks advanced management skills and technology. And Levine (1996) also assert that the entry expands international transactions to stimulate the improvement of financial supervisory and regulatory system.
6
found in various aspects. Foreign banks may dominate local market due to its skills and capital strength. It may incur capital flight through stronger linkage to international market. Banking service may come to concentrate on multinational enterprises and wealthy class. And even, the presence of powerful foreign banks may throw a threat to the healthy and stabile local financial market on account of weak supervisory and regulatory system in host country.
3. The Thai Banking Sector and Foreign Entry
3.1 Financial Reforms and Regulatory Policy since 2000s
In Thailand, the overheating economy with capital flow deregulation, asset bubbles, and fixed exchange rate system since the late 1980s, resulted in a shortage of foreign reserve and following destructive financial crisis in 1997. One-third of commercial banks were nationalized under the rescue scheme, while another one-third were bankrupted or acquired as foreign banking capital.
Facing this crisis, the government tried to coordinate the disposal of non-performance loans and the reconstruction of banking sectors. On the advice of international development institutions such as the World Bank or IMF, the government introduced rigid and transparent banking regulation, and at the same time, attracted the necessary capital to commercial banks outside the business families' groups, even drawing on foreign capital by loosening the foreign ownership regulations.
Through the reconstruction process, both banking institutions and non-performing loans were restored in around 2003-4. In 2004, under the Thaksin government, the financial authorities released a “Financial Master Plan,” directing Thailand toward “a developed competitive, efficient, stable and balanced financial system” by: (1) restricting financial conglomerates, (2) encouraging foreign bank entry (converting branches into full-banks incorporated in Thailand), and (3) creating the “retail bank,” targeting small-sized lending. This scheme was restrictive for domestic business group capital, and encouraged new entry for market competition. In 2010, a new “Financial Master Plan II” was released by the financial authority, emphasizing further strengthening of foreign bank entry and financial infrastructure. The new wave
7
of foreign bank entry started in recent years; four new foreign banks have now been licensed, and two “retail banks” were upgraded to commercial banks (for details, please see Appendix 1).
Although these master plans introduce visions of encouraging foreign bank entry, and promoting banking operation efficiency and market competition, the commercial bank license is not yet fully open to foreign capital and banks, requiring rather strict legal fulfillments to be approved. Financial Business Act B.E. 2551 (2008) requires foreign investors to get permission from the Bank of Thailand, (in case to hold more than a 25% stake in a domestic bank) or from the Ministry of Finance (in case the ratio coming to over 49%). The case of new entries from Japan, Australia and China in 2013
was brought by a new government notification1 under the Financial Business Act.
3.2 Evolution of Foreign Ownership in the Banking Sector
Appendix 1 pictures the process of reorganization of commercial banks that occurred between 1997 and 2015. It indicates that the 4-5 large-sized banks have been relatively stable, even during the period of crisis. Bangkok Bank, Kasikorn Bank (formerly Thai Farmers Bank), Siam Commercial Bank, and Ayutthaya Bank all sustained their operations. Krung Thai Bank also sustained their operations, and absorbed a few problematic banks for rescue purposes, in the role of state bank.
The damages were vast for the middle-sized banks2. Most of them were
bankrupted, and either nationalized or acquired by larger or newly entering foreign banks. Small-sized banks such as Nakornthon Bank or Bank of Asia were acquired by foreign banking capitals.
In the late 2000s, after the first “Financial Master Plan”, the entry of foreign banks strengthened; Standard Chartered Banks integrated its local branch and acquired former Nakornthon Bank; United Overseas Bank's (UOB, Singapore) total assets jumped as they absorbed multiple small local banks; CMBT (Malaysia) newly entered
1 Notification of Ministry of Finance Re: Rules, Procedures, and Conditions for the Establishment of New
Foreign Commercial Bank’s Subsidiary
2 First Bangkok City Bank, Bangkok Bank of Commerce, Thai Military Bank, The Union Bank of Bangkok,
8
the market by acquiring a local bank.
This new wave of entry has further strengthened in the 2010s; Bank of Tokyo Mitsubishi acquired Bank of Ayutthaya, the fifth largest local bank in 2013. One Japanese, one Australian/New Zealand, and two Chinese banks were newly licensed in 2015.
Table 1 shows the comparison of the list and market shares of each commercial banks between 1997 and 2013. The gray-colored highlighted banks in the portion 2013 indicate that they are pure subsidiaries of foreign banks. The total share in total asset counts as 15.4% of the total domestic sector in 2013, while no commercial bank were subsidiaries in domestic sector in 1997. When comparing the total commercial banking sector (domestic banks + foreign bank branches), the foreign bank share was 19.3% in 1997, while it increased to 26.9% (13.5%+13.4%) in 2013. It looks like a moderate increase, in spite of active foreign entry for the last 15 years. This also suggests that a substantial portion of foreign bank entry to domestic sector was conversions of the legal status from foreign branch to domestic bank.
Another aspect of foreign capital is, however, surprisingly remarkable. Appendix 2 shows the percentage of foreign capital in the total shareholdings of each bank. After the crisis, even large major banks have largely accepted foreign capital. For example, Bangkok Bank was more than 40% owned by foreigners in the 2000s, and in Siam Commercial Bank's case, the foreign share was more than 50% in the same period. These facts suggest that the forging of capital for entry is shaped into various forms, and the function of the banking sector should be examined from various angles.
Tracing the change of market competition condition from Table 1, we find a surprising fact that they have not drastically changed, and even the trend of market concentration seems to have occurred in this decade and a half from AFC. Table 1 tells us that the lineup of top five banks is almost unchanged, and their total assets occupy over 70% of the domestic banking sector. This share was 70.0% in 1997, but it increased to 74.5% by 2013. The market has become more oligopolistic through the process of foreign entry. It looks that the theoretical and policy logic that new foreign entry induces competition to the banking market have not work in the experience in Thailand.
9
3.3 Foreigner’s Presence and Market Concentration
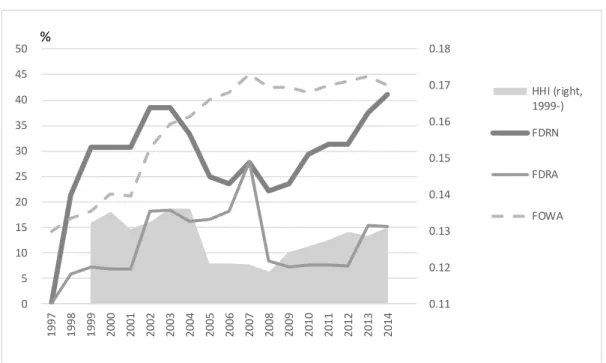
Figure 1 shows the trend of foreign presence in the market in average level and of market concentration in domestic commercial bank sector. We calculate three types of indices for the magnitude of foreign capital presence. First two are associated with presence of foreign subsidiary. FDRN and FDRA shows foreign subsidiary bank market shares in terms of numbers and aggregated total assets, respectively. The third indicator is associated with foreign ownership share of in domestic banks. FOWA indicates the annual weighted average of each bank’s foreign ownership (weighted by bank assets). The average Herfindahl–Hirschman Index (HHI) is shown as the indicator of market concentration.
The Thai banking sector is highly concentrated, and has been for a long while, with the assets of the top four banks (Big 4) accounting for an average of 65% of all commercial banks. The average HHI is 0.13 for the past 16 years. From Figure 1, we can see that there is a constant significant improvement in market concentration from 2002 to 2007, when the government carried out a series of financial reforms, including establishing several retail banks to amend the system of raising funds for small and medium enterprises under Financial Master Plan I.
Foreign penetration was encouraged during the restructuring process right after the 1997 financial crisis. In 1999, foreign ownership share (FOWA) was around 20%, and this was mainly coming from European and Singaporean financial institutions. Except for one state-owned bank, the other three of the top four banks brought in an average of around 30% foreign ownership during this time. The increase of foreign ownership has been accelerated since then, and FOWA reached its peak of 45% right before the global financial crisis in 2007-08. We find that the inflow of foreign capital was mainly directed towards the larger banks, rather than small and medium banks during this period, which resulted in greater concentration. Thus, we suppose that increasing foreign ownership may intensify market concentration and enrich major banks’ dominance over the financial market. Foreign ownership was maintained at a high level of over 40% even after the Global Financial Crisis (GFC) in 2008, until
10
recently.
Meanwhile, there are four small and medium sized banks that were acquired by foreign banks to mark a foreign entry boom from 1998 to 1999, and after that, in contrast there was not any market entry by foreign banks in the Thai banking sector until 2005. After the GFC in 2008, more and more foreign bank players from neighboring countries, especially Japan and China, entered the Thai market, instead of the major foreign bank players from western countries who had come before.
4. Methodology
4.1. Basic Formula for the Estimation
We uses bank-level panel data of domestic commercial banks in Thailand from 1999 to 2014, including local private banks, state-owned banks, joint-venture banks, and
foreign subsidiaries3, constituting an average of more than 95% of the total assets of
the whole commercial banking sector. The policy change for foreign entry cued by the restructure process from AFC, and large investment by foreign capital and banks appeared since 1999. We set 1999 as the start date.
We capture banking performance from the three aspects of profitability, revenue and cost. The observation are based on the following profit identical equation.
Π = REVENUE net interest income + non-interest income (Interest Rate Spread, IRS) (NII)
COST operational expense – loan loss reserve
(OE) (LLR)
(1)
3 According to the classification by the Financial Institution Business Act B.E.2551 in 2008, commercial banks in
Thailand are comprised of Thai commercial banks, Foreign Commercial Bank Branches, and Foreign Commercial Bank Subsidiaries. Further more, Thai commercial banks can be divided into local private banks, state-owned banks, and joint-venture banks (with more than 50% foreign ownership). Besides these, there are Retail Banks that have a narrow business scope focusing on small and medium enterprises due to a limitation of bank license. In this paper, our sample covers most Thai commercial banks and foreign commercial bank subsidiaries. Foreign Commercial Bank Branches and Retail Banks (because of their small size and limited business scope) and are outside of our consideration. If given without specific explanation, “all commercial banks” in this paper covers the same range of Thai commercial banks and Foreign Commercial Bank Subsidiaries.
-11
In the estimation, we normalize them by total asset, thus Π are expressed as Return on
Asset (ROA). The five variables, ROA, IRS, NII OE and LLR are used for dependent variables.
We will regress them on factors of foreign entry and market concentration as well as other control variables on bank-specific, market and macroeconomic factors. As for foreign entry, we hypnotize two types of impact pathway: market-level impact and individual bank-level effect. The estimation equations are expressed as follows,
!"#= %&+ ()*!+#+ (,-!+"#+ (.-"#+ (/*#+ 0"# (2)
Where !"# are above five dependent variables associated with bank’s profitability, revenue and cost. *!+# is the measure of foreign bank entry identified by years and common to all the banks in the market which illustrate market-level effects, -!+"# refers to the foreign factor identified by individual bank which represents individual bank-level effect, -"# is other bank-specific factors and *# is other market indicators, including macro economy variables:
The sample of Thai banks contains some natures suitable for the estimation by econometrics. During the sample period, the total number of commercial banks has been almost unchanged counting for 20 banks, The financial regulatory and supervision system are uniformed across whole country. These condition minimizes the problem of heterogeneity in the sample.
4.2. Market Impact vs. Individual Bank Effect
In most existing studies, these two perspective are discussed without clear distinction. In the analysis, we distinguish two impact pathways. Firstly, foreign entry into the banking industry includes market penetration by foreign individual and institutional investors. Among them, activity by a foreign bank generally has a high profile, owing to direct competition with local players, and draws more attention from financial supervisory and regulatory authorities. It may incur the market competition and enhancement of regulation which improve market function.
12
Secondly, foreign entry in forms of acquisition of indigenous banks or partial equity share may improve a bank’s monitoring activities and inhibit inside managers’ behavior, and find motivation for modernizing banking governance and operations. For such a hypothesis, there are counter arguments. Yeyati and Micco (2007) argue that banks controlled by foreign institutions in developing countries (typically neighboring countries) are generally subsidiaries of non-financial firms, and do not benefit from any greater financial sophistication.
4.3. Measurement of Foreign Entry
In a cross country analysis, Claessens et al. (2001) adopt the ratio of foreign bank numbers or assets to total commercial banks, based on the identification of ‘foreign bank’ by a certain criteria. That is, foreign bank entry is captured as the share of numbers of foreign banks to total bank numbers, or the ratio of assets of foreign banks to total bank assets. For the identification of foreign bank, Claessens et al. (2001) define is as a bank that has at least 50% foreign ownership. And many studies for single country analysis follow the same measures of foreign entry.
Identification problem is a key for our study. A few single country studies, adopt foreign ownership share as a measure foreign entry, instead of transcendental information (e.g. Okuda and Rungsomboon 2007). Most analyses with foreign ownership share indicator focus on a micro bank-level perspective.
In case of Thailand, however, the identification is not so simple. In the large bank layer, for example, while the foreign ownership of Siam Commercial Bank had exceeded 50% for merely 5 years during the whole sample period of 16 years, its first majority shareholder (Bureau of the Crown Property and Group) maintains incomparable influence on the banking governance. Likewise, foreign ownership of TMB Bank exceeded 50% for only one year (2007), by less than 3%. Among that foreign share, its top foreign shareholder owns a 25% stake, and the rest are scattered from various countries. These circumstances occurred in the process of restructuring banking sector from AFC, and under special approval from the authority.
13
sector. For the individual bank level, we prepare (1) FD, identification dummy with basically followed by majority of stock share, but with expectation in accordance with the reform process (such as in Siam Commercial Bank or TMB), and (2) FO, simple ownership percentage share. For the market level, we prepare (3) percentage of bank identified as foreign bank (FDRN) in number (FDRA) and total asset in all the bank, and (4) FOWA, weighted average of FOW for all the bank (weighted by total asset). The market level indices (3) and (4) are identical for same years.
Individual Bank (BFPit)
Market (MFPit)
Identification (1) FD (Dummy) (2) FDRN (%, ratio of FD counting)
FDRA (%, weighted ratio in T.A.)
Ownership Share (3) FOW (%) (4) FOWA(%,weighted ratio of FO)
The complete information of foreign presence variables are shown in Appendix 2.
4.4. Market Concentration and Other Explanatory Variables
Accompanying important issue of the study is relationship between foreign presence and market competition condition. We introduce HII as the indicator of market concentration for the market level variables, and bank’s relative size (measured total asset share) by RBS. We will examine indirect impact of foreign presence on market condition. Other macroeconomic control variables include Inflation, GDP Growth Rate and Interest Rate, Shareholders Equity Ratio and others. The definition are explained in Table 2.
4.5. Data
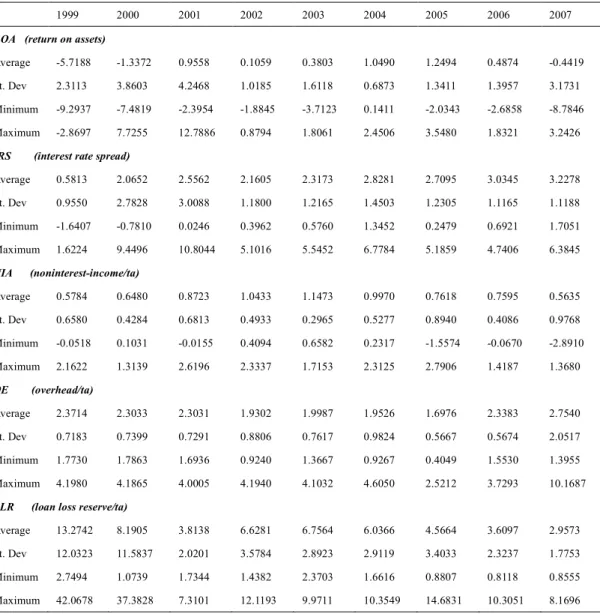
The data are collected from Bank of Thailand, World Bank, the Stock Exchange of Thailand, and Bank Scope. Table 3 presents statistics of ROA, interest rate spread (IRS), non-interest income (NII), operational expense (OE), and loan loss reserve (LLR) for the period of 1999 to 2014. ROA and operation expenses respectively decreased and
14
increased sharply during 2007 to 2008 due to the global financial crisis, while interest rate spread appears to constantly climb up until 2007, and has fluctuated after.
5. Empirical Results and Interpretation 5.1. Baseline Estimation
The estimation results are shown in four tables (Table 4 – 7). For the estimation, all regressions in this study are estimated by a random-effects model. As a fixed-effects model may remove any effect related to a time-invariant regressor, such as the foreign dummy variable we used, regressions in Tables 5, 6 and 7 should be estimated in the random-effects model. To be consistent and comparable with other regressions, regressions in Table 4 are also estimated in the random-effects model4.
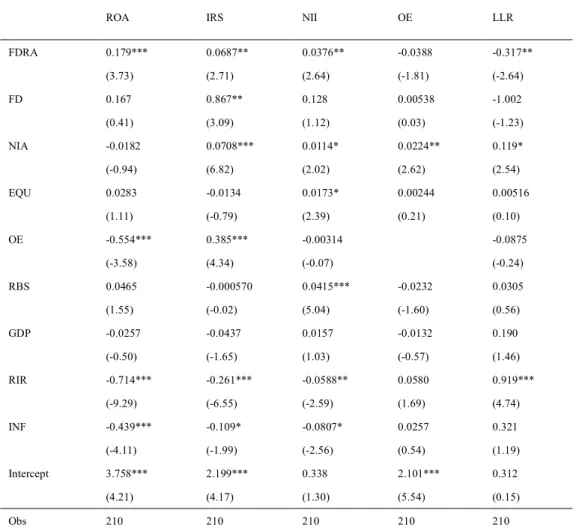
Table 4 and Table 5 present the baseline estimation results with five dependent variables and both the market-level and bank-level effect of foreign bank entry. Table 4 focuses mainly on market-level effect introducing FDRN and FDRA, then compares the bank-level effect by FOW. Table 5 compares banking performance between foreign and domestic banks by introducing alternative variable, the bank dummy (FD) associated with bank-level effect. In the Table 5, the estimation results with variable FDRN are omitted since they are almost same as ones with FDRA.
(1) Revenue 1 – Interest Income or Interest Spread IRS
We found that foreign bank presence in market-level and foreign ownership in bank-level is positively associated with the interest rate spread (IRS) of commercial banks. Interest rate spread will grow as the extent of foreign entry increases. It is frequently pointed (for instance, by Feldstein, 2000) that foreign bank presence is linked to higher interest income and better loan quality due to them being able to “cherry pick” the best credits, and leave the sub-prime clients for domestic banks. Thus, domestic banks have to lend more prudentially, as well as make efforts to fend off the shrinkage of loan portfolio, due to the competition from foreign banks. The interest income is likely to
4 We also examine regressions in Table 4 using a fixed-effects model, and find that the results are robust to
15
decline, and the interest expenses are likely to increase, owing to the increasing pressure on absorbing deposits, which leads to a decrease of interest rate spread.
However, the results show a completely different nature from expected. The result suggest a possibility that foreign bank entry may lead to a less competitive banking market that results in an increasing interest income. On the other hand, domestic banks still retains advantage on absorbing deposits. These nature is consistent to the view by Yeyati and Micco (2007) that increased concentration does not deteriorate market competition, and foreign bank entry may lead to a less competitive industrial organization by increasing the degree of product differentiation out of their differences in products, value of the brand name, and implicit insurance from a parent company.
The estimation results show that an increase of bank-level foreign ownership brings an increase of interest rate spread. It might be either due to an increasing interest income or reducing interest expenses, or both. As aforementioned, it’s perceived that inflow of foreign capital is mainly directed towards large-sized banks, rather than small and medium banks in the Thai banking sector, which may aggravate market concentration and enrich large-sized domestic banks greater dominance over absorbing deposits to result in a reduction of interest expenses.
Another possibility of the results about bank-level effect is that greater foreign ownership is considered to be linked to a good credit reputation, that likely leads to a lower interest cost of deposits collection. Relative bank size (RBS) is also found to be positively related to interest rate spread, pointing out that those large banks may have a relatively higher interest rate spread, contradict to that of Unite and Sullivan (2003). The observation is consistent to Chantapong (2005) that foreign banks do have a higher interest rate spread than domestic banks.
(2) Revenue 2 – Non Interest Income (NII)
As for the business diversification, we find positive relationship between non-interest income and market-level foreign entry. Table 4 shows that the greater the increase of foreign bank presence in the market (FDRN or FDRA), the greater the non-interest
16
income to total assets ratio. This is consistent with the speculation that higher foreign bank presence generally enables local banks to explore better product innovation, more advanced skills and investment banking business technology, and greater experiences in brokerage and consultation services (Levine, 1996). Local banks may have to seek business opportunities and profit in non-banking areas, to compensate for losses in the traditional banking business, in view of competition for lending activities with foreign banks.
On the other hand, bank-level effect of foreign ownership (FOW, and FD) shows insignificant in Table 4 and Table 5. In Table 4, foreign ownership (FOW) seems to be insignificantly related to non-interest income. The case of Thailand provides little evidence for the arguments that greater foreign monitoring may reduce local banks’ dependence on non-traditional banking business, as was proved in the Philippine banking sector, or that greater foreign ownership may bring about technological transformation in non-banking areas.
It is also found that bank size (RBS) is significantly associated with non-interest income in positive way, which implies that large-sized banks have more advantages in taking part in non-traditional banking business.
New foreign entry with gaining control (FD) do not resulted in a higher non-interest income (Table 5). The hypothesis that foreign banks’ advanced experience and skills in non-banking business brings productivity progress is not supported by the estimation result. This is probably because those foreign banks largely controlled by prominent foreign banks are prone to paying more attention to traditional lending activities to follow customers from a home country, or owing to a higher profitability on interest income.
(3) Operating Expense (OE)
Table 4 also presents an negative relationship between foreign bank entry in market level and operation expenses, consistent to the prediction by Moreno et al. (2005). Different from general conjecture that foreign bank entry may lead to a less competitive market, domestic banks are still supposed to adopt best practices that contribute to
17
better operation efficiency on the grounds of foreign bank’s expertise in the same area. We found in Table 4 the positive relationship between foreign ownership in bank-level and operational cost. It verifies an argument that increasing foreign ownership in a bank seems to result in increasing personnel expenses and equipment costs, to modernize banking operations to get ready for challenge and chance, also raising other non-lending operation costs due to expanded non-lending activities such as innovations in internet banking and financial products. It also provides evidence that greater foreign ownership may incur more cost on greater inside monitoring.
Operation expenses are found to be positively related to the non-interest earning assets ratio (NIA). It’s surmised that an increase in non-interest earning assets is linked to increased non-interest expenses over expanded non-lending activities.
On the other hand, the increase of operational cost is not find in the case of the new entry gaining control by foreign banks (FD) in Table 5. Since Table 5 also shows that FD dummy does not give any impact on non-interest income, it suggests that management reform forward new business with higher personnel cost or equipment cost, observed in partial ownership participation case, was less active in full acquisition type entry.
(4) Loan Loss
We find that the increase of foreign bank entry will lead to a reduction of bank risk at a low significance, and will only be significant when estimated by the measure of foreign bank assets ratio (FDRA%). Foreign ownership in bank-level (FOW) is also found to be negatively related to bank risk, which supports the argument that greater foreign ownership will spur better monitoring, and provisioning to impel more prudential and conservative lending behavior, to reduce bank risk in return. Quality of loans is also found to be improved, along with an increase of real interest rate in the Thai banking sector.
(5) Profit (ROA)
18
market level, which is robust in two models of Table 4 and 5. This is quite opposite of the findings by Claessens et al. (2001) that an increased foreign presence of foreign banks is associated with a reduction in profitability. Combined with the results on revenue and cost, we can interpret that as a mixed result of increasing interest rate spread and non-interest income, and decreasing operation costs due5.
On the other hand, change of foreign ownership (FOW) seem to have no significant effect on ROA, which is the same results as Unite and Sullivan (2003) in Philippine’s case. The impact of bank-level foreign entry was significantly positive to interest rate spread, and negative to operational cost. The result on ROA implies that two impacts cancel out each other. The impact of ROA in the case of FD also shows insignificant.
To sum, our findings indicate that the market-level foreign presence induce to increase of interest margin, to widen the income source in non-lending service, and to decrease the operational cost, resulting to realize profit rate surge. Meanwhile, bank-level foreign presence induce increase of interest margin, but at the same time, incurs the rise of operational cost. As a result the impact to profit rate is neutral.
5.2. Foreign Presence and Market Condition
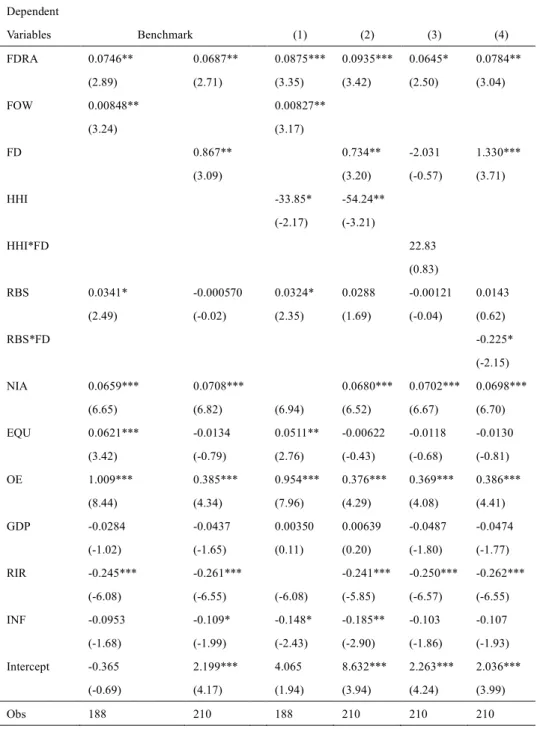
Now we focus on the relationship between income/cost structure and market competition condition. Table 6 and Table 7 observe the effect of foreign presence both in market- and bank-level, and market concentration situation on income side (Interest Rate Spread, Table 6) and cost side (Operational Expense, Table 7). We prepare Herfindahl–Hirschman Index (HHI) to represent market level concentration, and Relative Bank Size (RBS) to represent market controlling power of each bank.
The results of Table 6 shows a significant negative relationship between the HHI Index and interest rate spread. It means that in the years when market concentration is high, banks realize lower interest rate spread, and it is contracted to our usual
5 As a matter of fact, the net margin of the banking sector has ranked in the top three among all industries in
Thailand for a lengthy period, which also raises doubts about the market competition condition of the banking sector.
19
knowledges. Relative Bank Size (RBS) show positive relationship in a few cases meaning that larger bank enjoy higher spread.
By introducing interact term with Foreign Dummy (FD), we distinguish these effects to foreign banks from others. The coefficients of interact term of HHI*FD show insignificant, and in the estimation (3) in Table 6 the coefficient of FD becomes insignificant. Different from the case of domestic banks, the market concentration is neutral for the interest spread of foreign banks.
In some estimation cases, RBS shows positive relationship with interest rate spread meaning that the larger banks enjoy the larger interest income. But in the estimation (5) in Table 6, the coefficient of intersect term of RBS*FD shows strongly negative, which means that for foreign and the larger banks face lower interest income. The results of Table 7 shows negative correlation between Herfindahl– Hirschman Index and operational cost. There seems no correlation between bank size (RBS) and operational cost. We find that the interaction term between the HHI and foreign dummy has a positive relationship with operational expenses, this means that problem of X- inefficiency is remarkable only in the foreign banks.
6. Conclusions
In this study, through distinguishing mechanisms of action from market-level foreign bank entry and bank-level foreign ownership, we examine the effects of foreign entry on cost and profit structure of commercial banks, in case of Thailand for relatively longer period of 1999 - 2014.
Overall, foreign bank presence in market-level improves profitability of the domestic banking sector in the case of Thailand during 1999 - 2014. Foreign bank entry and accompanying strengthened competition condition brings banking sector a circumstances to find better product innovation, more advanced skills, and technology for non-banking business. It also helps to improve banks' operation efficiency.
On the other hand, the foreign bank entry in bank-level in forms of acquisition or partial shareholding, does not show clear improvement of the profitability. Foreign banks only enjoy larger interest spread, but no evidence for improving cost efficiency
20
or diversifying their business was found.
The relationship between foreign presence and market competition is unclear. Also the strengthening market concentration are consequence of concentrated foreign capital participation to larger banks, which may lead it to a positive relationship with interest rate spread of such powerful banks. These findings cast the questions on the financial sector policies implemented since 2000s in Thailand. This appears to be a significant topic for further research.
Acknowledgements
A previous version was presented as part of the 15th International Convention of the
East Asian Economic Association. The authors would like to thank Prof. Dr. Sukanda Lewis, the Institution of Asian Study, Faculty of Economics, Chulalongkorn
University, for her valuable comments. The authors are also grateful to Ms. Saithip Konggiatnarong, Senior Researcher, Kasikorn Research Center.
21 References
Barajas, A., R. Steiner, & N. Salazar, 2000. The impact of liberalization and foreign
investment in Colombia’s financial sector. Journal of Development Economics 63,
157-196.
Berger, A., 1995. The relationship between capital and earnings in banking. Journal of
Money Credit and Banking 27, 432–456.
Bhattacharaya, J., 1993. The role of foreign banks in developing countries: A survey of evidence. Unpublished manuscript, Cornell University.
Bhattacharaya, A., C.A.K. Lovell, & P. Sahay, 1997. The impact of liberalization on
the productive efficiency of Indian commercial banks. European Journal of
Operational Research 98, 332-345.
Chantapong, S., 2001. What Happened to the Banking Sector in the Aftermath of
Financial Crisis: the Case of Thailand. Kiel Institute of World Economics, Working
Paper.
Chantapong, S., 2005. Comparative study of domestic and foreign bank performance
in Thailand: The regression analysis. Economic Change and Restructuring, 38(1),
63-83.
Claessens, S., & Jansen, M., 2000. The Internationalization of Financial Services: issues and lessons for developing countries.
Claessens, S., Demirgüç-Kunt, A., & Huizinga, H., 2001. How does foreign entry affect domestic banking markets? Journal of Banking & Finance, 25(5), 891-911.
Clarke, G., Cull, R., D Amato, L., Molinari, A., 1999. The effect of foreign entry on
Argentina’s domestic banking sector. World Bank Policy Research Working Paper,
2158
Clarke, G., R. Cull, M. S. M. Peria, and S.M. Sanchez, 2001. Foreign bank entry: Experience, implications for developing countries, and agenda for further research. IMF Working Paper.
Demirgüç-Kunt, A., & Huizinga, H., 1999. Determinants of commercial bank interest
margins and profitability: some international evidence. The World Bank Economic
Review, 13(2), 379-408.
Denizer, C., 1999. Foreign entry in Turkey's banking sector, 1980-97. World Bank Policy Research Working Paper, (2462).
Feldstein, M., 2000. Discussion Summary Version of May 17, 2001. Financial Policies, Economic and Financial Crises in Emerging Markets Economies. NBER Conference, Woodstock, Vermont, October 19–21, 2000.
Feldstein, M., 2002. Economic and Financial Crises in Emerging Markets Economies: Overview of Prevention and Management. NBER Working Paper No. 8837
Gormley, T. A., 2010. The impact of foreign bank entry in emerging markets: Evidence from India. Journal of Financial Intermediation, 19(1), 26-51.
La Porta, R., Lopez-de-Silanes, F., Shleifer, A., & Vishny, R. W., 2001. Law and
Finance. Corporate governance, pp. 26-68, Springer Berlin Heidelberg.
Levine, Ross, 1996. Foreign banks, financial development, and economic growth, in Claude E. Barfield, ed. International Financial Markets, Washington, D.C., AEI Press.
22
Li, J., 2000. The benefits and costs of relation-based governance: An explanation of the East Asian miracle and crisis, Working paper, City University of Hong Kong. McFadden, Catherine, 1994. Foreign banks in Australia. The World Bank, mimeo. Moreno, R., & Villar, A., 2005. The increased role of foreign bank entry in emerging
markets. Globalisation and Monetary Policy in Emerging Markets, 23, 9-16.
Okuda, H., & Rungsomboon, S., 2007. The effects of foreign bank entry on the Thai banking market: Empirical analysis from 1990 to 2002. Review of Pacific Basin Financial Markets and Policies, 10(01), 101-126.
Shaffer, S., 1998. The winners curse in banking. Journal of Financial Intermediation 7, 359–392.
Shleifer, A., Vishny, R., 1997. A survey of corporate governance. Journal of Finance
52, 737–783.
Terrell, H. S., 1984. The role of foreign banks in domestic banking markets. Federal
Reserve Bank of San Francisco Proceedings, No. Dec, pp. 297-304.
Unite, A. A., & Sullivan, M. J., 2003. The effect of foreign entry and ownership structure on the Philippine domestic banking market. Journal of Banking & Finance,
27(12), 2323-2345.
Yeyati, E. L., & Micco, A., 2007. Concentration and foreign penetration in Latin
American banking sectors: Impact on competition and risk. Journal of Banking &
23
Figure 1. Trend of Foreign Entry and Market Concentration
Source: Bank of Thailand, Stock Exchange of Thailand.
Note: FDRN is the ratio of foreign bank numbers to total commercial banks numbers. FDRA is the ratio of foreign bank assets to total commercial banks assets. FOWA is the weighted annual average of every commercial bank’s foreign ownership, weighted by bank assets. HHI is the Herfindahl–Hirschman Index calculated by the authors, marked by the secondary axis.
0.11 0.12 0.13 0.14 0.15 0.16 0.17 0.18 0 5 10 15 20 25 30 35 40 45 50 1997 1998 1999 2000 2001 2002 2003 2004 2005 2006 2007 2008 2009 2010 2011 2012 2013 2014 HHI (right, 1999-) FDRN FDRA FOWA %
24
Table 1. Market Share of Commercial Banks and Foreign Ownership
Source: Bank of Thailand, Commercial Banks in Thailand (1997-2014)
1997
(1) Banks Incorprated in Thailand Domestic Bank)
/(1) /(1)+(2)
1 Bangkok Bank 1,408,619 23.4% 18.9% 114 12.3%
2 Thai Farmers Bank 795,385 13.2% 10.7% 117 12.6%
3 Krung Thai Bank 792,664 13.2% 10.7% 88 9.5%
4 The Siam Commercial Bank 717,240 11.9% 9.6% 106 11.4%
5 Bank of Ayudhya 493,890 8.2% 6.6% 106 11.4%
6 The Thai Military Bank 389,476 6.5% 5.2% 73 7.9%
7 First Bangkok City Bank 316,145 5.3% 4.2% 30 3.2%
8 Siam City Bank 272,124 4.5% 3.7% 43 4.6%
9 Bangkok Metropolitan Bank 190,560 3.2% 2.6% 55 5.9%
10 Bank of Asia 156,644 2.6% 2.1% 36 3.9%
11 The Bangkok Bank of Commerce 145,971 2.4% 2.0% 27 2.9%
12 The Thai Danu Bank 130,266 2.2% 1.8% 36 3.9%
13 Nakornthon Bank 73,799 1.2% 1.0% 36 3.9%
14 The Union Bank of Bangkok 73,284 1.2% 1.0% 39 4.2%
15 The Laem Thong Bank 51,942 0.9% 0.7% 20 2.2%
sum of top 5 4,207,798 70.0% 56.5% 531 57.3%
sum of top 10 5,532,747 92.1% 74.3% 768 82.9%
Corprated in Thailand, Total (1) 6,008,009 80.7% 926
Forigen Bank Branch, Total (2) 1,433,654 19.3% 20
(1)+(2) total 7,441,663 946
2013
(1) Banks Incorprated in Thailand Domestic Bank
/(1) /(1)+(2)
1 Bangkok Bank 2,502,750 17.7% 15.5% 284 13.4%
2 Krung Thai Bank 2,502,231 17.7% 15.5% 287 13.5%
3 The Siam Commercial Bank 2,383,608 16.8% 14.7% 356 16.8%
4 KasikornBank 2,092,060 14.8% 12.9% 291 13.7%
5 Bank of Ayudhya 1,073,419 7.6% 6.6% 190 9.0%
6 Thanachart Bank 990,724 7.0% 6.1% 245 11.6%
7 TMB Bank 765,345 5.4% 4.7% 172 8.1%
8 United Overseas Bank 408,027 2.9% 2.5% 85 4.0%
9 TISCO Bank 342,030 2.4% 2.1% 21 1.0%
10 CIMB Thai Bank 278,362 2.0% 1.7% 79 3.7%
11 Standerd Chartered Bank (Thai) 254,833 1.8% 1.6% 21 1.0%
12 Kiatanakin Bank 234,295 1.7% 1.4% 26 1.2%
13 Land and Houses Bank 148,719 1.0% 0.9% 44 2.1%
14Industrial and Commercial Bank of China 148,128 1.0% 0.9% 9 0.4%
15 Thai Credit Retail Bank 25,912 0.2% 0.2% 11 0.5%
16Mega International Commercial Bank 17,549 0.1% 0.1% 2 0.1%
Sum of top 5 10,554,068 74.5% 65.2% 1,408 66.4%
Sum of top 10 13,338,556 94.1% 82.4% 2,010 94.8%
Corprated in Thailand, Total (1) 14,167,992 87.6% 2,121 Forigen-owned Bank Total (3) 2,180,318 15.4% 13.5% 1,839 86.7% Forigen Bank Branch, Total (2) 2,014,286 100.0% 12.4% 14
(1)+(2) total 16,182,278
Forigen bank ground total (2)+(3) 4,194,604 25.9% 1,853 Note: Bank No.5, 8.10.11.14 and 16 are subsidiary of foreign capital
Total Assets MB No. of Officies
25
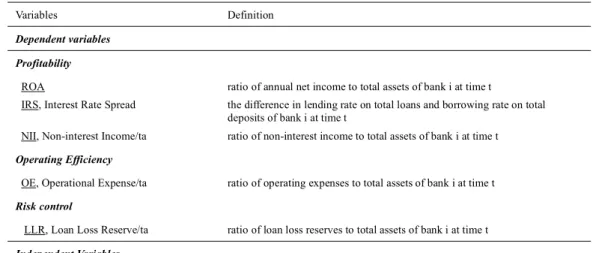
Table 2. Definition of Dependent Variables and Independent Variables
Variables Definition
Dependent variables Profitability
ROA ratio of annual net income to total assets of bank i at time t
IRS, Interest Rate Spread the difference in lending rate on total loans and borrowing rate on total deposits of bank i at time t
NII, Non-interest Income/ta ratio of non-interest income to total assets of bank i at time t
Operating Efficiency
OE, Operational Expense/ta ratio of operating expenses to total assets of bank i at time t
Risk control
LLR, Loan Loss Reserve/ta ratio of loan loss reserves to total assets of bank i at time t
Independent Variables . Foreign Presence Proxies
Market-level Foreign Penetration (MFP)
FDRN, Ratio of Foreign Bank Numbers ratio of foreign bank numbers to total bank numbers at time t FDRA, Ratio of Foreign Bank Assets ratio of foreign bank assets to total bank assets at time t
FOWA, Foreign Ownership Annual Average
weighted annual average ratio of every commercial bank’s foreign ownership weighted by bank assets at time t
Bank-level Foreign Penetration (BFP)
FOW, Ratio of Foreign Ownership ratio of foreign ownership of bank i at time t
FD, Dummy of Foreign Bank a dummy variable equals to 1 if a bank’s foreign ownership is more than 50% and it’s controlled by institutions with headquarters abroad.
. Bank Specific Factors
NIA, Non-interest Earning Assets/ta ratio of non-interest earning assets (cash, non-interest earning deposits at other banks, and other non-interest earning assets) to total assets of bank i at time t EQU, Equity/ta ratio of shareholders equity to total assets of bank i at time t
OE, Operational Expense/ta ratio of operating expenses to total assets of bank i at time t
RBS, Relative Bank Size ratio of one bank assets to all commercial banks assets of bank i at time t
. Market Indicators
HHI, Herfindahl–Hirschman Index a measure of internal market structure of market concentration, a higher index refers to a highly monopolistic market at time t
GDP, Real GDP Growth Rate real GDP growth rate on an annual basis and adjusted for inflation at time t RIR, Real Interest Rate the nominal interest rate after allowing for inflation at time t
26
Table 3. Descriptive Statistics on Dependent Variables of Banking Performance of 1999-2014
1999 2000 2001 2002 2003 2004 2005 2006 2007
ROA (return on assets)
Average -5.7188 -1.3372 0.9558 0.1059 0.3803 1.0490 1.2494 0.4874 -0.4419 St. Dev 2.3113 3.8603 4.2468 1.0185 1.6118 0.6873 1.3411 1.3957 3.1731 Minimum -9.2937 -7.4819 -2.3954 -1.8845 -3.7123 0.1411 -2.0343 -2.6858 -8.7846 Maximum -2.8697 7.7255 12.7886 0.8794 1.8061 2.4506 3.5480 1.8321 3.2426
IRS (interest rate spread)
Average 0.5813 2.0652 2.5562 2.1605 2.3173 2.8281 2.7095 3.0345 3.2278 St. Dev 0.9550 2.7828 3.0088 1.1800 1.2165 1.4503 1.2305 1.1165 1.1188 Minimum -1.6407 -0.7810 0.0246 0.3962 0.5760 1.3452 0.2479 0.6921 1.7051 Maximum 1.6224 9.4496 10.8044 5.1016 5.5452 6.7784 5.1859 4.7406 6.3845 NIA (noninterest-income/ta) Average 0.5784 0.6480 0.8723 1.0433 1.1473 0.9970 0.7618 0.7595 0.5635 St. Dev 0.6580 0.4284 0.6813 0.4933 0.2965 0.5277 0.8940 0.4086 0.9768 Minimum -0.0518 0.1031 -0.0155 0.4094 0.6582 0.2317 -1.5574 -0.0670 -2.8910 Maximum 2.1622 1.3139 2.6196 2.3337 1.7153 2.3125 2.7906 1.4187 1.3680 OE (overhead/ta) Average 2.3714 2.3033 2.3031 1.9302 1.9987 1.9526 1.6976 2.3383 2.7540 St. Dev 0.7183 0.7399 0.7291 0.8806 0.7617 0.9824 0.5667 0.5674 2.0517 Minimum 1.7730 1.7863 1.6936 0.9240 1.3667 0.9267 0.4049 1.5530 1.3955 Maximum 4.1980 4.1865 4.0005 4.1940 4.1032 4.6050 2.5212 3.7293 10.1687
LLR (loan loss reserve/ta)
Average 13.2742 8.1905 3.8138 6.6281 6.7564 6.0366 4.5664 3.6097 2.9573 St. Dev 12.0323 11.5837 2.0201 3.5784 2.8923 2.9119 3.4033 2.3237 1.7753 Minimum 2.7494 1.0739 1.7344 1.4382 2.3703 1.6616 0.8807 0.8118 0.8555 Maximum 42.0678 37.3828 7.3101 12.1193 9.9711 10.3549 14.6831 10.3051 8.1696
27
Table 3. Descriptive Statistics on Dependent Variables of Banking Performance of 1999-2014 (continued)
2008 2009 2010 2011 2012 2013 2014
16-year average
ROA (return on assets)
Average 0.6359 0.6986 0.9892 0.9302 0.9442 1.1479 1.3414 0.6091 St. Dev 1.1514 0.5804 0.4890 0.5702 0.6868 0.6127 0.5203 1.4630 Minimum -2.4413 -0.9171 0.3112 0.0790 -0.5616 0.0598 0.3445 -2.1309 Maximum 2.5699 1.5324 2.3842 2.3842 2.3842 2.3842 1.9901 3.3268
IRS (interest rate spread)
Average 3.1589 3.1501 2.9955 2.7827 2.6548 2.7810 3.0586 2.7654 St. Dev 0.9755 0.5743 0.8288 0.8599 0.8805 0.9764 0.7545 1.2636 Minimum 1.6420 2.3949 1.9143 1.6309 1.5201 1.4508 2.1906 1.1300 Maximum 5.9422 4.2409 5.3818 5.3818 5.3818 5.3818 4.5075 6.0139 NIA (noninterest-income/ta) Average 0.6386 0.8737 0.8790 0.9807 0.9763 1.0636 1.1144 0.8879 St. Dev 0.5320 0.3877 0.4247 0.4629 0.4863 0.5263 0.4883 0.5343 Minimum -0.6610 0.2684 0.1320 0.2139 0.1856 0.2840 0.6334 -0.1382 Maximum 1.4102 1.5494 1.6908 1.6908 1.6920 2.1265 2.1008 1.8755 OE (overhead/ta) Average 2.1528 2.2364 2.0559 1.9421 1.9328 1.8297 1.9994 2.0951 St. Dev 0.6617 0.6380 0.5638 0.5638 0.6123 0.6380 0.4446 0.7601 Minimum 1.3076 1.2957 1.1669 1.0730 0.9262 0.7440 1.4890 1.2035 Maximum 4.2081 3.7062 3.2052 3.2052 3.2052 3.2052 2.7467 4.0660
LLR (loan loss reserve/ta)
Average 2.4955 2.5726 2.2459 2.2347 2.1856 2.4385 2.6948 3.9618 St. Dev 1.8251 1.4728 1.1542 1.0328 0.9101 0.9001 0.7293 2.5675 Minimum 0.3466 0.5285 0.7431 0.8034 0.7613 0.9639 1.8035 1.1184 Maximum 8.3759 6.6281 4.3008 4.3008 4.3008 4.3008 3.7082 9.7474
28
Table4. The regression results of commercial banks for the period of 1999-2014
Dependent
Variables ROA IRS NII OE LLR
FDRN 0.188*** 0.0746** 0.0338* -0.0448** -0.301* (3.61) (2.89) (2.27) (-2.93) (-2.23) FDRA 0.0849*** 0.00613 0.0220*** -0.0253*** -0.0656 (3.80) (0.54) (3.51) (-4.03) (-1.11) FOW -0.00279 -0.00204 0.00848** 0.00981*** 0.00159 0.00155 0.00580** 0.00535** -0.0258* -0.0292* (-0.57) (-0.42) (3.24) (3.73) (0.96) (0.97) (3.13) (2.99) (-2.13) (-2.41) NIA -0.0231 -0.0275 0.0659*** 0.0628*** 0.0122* 0.0117* 0.0170** 0.0168** 0.0849 0.0945 (-1.17) (-1.41) (6.65) (6.20) (2.11) (2.08) (2.83) (2.87) (1.67) (1.85) EQU 0.105** 0.121*** 0.0621*** 0.0663*** 0.0383*** 0.0429*** -0.0145 -0.0193 0.0730 0.0582 (3.02) (3.49) (3.42) (3.57) (3.43) (3.90) (-1.16) (-1.59) (0.84) (0.66) OE 0.0883 0.163 1.009*** 0.963*** 0.00292 0.0380 0.832 0.920 (0.37) (0.68) (8.44) (7.70) (0.04) (0.54) (1.37) (1.47) RBS 0.0476* 0.0492* 0.0341* 0.0357** 0.0387*** 0.0396*** -0.0175 -0.0183 0.0213 0.0195 (2.01) (2.08) (2.49) (2.58) (3.98) (4.08) (-1.29) (-1.35) (0.38) (0.34) GDP -0.0150 -0.0898 -0.0284 -0.0582* 0.0186 0.00543 -0.0197 -0.00230 0.199 0.321* (-0.27) (-1.73) (-1.02) (-2.20) (1.17) (0.38) (-1.20) (-0.15) (1.36) (2.35) RIR -0.739*** -0.745*** -0.245*** -0.215*** -0.0549* -0.0632** 0.0520* 0.0571* 0.840*** 0.769*** (-9.13) (-9.22) (-6.08) (-5.20) (-2.36) (-2.78) (2.16) (2.44) (3.99) (3.61) INF -0.447*** -0.367** -0.0953 -0.0687 -0.0833* -0.0676* 0.0216 0.00146 0.269 0.153 (-3.89) (-3.25) (-1.68) (-1.19) (-2.56) (-2.15) (0.64) (0.04) (0.90) (0.51) Intercept 2.026 0.932 -0.365 -0.0222 0.150 -0.267 2.065*** 2.452*** -0.470 -0.832 (1.94) (0.80) (-0.69) (-0.04) (0.47) (-0.76) (6.43) (7.18) (-0.18) (-0.27) Obs 188 188 188 188 188 188 188 188 188 188
Note: The regressions are estimated by a random-effects model with a sample that covered more than 95% of all commercial banks in Thailand. All variables are defined in Table1. * denotes 10% level of significance, ** denotes 5% level of significance, and *** denotes 1% level of significance.
29
Table 5. Comparative Analysis of Foreign Banks and Domestic Banks
ROA IRS NII OE LLR
FDRA 0.179*** 0.0687** 0.0376** -0.0388 -0.317** (3.73) (2.71) (2.64) (-1.81) (-2.64) FD 0.167 0.867** 0.128 0.00538 -1.002 (0.41) (3.09) (1.12) (0.03) (-1.23) NIA -0.0182 0.0708*** 0.0114* 0.0224** 0.119* (-0.94) (6.82) (2.02) (2.62) (2.54) EQU 0.0283 -0.0134 0.0173* 0.00244 0.00516 (1.11) (-0.79) (2.39) (0.21) (0.10) OE -0.554*** 0.385*** -0.00314 -0.0875 (-3.58) (4.34) (-0.07) (-0.24) RBS 0.0465 -0.000570 0.0415*** -0.0232 0.0305 (1.55) (-0.02) (5.04) (-1.60) (0.56) GDP -0.0257 -0.0437 0.0157 -0.0132 0.190 (-0.50) (-1.65) (1.03) (-0.57) (1.46) RIR -0.714*** -0.261*** -0.0588** 0.0580 0.919*** (-9.29) (-6.55) (-2.59) (1.69) (4.74) INF -0.439*** -0.109* -0.0807* 0.0257 0.321 (-4.11) (-1.99) (-2.56) (0.54) (1.19) Intercept 3.758*** 2.199*** 0.338 2.101*** 0.312 (4.21) (4.17) (1.30) (5.54) (0.15) Obs 210 210 210 210 210
Note: The regressions are estimated by a random-effects model with a sample that covered more than 95% of all commercial banks in Thailand. All variables are defined in Table 1. * denotes 10% level of significance, ** denotes 5% level of significance, and *** denotes 1% level of significance.
30
Table 6. The Regression Results of Interest Rate Spread
Dependent Variables Benchmark (1) (2) (3) (4) FDRA 0.0746** 0.0687** 0.0875*** 0.0935*** 0.0645* 0.0784** (2.89) (2.71) (3.35) (3.42) (2.50) (3.04) FOW 0.00848** 0.00827** (3.24) (3.17) FD 0.867** 0.734** -2.031 1.330*** (3.09) (3.20) (-0.57) (3.71) HHI -33.85* -54.24** (-2.17) (-3.21) HHI*FD 22.83 (0.83) RBS 0.0341* -0.000570 0.0324* 0.0288 -0.00121 0.0143 (2.49) (-0.02) (2.35) (1.69) (-0.04) (0.62) RBS*FD -0.225* (-2.15) NIA 0.0659*** 0.0708*** 0.0680*** 0.0702*** 0.0698*** (6.65) (6.82) (6.94) (6.52) (6.67) (6.70) EQU 0.0621*** -0.0134 0.0511** -0.00622 -0.0118 -0.0130 (3.42) (-0.79) (2.76) (-0.43) (-0.68) (-0.81) OE 1.009*** 0.385*** 0.954*** 0.376*** 0.369*** 0.386*** (8.44) (4.34) (7.96) (4.29) (4.08) (4.41) GDP -0.0284 -0.0437 0.00350 0.00639 -0.0487 -0.0474 (-1.02) (-1.65) (0.11) (0.20) (-1.80) (-1.77) RIR -0.245*** -0.261*** -0.241*** -0.250*** -0.262*** (-6.08) (-6.55) (-6.08) (-5.85) (-6.57) (-6.55) INF -0.0953 -0.109* -0.148* -0.185** -0.103 -0.107 (-1.68) (-1.99) (-2.43) (-2.90) (-1.86) (-1.93) Intercept -0.365 2.199*** 4.065 8.632*** 2.263*** 2.036*** (-0.69) (4.17) (1.94) (3.94) (4.24) (3.99) Obs 188 210 188 210 210 210
Note: The regressions are estimated by a random-effects model with a sample that covered more than 95% of all commercial banks in Thailand. All variables are defined in Table1. * denotes 10% level of significance, ** denotes 5% level of significance, and *** denotes 1% level of significance.
31
Table 7. The Regression Results of Operating Expenses
Dependent Variables Benchmark (1) (2) (3) (4) FDRA -0.0448** -0.0388 -0.0334* -0.0250 -0.0471* -0.0392 (-2.93) (-1.81) (-2.13) (-1.17) (-2.19) (-1.83) FOW 0.00580** 0.00499** (3.13) (2.68) FD 0.00538 0.0602 -7.372* 0.0564 (0.03) (0.31) (-2.49) (0.20) HHI -23.44* -37.80** (-2.54) (-2.93) HHI*FD 57.94* (2.50) RBS*FD -0.0189 (-0.22) NIA 0.0170** 0.0224** 0.0172** 0.0235** 0.0191* 0.0219** (2.83) (2.62) (2.91) (2.81) (2.23) (2.58) EQU -0.0145 0.00244 -0.0212 -0.00201 0.00710 0.00496 (-1.16) (0.21) (-1.69) (-0.16) (0.60) (0.40) RBS -0.0175 -0.0232 -0.0185 -0.0201 -0.0206 -0.0226 (-1.29) (-1.60) (-1.36) (-1.32) (-1.43) (-1.45) GDP -0.0197 -0.0132 0.00288 0.0226 -0.0255 -0.0134 (-1.20) (-0.57) (0.16) (0.89) (-1.10) (-0.59) RIR 0.0520* 0.0580 0.0512* 0.0646 0.0551 0.0585 (2.16) (1.69) (2.16) (1.95) (1.63) (1.73) INF 0.0216 0.0257 -0.0155 -0.0279 0.0408 0.0263 (0.64) (0.54) (-0.43) (-0.56) (0.86) (0.56) Intercept 2.065*** 2.101*** 5.079*** 6.774*** 2.149*** 2.071*** (6.43) (5.54) (4.14) (4.11) (5.74) (5.43) Obs 188 210 188 210 210 210
Note: The regressions are estimated by a random-effects model with a sample that covered more than 95% of all commercial banks in Thailand. All variables are defined in Table 1. * denotes 10% level of significance, ** denotes 5% level of significance, and *** denotes 1% level of significance.
32
Appendix 1. Reorganization of Thai Commercial Banks from 1997 to 2015
Source: Compiled by the author from Commercial Banks in Thailand (1997-2014); Bank of Thailand (statistical data 1997-2015); annual report of commercial banks incorporated in Thailand.
33
Appendix 2 Foreign Share and Attribution of Foreign Subsidiaries in Domestic Commercial Banks (since 1997 to 2014)
Bank Name T.A.
1998 T.A. 2013 1997 1998 1999 2000 2001 2002 2003 2004 2005 2006 2007 2008 2009 2010 2011 2012 2013 2014 1,266.9 2,502.8 17.9 11.4 32.8 32.1 31.8 48.7 48.3 48.3 48.3 48.1 46.9 44.6 44.0 43.6 43.0 42.9 42.5 35.0 23.6% 17.7% 0 0 0 0 0 0 0 0 0 0 0 0 0 0 0 0 0 0 1,067.0 2,502.2 5.9 4.7 0.0 0.7 1.2 2.1 17.1 12.4 19.9 24.3 20.8 14.9 20.6 21.9 20.9 23.8 20.4 18.1 19.9% 17.7% 0 0 0 0 0 0 0 0 0 0 0 0 0 0 0 0 0 0 706.1 2,383.6 20.0 26.2 24.3 25.7 27.5 56.3 60.8 52.7 55.5 56.4 56.1 41.3 35.9 34.8 36.0 38.3 37.0 37.3 13.2% 16.8% 0 0 0 0 0 0 0 0 0 0 0 0 0 0 0 0 0 0 704.3 2,092.1 16.4 36.0 15.7 34.9 33.6 49.0 49.0 49.0 49.0 49.0 49.0 49.0 49.0 49.0 49.0 49.0 49.0 49.0 13.1% 14.8% 0 0 0 0 0 0 0 0 0 0 0 0 0 0 0 0 0 0 483.6 1,073.4 10.6 8.2 6.0 13.2 11.1 17.9 23.9 31.3 32.0 31.8 45.9 47.2 47.2 47.2 47.2 47.2 72.5 72.1 9.0% 7.6% 0 0 0 0 0 0 0 0 0 0 0 0 0 0 0 0 1 1 990.7 - - - 0.1 0.0 0.1 0.0 0.0 25.0 25.0 49.0 49.0 49.0 49.0 49.0 49.0 7.0% - - - 0 0 0 0 0 0 0 0 0 0 0 0 0 178 1.3 0.0 0.0 0.0 0.0 - - - -0 1 0 0 0 0 - - - -279 14.8 0.0 0.0 0.0 0.0 0.0 4.8 24.0 25.0 25.0 24.9 21.8 22.5 0.0 - - - -0 0 0 0 0 0 0 0 0 0 0 0 0 0 0 - - - -355.7 765.4 15.2 4.6 3.6 4.6 0.9 4.3 6.6 26.8 39.6 42.4 52.8 47.5 43.7 36.1 34.6 35.1 35.6 39.0 6.6% 5.4% 0 0 0 0 0 0 0 0 0 0 0 0 0 0 0 0 0 0 133 8.4 58.1 57.0 56.8 58.1 59.7 60.9 - - - -0 0 1 1 1 1 1 1 - - - -408.0 3.6 76.5 76.4 77.6 78.8 0.9 1.0 97.0 98.6 99.6 99.6 99.7 99.7 99.7 99.7 99.7 99.7 99.7 2.9% 0 1 1 1 1 1 1 1 1 1 1 1 1 1 1 1 1 1 48 15.6 100.0 75.0 75.0 75.0 78.8 78.8 83.8 - - - -0 0 1 1 1 1 1 1 1 - - - -342.0 - - - 44.5 48.6 48.9 40.1 47.3 48.2 47.8 49.0 42.5 48.1 2.4% - - - 0 0 0 0 0 0 0 0 0 0 68.2 278.4 26.9 0.0 0.0 0.0 0.0 3.9 0.7 5.8 6.0 0.5 37.1 88.2 97.2 97.2 97.2 96.8 96.8 96.8 1.3% 2.0% 0 0 0 0 0 0 0 0 0 0 0 1 1 1 1 1 1 1 74.1 254.8 9.6 15.3 75.0 75.0 75.0 75.0 75.0 75.0 99.8 99.8 100.0 100.0 99.9 100.0 100.0 100.0 100.0 100.0 1.4% 1.8% 0 0 1 1 1 1 1 1 1 1 1 1 1 1 1 1 1 1 234.3 - - - 42.9 44.0 38.8 38.4 32.8 43.2 33.6 38.5 33.6 32.7 1.7% - - - 0 0 0 0 0 0 0 0 0 0
148.7 - - - N.A. N.A. N.A. N.A. N.A. N.A. 0.2 0.3 0.8 0.9
1.0% - - - N.A. N.A. N.A. N.A. N.A. N.A. 0 0 0 0
148.1 - - - 38.4 30.0 29.7 26.0 18.1 97.4 97.7 97.7 97.7 97.7
1.0% - - - 0 0 0 0 0 1 1 1 1 1
25.9 - - - N.A. N.A. N.A. N.A. N.A. N.A. N.A. N.A.
0.2% - - - 0 0 0 0 0 0 0 0
17.6 - - - N.A. N.A. N.A. N.A. N.A. N.A. N.A. N.A. N.A. N.A.
0.1% - - - 1 1 1 1 1 1 1 1 1 1
Big 4 Simple Average 15.1 19.6 18.2 23.4 23.5 39.0 43.8 40.6 43.2 44.5 43.2 37.4 37.4 37.3 37.2 38.5 37.2 34.8
Big 4 Asset-wieghted Average*3 14.9 18.8 18.2 22.8 23.0 38.4 43.4 40.1 42.8 44.1 42.8 36.9 36.9 36.9 36.7 38.1 36.7 34.2
All Bank Simple Average 12.8 26.2 28.1 30.4 30.2 30.5 32.8 42.2 42.8 42.8 48.2 48.8 50.5 54.8 58.1 59.0 59.8 59.6
Note. Upper cell shows the foreign share. Lower cells show identification of foreign subsidiary 15 Thai Credit Retail Bank
16 Mega International Commercial Bank no financial data
13 Land and Houses Bank
14Industrial and Commercial Bank Of China (Thai)
11 Standard Chartered (Thai) 12 Kiatnakin Bank
9 Tisco Bank*2 *4
10 CIMB
8 United Overseas Bank (Thai)
20 UOB Radanasin Bank no financial data
7 TMB Bank
19 DBS Thai Danu Bank no financial data
18 Bangkok Metropolitan Bank no financial data
17 Siam City Bank 5 Bank of Ayudhya 6 Thanachart Bank 3 Siam Commercial Bank 4 Kasikorn Bank 1 Bangkok Bank 2 Krung Thai Bank