MOOClm: Learner Modelling
for MOOCs
Ronald Cook
A thesis submitted in fulfilment of the requirements
for the degree of Master of Philosophy
School of Information Technology
Faculty of Engineering
University of Sydney
2017
Acknowledgements
Judy Kaywas the primary supervisor for this thesis (and also for my 1991 Hon-ours thesis on a related topic). Her advice and guidance were invaluable. Bob
Kummerfeldably assisted Judy as secondary supervisor. Richard Glugawas
most helpful in providing access to the ProGoSS sources and template database, and with some issues in getting it all up and running. Andrew Lumprovided the Vlum source files for cross-evaluation. John Stavrakakis provided the COMP2129 2014 exam paper for evaluation with regard to Learning Objec-tives. Several members of the CHAI research group at the University of Sydney provided valuable advice and feedback on portions of the user interface for the final OLM interface.
Any inaccuracies in the text are entirely my own.
Summary of Publications
The material described in Chapters 3-5 was described in part in “MOOClm: User Modelling for MOOCs,” published by the International Conference on User Modeling, Adaptation and Personalization (UMAP 2015). [Cook et al., 2015]
Abstract
Massively Open Online Learning systems, or MOOCs, generate enormous quan-tities of learning data. Analysis of this data has considerable potential benefits for learners, educators, teaching administrators and educational researchers. How to realise this potential is still an open question.
This thesis explores use of such data to create a rich Open Learner Model (OLM). The OLM is designed to take account of the restrictions and goals of lifelong learner model usage. Towards this end, we structure the learner model around a standard curriculum-based ontology. Since such a learner model may be very large, we integrate a visualisation based on a highly scalable circular treemap representation. The visualisation allows the student to either drill down further into increasingly detailed views of the learner model, or filter the model down to a smaller, selected subset. We introduce the notion of a set of Reference learner models, such as an ideal student, a typical student, or a selected set of learning objectives within the curriculum. Introducing these provides a foundation for a learner to make a meaningful evaluation of their own model by comparing against a reference model.
To validate the work, we created MOOClm to implement this framework, then used this in the context of a Small Private Online Course (SPOC) run at the University of Sydney. We also report a qualitative usability study to gain insights into the ways a learner can make use of the OLM.
Our contribution is the design and validation of MOOClm, a framework that harnesses MOOC data to create a learner model with an OLM interface for student and educator usage.
Contents
1 Introduction 8
1.1 MOOClm’s Approach . . . 9
1.2 The need to integrate MOOCs with OLMs . . . 10
2 Background 15 2.1 Learner Models and Ontologies . . . 15
2.1.1 Ontologies . . . 15
2.1.2 Learner Models . . . 16
2.1.3 Scrutable User Models and Open Learner Models . . . 18
2.1.4 Learner Model Visualisations . . . 20
2.1.5 Ontology Visualisation as a Guide to Learner Model Vi-sualisations . . . 26
2.1.6 Overview of Visualisations . . . 31
2.2 Computer Science Education . . . 32
2.2.1 Knowledge Levels and the Bloom Taxonomy . . . 32
2.2.2 Pedagogies: Structuring Learning . . . 34
2.2.3 Course Design Software and ProGoSS . . . 35
2.2.4 The ACM CS2013 Model Curriculum . . . 37
2.3 Massively Open Online Courses . . . 40
2.3.1 Types of MOOC . . . 41
2.3.2 Problems with MOOC Participation . . . 42
2.3.3 Motivation . . . 44
2.3.4 MOOC Assessment . . . 45
2.3.5 Recent Developments . . . 45
2.4 Learning Analytics and Educational Data Mining . . . 46
2.4.1 Overview of Learning Analytics . . . 46
2.4.2 Application of Learning Analytics . . . 47
2.4.3 Learning Analytics and Learner Models . . . 48
2.4.4 Overview of Educational Data Mining . . . 49
3 Conceptual Model 50 3.1 Overview . . . 50
3.1.1 Course and Curriculum Design and the MOOC . . . 52
3.1.3 Learner Model Design for the OLM . . . 52
3.1.4 Key Interface Elements for the OLM . . . 53
3.2 Course and Curriculum . . . 54
3.3 Population of the Learner Model . . . 54
3.4 The Open Learner Model . . . 55
3.4.1 Learner Model . . . 55
3.4.2 Reference Models . . . 56
3.4.3 Filters . . . 57
3.5 Review of Aims . . . 59
4 Design of the OLM 61 4.1 Representation of the Learner Model . . . 61
4.2 Design of the Full Learner Model Ontology . . . 62
4.3 Design of the Visualisation . . . 64
4.4 Reference Models and the Learner Model . . . 65
4.5 MOOClm . . . 66
4.5.1 OLM Visualisation . . . 67
4.6 MOOClm: Mapping and the Reference Model . . . 70
4.7 Resolver Tuning . . . 72
4.8 Simple vs. Expert Interfaces . . . 73
4.9 Component Selection and Display . . . 74
4.10 Learning Resources . . . 78
4.11 Directive to New Learning . . . 79
5 Implementation 80 5.1 System Architecture . . . 80
5.2 Constructing and Populating the OLM . . . 81
5.2.1 Parsing Evidence Logs . . . 82
5.2.2 Parsing Evidence . . . 83
5.2.3 Construction of Reference Models . . . 83
5.2.4 Construction of Filters . . . 84
5.3 Implementing the Visualisation . . . 85
5.3.1 Core Interface . . . 85
5.3.2 OLM Backend . . . 85
5.3.3 Internal Learner Model Representation . . . 86
5.3.4 Visualisations . . . 87
5.3.5 Privacy and State Tracking . . . 89
5.4 Personis Backend and Resolvers . . . 89
5.5 Integration with the MOOC . . . 90
5.6 Statistical Analysis . . . 92
5.6.1 Origin of the Data Set . . . 92
5.6.2 Description of the Data Set . . . 93
5.6.3 Hypothesis: Activity in SPOC results in improved Learning 95 5.6.4 Hypothesis: Assessment in SPOC indicates improved Learn-ing . . . 97
5.6.5 Hypothesis: Correlation is higher when variables have a
larger number of possible values . . . 97
5.6.6 Other possible predictive hypotheses . . . 99
5.6.7 Breaking data down by Decile . . . 102
5.6.8 Statistical Result for Personis Resolver . . . 104
6 Evaluation 105 6.1 Study Design . . . 105
6.2 Study Structure . . . 106
6.3 Thinkaloud Study - Outline of Participants . . . 108
6.4 Thinkaloud Study - Detail of each Question . . . 108
6.5 Outline of Results . . . 128
6.6 Discussion concerning questions with no tied hypothesis . . . 130
6.7 Conclusions regarding Individual Hypotheses . . . 134
6.8 Conclusions from the Study . . . 136
7 Conclusion 138 References . . . 141
Appendices 149
A Nqv (New QuickView) 150
B Exam Learning Objectives 152
C Characteristics of Full Learner Model 155
D Restricted MOOC Ontology (Phase 1) 156
E Think-Aloud Study: Script 165
F Think-Aloud Study: Ethics Approval 168
List of Figures
1.1 MOOClm Core Elements . . . 9
2.1 qv . . . 21
2.2 LOSUM/SIV Sample Model View . . . 22
2.3 Fraction Helper - Student View . . . 23
2.4 Fraction Helper - Parent view . . . 24
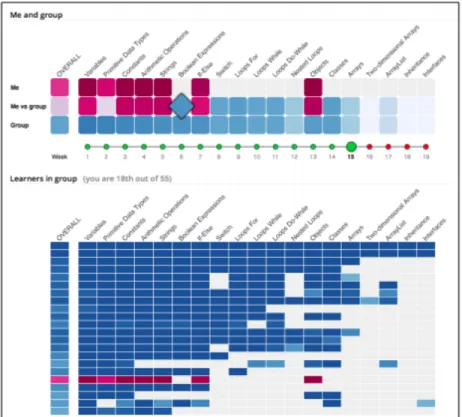
2.5 Mastery Grids. The top summarises relative progress of student vs. group, where the bottom section shows a ranked display for all learners. . . 25
2.6 INGRID tree and sunburst representations of a user model. The tree representation, at top, shows the expansion of one subtree at each level and the truth values of those items. The sunburst shows all elements, but lacks space to show information on each element. . . 27
2.7 Sample view of the Visual Thesaurus . . . 28
2.8 Sample Icicle plot . . . 29
2.9 Sample of a Hyperbolic Tree (Figure 1 from [Lamping et al., 1995]) . . . 29
2.10 Sample of a Voronoi Treemap (Figure 10 from [Balzer et al., 2005]) . . . 30
2.11 Sample of a Rectangular Treemap (here from a disk usage anal-ysis using WinDirStat). Larger blocks represent larger files and directories. . . 31
2.12 Sample of a Circular Treemap (from MOOClm) . . . 32
2.13 NSW Department of Education Science and Technology Learning Outcomes . . . 35
2.14 Moodle Learning Outcomes - Course Summary . . . 36
2.15 List of Assessment Questions for an exam as represented in Pro-GoSS . . . 37
2.16 Assessed Topics for a question in ProGoSS, including topic names, descriptions, Bloom levels and the confidence level from which a learning outcome may be concluded . . . 38
2.17 ProGoSS Assessed Outcomes Example . . . 39
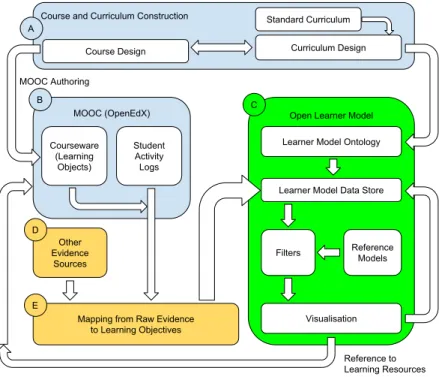
3.1 MOOClm Integration and Dataflow . . . 51
3.2 Full Unmapped view of the OLM . . . 58
3.3 OLM view with MOOC Evidence Filter applied . . . 59
3.4 Example of Mapping to Restructure Model Topology . . . 60
4.1 Integration of components for the OLM . . . 65
4.2 Core Interface Elements . . . 67
4.3 Searching the Model . . . 68
4.4 MOOClm with Extended ACM Ontology . . . 69
4.5 MOOClm view of Learner Model with MOOC evidence filter ap-plied . . . 71
4.6 MOOClm view of MOOC Exercise Outcomes with Reference Model of Exam-Tested Objectives . . . 72
4.7 Comparison of Simple vs Expert Interfaces . . . 74
4.8 Zooming into the Learner Model: When viewing SoftwareDevel-opmentFundamentals, clicking the DevelopmentMethods bubble zooms into DevelopmentMethods . . . 75
4.9 Strings Evidence . . . 76
4.10 More Strings Evidence . . . 76
4.11 Evidence list after "I KNOW This" . . . 78
4.12 Learning Resources . . . 78
5.1 MOOC Evidence Processing for the OLM . . . 81
5.2 Sample of prototype dendrogram cluster visualisation . . . 88
5.3 MOOC launch page for the OLM (top and bottom) . . . 91
5.4 Scatter plot of exam mark vs Video Events . . . 95
5.5 Scatter plot of exam mark vs Problem Solution Events . . . 96
5.6 Scatter plot of exam mark vs Problems Correct . . . 98
5.7 Scatter plot of exam mark vs Length of Run of Initial Correct Answers for strings . . . 100
5.8 Scatter plot of exam mark for Strings LO vs percentage of MOOC Strings attempts correct . . . 101
5.9 Decile 2: Scatter plot of exam mark for Strings LO vs percentage of MOOC Strings attempts correct . . . 102
5.10 Decile 9: Scatter plot of exam mark for Strings LO vs percentage of MOOC Strings attempts correct . . . 103
6.1 Sample Solution: Question 1.1 . . . 109
6.2 Sample Solution: Question 1.2 . . . 110
6.3 Sample Solution: Question 1.3. The arrows point to the key portions of the interface for answering this question. . . 112
6.4 Sample Solution: Question 1.4. The arrow indicates the button to press to indicate that this item is known. . . 113
6.5 Change to Learner Model after 1.4 (detail) . . . 113
6.6 Sample Solution: Question 1.5. The arrow points to the link for additional learning resources . . . 115
6.7 List of Learning Resources displayed for Q1.5 . . . 115
6.8 Comparison of Simple (left) and Expert interfaces . . . 117
6.9 Sample Solution: Question 1.7. Arrows indicate where changes must be made to satisfy this exercise. . . 118
6.10 Question 1.9 First Visualisation: Circular Treemap with slanted text . . . 120
6.11 Question 1.9 Second Visualisation: Sunflower . . . 120
6.12 Question 1.9 Third Visualisation: Dendrogram Tree . . . 121
6.13 Sample Solution: Question 2.1 . . . 122
6.14 Sample Solution: Question 2.2 . . . 123
6.15 Sample Solution: Question 2.3 . . . 124
6.16 Sample Solution: Question 2.4 . . . 125
6.17 Sample Solution: Question 2.5 . . . 126
6.18 Sample Solution: Question 2.6 . . . 127
List of Tables
2.1 Summary of Visualisations . . . 33
3.1 Portions of Conceptual Model for each Requirement . . . 60
5.1 Modelling exam results per question vs video and problem flags . 94 5.2 Modelling exam results vs problems attempted and problems cor-rect . . . 97
5.3 Matrix of coefficients of correlation . . . 99
6.1 Thesis Hypotheses . . . 106
6.2 Hypotheses Tested by each question . . . 107
6.3 Information about participants . . . 108
6.4 Ease of understanding - Question 1.1 . . . 108
6.5 Ease of understanding - Question 1.2 . . . 109
6.6 Ease of understanding - Question 1.3 . . . 111
6.7 Ease of understanding - Question 1.4 . . . 112
6.8 Ease of understanding - Question 1.5 . . . 114
6.9 Ease of understanding - Question 1.6 . . . 116
6.10 Ease of understanding - Question 1.7 . . . 117
6.11 Ease of understanding - Question 1.8 . . . 118
6.12 Ease of understanding - Question 1.9 . . . 119
6.13 Ease of understanding - Question 1.10 . . . 121
6.14 Ease of understanding - Question 2.1 . . . 122
6.15 Ease of understanding - Question 2.2 . . . 123
6.16 Ease of understanding - Question 2.3 . . . 124
6.17 Ease of understanding - Question 2.4 . . . 125
6.18 Ease of understanding - Question 2.5 . . . 125
6.19 Ease of understanding - Question 2.6 . . . 126
6.20 Summary of Results Across all Questions . . . 128
6.21 Time taken by Thinkaloud Participants . . . 129
6.22 Time taken by hypothesis . . . 130
Chapter 1
Introduction
Massively Open Online Courses (MOOCs) represent a number of new challenges and opportunities over traditional online and face-to-face courses.
This thesis demonstrates an approach to using the mass of data available from a MOOC to build a learner model, “a model of the knowledge, difficulties and misconceptions of the individual” [Bull, 2004], and make it available to the learner.
Our approach facilitates the large, long-term learner models typical of those which life-long usage is anticipated to require by basing the learner model on a broad-based ontology while permitting the student to focus on specific areas of interest.
Classes on the scale of a typical MOOC, in the thousands or tens of thou-sands, do not permit students to be monitored on an individual basis. This necessitates a low level of intervention on a per-student basis and introduces a risk that possibly serious individual student problems may be lost in a mass of largely irrelevant data.
We use an Open Learner Model (OLM), a learner model “that can be viewed or accessed in some way by the learner, or by other users (e.g. teachers, peers, parents)” [Bull and Kay, 2010]. This grants greater transparency to the sys-tem’s tracking of learner progress and opens the option of sharing this progress between multiple MOOCs or SPOCs (Small Private Online Courses) [Fox, 2013]. We integrate a SPOC developed using the OpenEdX platform with an Open Learner Model (OLM) built from a standard curriculum, with an ontology based on the ACM CS2013 Undergraduate Computer Science curriculum [ACM Joint Task Force, 2013].
Adding an interface to the Learner Model makes it an Open Learner Model. We assembled an interface based on a circular treemap visualisation as intro-duced by Kai Wetzel, here as implemented by Bostock’s D3 library [Bostock et al., 2011].
The potential to share an Open Learner Model between MOOCs suggests repeated use of the Learner Model over the long term, a Lifelong Learner Model [Kay, 2008]. Such Lifelong Learner Models are intended for use on an ongoing
and perhaps indefinite basis, integrating data harnessed across multiple appli-cations. In contrast, many learner models studied in the literature concern interaction with single applications, with a correspondingly limited set of learn-ing outcomes that must be represented. We discuss the design constraints for a Lifelong Learner model which differentiate it from learner models scaled for a single course or application.
1.1
MOOClm’s Approach
We attempt to integrate several core components into our framework. Figure 1.1 shows how these elements interact at the highest level.
Curriculum
MOOC
OLM Structure
MOOC Design
Evidence from Student Activities
Reference to Learning Resources
Learner Model Interface Learner Model OLM Interactions
OLM
Figure 1.1: MOOClm Core Elements
First Element: The Curriculum
The first component is theCurriculum, being the body of knowledge represented by our course. The curriculum structure may be considered as anontology, a “set of concepts and categories in a subject area or domain that shows their properties and the relations between them.” (OED) Our background chapter discusses this in more detail.
Our Curriculum is the material which we want our students to learn. At its simplest level, it can be expressed as a set ofLearning Objectives, or capabilities which we wish the student to learn by the end of the course, along with the level of sophistication at which we want the student to be able to accomplish each task. These “levels” represent the student’s depth of understanding. The Bloom taxonomy [Bloom and Krathwohl, 1956] is perhaps the best known taxonomy of learning levels, representing knowledge from its most basic (Knowledge) to most advanced (Evaluation).
Second Element: The MOOC
The second component is the actualMOOC - the Massively Open Online Course which teaches our curriculum.
In the terms used by OpenEdX, our MOOC platform, this is the “course-ware”. It consists of lecture videos and slides, short- and long-answer self-test questions, forums for student interaction, and any other components desired by the course designer.
These components of the course are normally referred to as Learning Ob-jects, course elements constructed to assist the student in meeting the Learning Objectives. These may consist of tutorial videos, sample exercises, discussion forums, or anything else intended to assist the student’s learning. These may also be referred to asLearning Resources.
The MOOC may also have its ownAssessment Instrumentsto test and eval-uate the capabilities of the student, which typically contribute towards a final score for the course. These include (but may not be limited to) class assign-ments, intermediate tests and the final course exam. Assessment Instruments are the means by which educators typically determine whether a student has achieved the course’s Learning Objectives.
While building the OLM we can observer student interactions with both Learning Objects and Assessment Instruments to infer the student’s knowledge of each topic.
Third Element: The OLM
The third component is the Open Learner Model, the data store which holds information about a student’s characteristics and activity in a fashion facilitating interaction and the interface which allows the learner to interact with it.
Our Learner Model is modelled after our desired curriculum, in our case the ACM CS2013 Undergraduate Computer Science curriculum.
1.2
The need to integrate MOOCs with OLMs
• Integration of the OLM permits the MOOC to personalise content, beyond that which is possible solely from the resources of the MOOC itself.
• The MOOC maytake advantage of learning data from other MOOCs
or from other sources, such as traditional coursework.
• The educator is given the opportunity to view the specific progress of the learner. If the OLM includes data from other resources, they may be informed of student capabilities that are not reflected in the MOOC.
• The OLM allows the learner to view (and possibly compare) their learn-ing progress in a consistent fashion across multiple resources. The OLM providesan overview which may be absent from the MOOC itself. With regard to tracking of student progress, studies indicate [Wilkowski et al., 2014] that students do not always approach a MOOC in the same manner as a traditional course. Rather than proceeding through a course sequentially from beginning to end, students may select individual components of the course, using the course as a learning resource, picking and choosing in a manner more common with reference works.
This creates new challenges for course and curriculum designers, who must allow for students working through nominally more advanced material without the explicit grounding of earlier parts of the course. Course designers must also allow for cases where the student haslegitimately skipped over previous content in order to reach the material for which they have most immediate need.
As we intend that the learner model be used as a basis for lifelong learning, it follows that the same learner model should be reusable across multiple MOOCs. A learner model that integrates the knowledge from multiple MOOCs in such a fashion may be of arbitrarily large size. This is because it must be able to store all learning objectives covered by all MOOCs in which the student participates. While our implementation and interface study only concerns a single SPOC, such re-usability is vital if the OLM is to be useful in a lifelong learning context. Designing for such a learner model introduces requirements absent from those for a particular course. The Learner Model must be adaptable to multiple course frameworks, while any interface must permit the learner to restrict their view of the OLM to whichever subset is of most immediate interest.
In an effort to address these issues, we present MOOClm. It represents a generalisable framework for mapping an Open Learner Model onto a course’s curriculum, in terms of learning objectives, as well as its teaching and assessment components. The framework was designed to compare student performance against a competing student or a particular portion of a curriculum, but also has other applications in assessing the coverage of the MOOC and its assessment instruments.
Design Goals for the OLM and the Learner Model
Our goal is to assist the student in knowing their progress in terms of learning the total content of a course, for example so that they could skip content in which they have no interest. This also permits the student to track their progress as the course continues.
Thus we design our framework to answer the following questions, as listed in our 2015 paper [Cook et al., 2015]. These concern“What” the student knows and can see.
1. (H1) Overview: What is the overall progress of this student on the
learning activities?
2. (H2) On-track: In which learning objectives has the learner met the teacher expectations?
3. (H3) Behind: In which learning objectives are they lagging behind ex-pectations?
4. (H4) Activity-Type-Progress: What are the answers to Q2-3 for a
particular class of activity (video, exercise, discussions.... )
5. (H5) Act: How can the student find learning resources associated with any given learning outcome?
Broadly, the goal is to use a Learner Model to track the student’s progress. As we cannot guarantee that automated inferences will always be correct, our design goal is that the student should be able to make corrections to any in-ferences made by the system. Our Learner Model is already required to the Open (i.e. an Open Learner model) by virtue of being viewable. In making it modifiable, it must also be open to user feedback.
Because we would like our learner model to be re-usable in the long term as a lifelong learner model, it should support arbitrary expansion of the OLM to include additional courses and fields, potentially representing multiple fields of a person’s knowledge. This introduces an additional dimension of scalability; we allow not only for large numbers of students, but for large numbers of topics. We supplement our core five questions with several design goals chosen to further use of our OLM for lifelong learning - or“How” we structure our OLM and its interface specifically for lifelong learning.
6. (H6) Openness: To permit student interaction for the Learner model, it needs to be not simply a learner model, but anOpen Learner Model. The need for student corrections to the learner model requires that the OLM be modifiable as well as simply viewable.
7. (H7) Selectivity: There must be a way to view parts of their model
8. (H8) Topology Mapping: To match different possible arrangements of the course material, the topology of the OLM as presented to the student must be modifiable. For example, remapping the course topology would allow the student to view material with learning objectives organised by week or by topic, or to group topics with their logical prerequisites.
9. (H9) Comparison: To permit comparisons of a Learner Model against
other students - and against selected components of the curriculum - we would like to permit comparison of Learner Models. The “students” may be notional (“ideal” or “typical”) or real. This is in some ways a more general form of ourActivity-Type-Progress question.
10. (H10) Curriculum: Since we are comparing one set of learning objects (what the learner knows) with another set of learning objectives (the ob-jectives covered by a curriculum or a learning object) we should be able to use our toolset to cross-compare these selected “slices” of the curriculum. We designate these goals as H1-H10. These represent ten hypotheses that we believe our design successfully accomplishes.
The interface should permit ready overview of the model as a whole, as well as selected parts of the OLM, in a helpful manner - it should facilitate learning and introspection.
In addition, we attempt to design our OLM in such a manner that it is well-suited for lifelong learning. Basing the OLM on a standard curriculum makes it easier to map the OLM against new MOOCs using the same curriculum. Since the student may participate in many MOOCs, we must also allow for the student’s complete learner model to include the learning objectives of all such MOOCs. While the full Learner Model may be very large, the student is likely to only be interested, at any given time, in that portion of the OLM concerning their current course or learning focus. As such, we need to allow for the student to see a selected slice of a potentially enormous OLM. The topology mapping tools for H8 will be useful for this purpose. Since we only examine a single SPOC, we cannot test whether we have met these goals successfully. As such, they are not listed amongst our hypotheses.
Outline
Chapter 2 reviews background work on Learner Models, Curriculum Design and different approaches to visualising ontologies.
Our approach is outlined in Chapters 3-5. Chapter 3 describes the over-arching Conceptual Model. Chapter 4 then describes design of our OLM, in-cluding the underlying ontology and the visualisation. Chapter 5 outlines the implementation in additional detail.
In Chapter 6 we demonstrate that our framework successfully answers our core questions and design goals. This is done by a set of worked examples and by a small-scale thinkaloud study.
Chapter 7 concludes.
Our contribution is in, firstly, the creation of an Open Learner Model suit-able for use with MOOCs in a lifelong learner context; and secondly, the creation of the MOOClm framework for integrating this OLM with a MOOC. Key in-novations of this framework are the use of filters to limit visible scope, and the use of a “Reference Model” to explicitly compare learner models.
Chapter 2
Background
Our contribution integrates components from several different fields to mutual advantage. The primary fields involved are Learner Modeling (or User Model-ing), Computer Science Education, and Massively Open Online Courses. We also discuss the field of Learner Analytics, required to build a learner model from mass data.
2.1
Learner Models and Ontologies
Learner Models are a specialised case of the broader area of User Modeling. A User Model is a “the system’s set of beliefs about the user’s knowledge, pref-erences, goals and attributes” [Kay, 1999]. In many respects, the core of a user model comprises a user-specific mapping of a field of knowledge against an
ontology intended to represent the knowledge and beliefs of a user.
2.1.1
Ontologies
An ontology “defines a set of representational primitives with which to model a domain of knowledge or discourse. The representational primitives are typically classes (or sets), attributes (or properties), and relationships (or relations among class members).” [Gruber et al., 2009] It may be viewed as a computer-based specification for a “knowledge map”, a computer model of a field of knowledge. In this respect, any organised collection of knowledge may be used to seed an ontology with concepts and information. However, an ontology in the Infor-mation Technology sense of the term specifically refers to a representation of knowledge held within a computer.
An ontology may be lightweight or heavyweight. A lightweight ontology is essentially a list of concepts, knowledge and beliefs, with little representation of how the represented information inter-reacts. A heavyweight ontology, on the other hand, adds information about how the components of the ontology interrelate, “add[ing] axioms and constraints to lightweight ontologies” [Corcho
et al., 2003]. In a lightweight ontology, there may be knowledge components for “addition” and “subtraction.” A heavyweight ontology would have these components and additional information indicating, for example, that if a + b = c then a = c - b (relating addition and subtraction algebraically) or that
subtraction is equivalent to the addition of a negative number.
2.1.2
Learner Models
This thesis uses the definitions referenced in section 2.1 for Learner Models and User Models. Where a User Model is a representation of a user’s knowledge, beliefs and characteristics, a Learner Model is a User Model intended for use in an educational context. We will be using both terms depending on the appli-cability of the concepts under discussion. User Models have been used for over twenty years as a tool to track learner progress in achieving educational course outcomes [Kay, 1994]
User Models and Ontologies
In many respects a User Model may be seen as a user-specific instance of an ontology. Where an ontology represents what may be known about a field of interest, a User Model represents what is known or believed by a particular user. As such, it is possible to take an ontology and convert it into a form suitable for use as a user model. However, user models may extend the ontology by adding user characteristics that are absent in the baseline ontology.
Examples of information which may be represented in a User Model which do not correspond to elements of an ontology include:
• User-specific characteristics such as name, age and gender.
• Information about the person’s learning style and preferences.
• Information about educational background and other courses completed. All of these items carry some obvious use in an education context. The person’s name can be used to personalise presentation or to draw attention. Age may be used to draw examples from material with which a user is more likely to be familiar. Gender may be used to adjust names and genders of participants in examples in order to encourage sympathetic interaction. Information about learning style may be used to adjust the ordering and presentation of material. Another key concept to be integrated when building Learner Models is in-formation aboutdepth of knowledge. A learner model must represent not only what is known, but how well it is known and the degree to which the learner is familiar with a concept. The most common taxonomy used for this is that proposed by Bloom et al. in 1956 [Bloom and Krathwohl, 1956], which was sub-sequently revisited by Krathwohl with many revisions. [Anderson et al., 2001, Krathwohl, 2002] These changes included the reversal of the two highest “lev-els” and extension with additional elements such as creativity. However, where
relevant this thesis limits itself to the earlier work due to its existing extensive use in the literature. This is discussed in additional detail in section 2.2.
It is possible to simplify representation of a user model based on a heavy-weight ontology into a lightheavy-weight form, while losing some internal semantic information. In the example given earlier relating the concepts of addition and subtraction, the relationship explicitly linking addition and subtraction becomes a new knowledge component, for example, “knows that subtraction is equivalent to adding the negative of the same number.” The semantic link between the concepts is then imposed from without by the model’s interpretation of available evidence.
As mentioned in our Introduction, an Open Learner model (OLM) is a Learner Model “that can be viewed or accessed in some way by the learner, or by other users (e.g. teachers, peers, parents)” [Bull and Kay, 2010]. We discuss this further in section 2.1.3.
Building the User Model: Evidence
In building the user model, it is necessary to have some source of evidence from which to decide the state of each model component. Generally this has been done via an explicit link to the software from which evidence is collected. Mapping from arbitrary evidence in an arbitrary format to a standardised user model format presents a significant challenge. The publication of the TinCan API [Kelly and Thorn, 2013] provides a standardised format for storage of evidence and so acts as a translation layer for collection of evidence between arbitrary software packages and the user model. Another approach is suggested by Veera-machaneni et al., who break down the most common interactions with a MOOC and design their MOOCdb database schema around this data [Veeramachaneni et al., 2013]. The approach typified by MOOCdb bears the weakness that any-thing outside of the projected interactions cannot be represented; for example, there is no model for collaboration between different MOOCs.
However, data on learner knowledge as tracked formally by the MOOC may not always be available. It may be necessary to extrapolate user patterns not from data provided directly by a MOOC or LMS, but from the raw web server logs maintained by the system. Zaïane et al. described how raw server logs could be used to infer additional data about the learner [Zaïane and Luo, 2001, Zaíane, 2002]. One problem with this approach is that most standard tools for server log analysis are aimed at commercial interests in order to extract purchasing data rather than student progress, necessitating the use of customised tools or, at minimum, tight tuning of the commercial packages.
Regardless of intermediate representation of the evidence used, it is often necessary to use Learner Analytics or Educational Data Mining techniques to actually extrapolate from available evidence to valuation of models. What pat-terns in viewing videos represent active exploration of the subject material? When answering assessment questions, does answering a question successfully after several incorrect answers indicate actual knowledge of the topic at hand, or has the learner simply been picking answers at random until finding the
right one? What depth of knowledge is possible when nominal prerequisites are not satisfied? It is such interpolations and extrapolations that require use of analytical techniques.
Reusability
Kay’s 1999 paper [Kay, 1999] also discusses the utility of reusability in a user model. Once a user model is available, it can potentially be used not only in that context but in others. A Learner Model associated with teaching basic cryptography techniques may also reference a different part of the model con-cerning number theory in order to determine whether prerequisite mathematics is known.
Some Learner Model designs have been incorporating reusability as a basic feature [Brusilovsky et al., 2005, Kay and Kummerfeld, 2012] in part as a step towards lifelong modelling [Kay, 2008]. This approach also reduces the need for rebuilding possibly complex OLMs and OLM agents for different courses [Chen and Mizoguchi, 2004], especially given the developing potential for reuse of courseware [Stewart et al., 2005, Fletcher et al., 2007].
For a user model to be re-usable, it must be held in a format that is recognis-able by multiple systems. One approach is typified by GUMO [Heckmann et al., 2005] which builds on the standardised userML markup language to represent the model.
The Personis server [Kay et al., 2002] provides a secure framework for storage and access to the user model, including facilities for limiting access to particular parts of the model and protocols for remote access.
Personis also provides for use of distinct user model “Resolvers”, a selection of alternative internal code functions that calculate the truth value of a model component by giving different weighting to different evidence depending on user or application preferences. For example, one resolver may ignore video evidence; another may ignore evidence after a particular point in time in order to find the value at that time; or may choose toignore explicit evidence to examine how a component resolves independent of user input.
Personis has a strong emphasis on user scrutability of their user model. Resolved values are chosen not at the point when the model is populated, but by a resolver which is supplied when values for model components are queried. Models may be accessed locally or remotely and incorporate permissions on a per-application and per-user basis for each model.
2.1.3
Scrutable User Models and Open Learner Models
Once the decision is made to create a user model, one must decide how widely the model will be available. The default with most software is to hide the model from the user; when running Google searches, they do not reveal to you the database they use in tuning your search results.
Scrutability of user models (that is, permitting the user to scrutinise their own model) has been shown [Cook and Kay, 1994, Lum, 2007] to improve
stu-dent understanding and recognition of areas where effort is required for addi-tional learning. Use of user models for educaaddi-tional feedback was explored as early as the early 90s [Cook and Kay, 1994], with more recent studies demon-strating much more sophisticated visualisation tools, permitting users to gain greater insight into their progress towards educational objectives. Lum [Lum, 2007] examines the case for scrutability in user models to permit learners to examine those areas where the system “believes” their progress in course com-pletion to be deficient.
This research has contributed to the concept of the “Open Learner Model” (OLM), a learner model available both to the student and to the software being used for their education.
Bull and Kay describe in their SMILI paper [Bull and Kay, 2007] some of the dimensions involved in determining whether a student modelshould be viewable and how it should be presented, covering the many visualisations used for presenting student model data to the learner. SMILI presents a framework in which to view the extent and purpose of a user model and its scrutability.
The SMILI framework has four parts:
1. Context and evaluation: How does the open learner model fit into the overall interaction and how was it evaluated? Is evidence interpreted con-sistently depending on who is viewing it? (For example, a teacher may choose to view the model in a way which ignores student claims about things that they know that are not supported by direct evidence.) How important to the purpose of the model is its degree of openness? Is the model presented in a fashion that is easy to understand? How is the model used?
2. WHAT is open? Is the entirety of the model visible? If not, which parts are hidden from which viewers or applications, and what is the basis for these decisions? Is raw evidence available, or only final conclusions? Who is able to make changes?
3. HOW is it presented? How is the model presented to the student? Are parts available but hidden in the default view? Are multiple views avail-able? How are different components highlighted? Is the view tailored differently for the student compared to the teacher?
4. WHO controls access? Can the user block access to others? Can the user permit access to others? Is access controlled by the student, or by the applications that constructed the student model in the first place? How is data protected?
These four components can be used to evaluate the extent to which a student model is “open” or merely appears to be. The SMILI paper was written to summarise several previous published papers in terms of how the user models exposed fit into the SMILI framework.
The SMILI framework was revised in a 2016 paper [Bull and Kay, 2016] in the context of OLM developments since the original paper’s publication. The
newer paper suggests small modifications of the framework in the light of more recent developments.
One interesting possibility arising from use of Learner Management Systems and MOOCs is that a student may choose to compare their user model with other students. Hsiao et al. found [Hsiao et al., 2011] that allowing students to compare the progress of their learner model against that of other students resulted in a substantial (39%) increase in the average number of attempts at each quiz question compared to a control group where the parallel visualisation was not available. However, availability of parallel views also led to more ad-vanced students making 25% fewer attempts, which is unlikely to be a desirable outcome. There is also some risk to students who make poor progress; 23% of students in this survey indicated that they would only wish to show positive progress to their peers.
In 2006, Bull and Mabbott [Bull and Mabbott, 2006] also explored the idea of comparing an Open Learner Model against their peer group and against instructor expectations for their progress in the course using a skill meter vi-sualisation. Eighteen of twenty-three respondents agreed that a comparison to instructor expectations was useful (with five neutral responses). Twenty out of twenty-three agree that a peer comparison was useful (with two neutral and one disagreement.)
2.1.4
Learner Model Visualisations
Once a user model is created and populated, in order for it to actually be scrutable, some form of representation is required. At its simplest level this can be a simple text interface listing the knowledge components and values. However, scrutability is advantageous for learner feedback and tuning of their learner model [Kay, 2000]. It follows that the representation of the model for the user should be designed towards those purposes.
The learner model should be scrutable and permit learner interaction; easily understood; permit comparison against different learner models; be scalable for large learner models; and transparent in function.
An “ideal” model viewer would enable all of these, but in practice any given design will favour some of these tasks over others. Andrew Lum’s “LOSIV” viewer [Lum, 2007] highlights those areas of most interest, permits evidence to be examined and allows uninteresting “clutter” to be hidden, but will only show a single user’s model at any time.
In contrast, Loboda et al.’s “Mastery Grids” [Loboda et al., 2014] present a very simple representation of learner progress while giving a quite nuanced representation of learner progress compared to the student’s classmates.
We examine here a selection of visualisations from the literature and one visualisation created for this project. These are summarised by Table 2.1 on page 33.
Figure 2.1: qv
qv
Figure 2.1 illustrates qv (QuickView), a simple visualisation designed as an early experiment in presenting a learner model to the student along with the evidence chosen to populate it [Cook and Kay, 1994]. The model was presented as a hierarchical tree; each node could be clicked to collapse or expand all available sub-nodes. Any resolved node could be right-clicked to bring up a list of associated evidence.
Qv is straightforward but not particularly scalable, and lacks information on the detail of each element of the learner model. It also lacks references to learning resources.
LOSUM/SIV
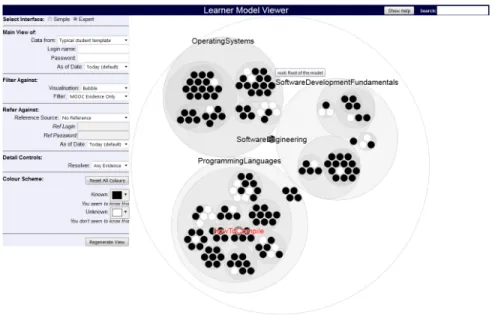
SIV, illustrated in Figure 2.2, is a visualisation designed by Andrew Lum [Lum, 2007] to highlight those items of most interest and so guide the student to the most relevant next topic. While in the default view, low-level topics are shown jumbled together and unreadable, the interface includes provisions to filter out much of the overlapping material and so enable the viewer to focus more easily
Figure 2.2: LOSUM/SIV Sample Model View
on key parts of the model. The viewer includes a detailed view of the evidence used to populate each model component when selected; the figure shows an example of this in the large right pane.
Fraction Helper
Fraction Helper [Lee and Bull, 2008], shown in Figure 2.3 and Figure 2.4, is a simple OLM-based application designed to assist students in learning how to manipulate fractions correctly, and in teaching their parents how to correctly instruct their children. As such, the information modelled is quite limited in domain, but is presented in two distinct ways. The representation shown to the student) (Figure 2.3) includes pictures of healthy or “sad” trees, depending on what misconceptions are held, along with text telling the student where their problems probably lie. The visualisation for the educator (Figure 2.4) focuses on specific concepts and where improvement is most needed.
More recently, Aleven et al. [Aleven et al., 2016] use a similar approach for their “Example-based tutor”, using a variety of different interfaces.
Mastery Grids
Mastery Grids [Loboda et al., 2014] are shown in Figure 2.5 These were im-plemented as a means for the student to track their own progress through a
Figure 2.5: Mastery Grids. The top summarises relative progress of student vs. group, where the bottom section shows a ranked display for all learners.
course and compare their progress against other students as well as a model “standardised progress” pseudo-user representing where the student’s progress should lie in the course material. Emphasis is heavily on social comparison, with little effort made to demonstrate underlying knowledge structure or sup-porting evidence. Most students found availability of the model to be useful and results showed that many students were spurred on by seeing their progress compared to that of others. One possible issue of concern is that the most ad-vanced students appeared to be somewhatdemotivated rather than motivated by the comparison.
Ioana Jivet’s Masters Thesis [Jivet, 2003] simplifies the approach used by Mastery Grids by summarising the comparison of the student’s progress via a simple spider chart representation comparing the student’s activities to that of the “Average graduate.” Metrics such as the number of videos watched, timeli-ness and accuracy of quiz submissions and total time on the MOOC platform are displayed for comparison. These details are not broken down by topic, show-ing only overall MOOC activity levels for the student. The results of her study showed a higher rate of engagement in and graduation from the MOOC, but
she could not conclude that learners improved self-regulated learning skills as a result.
INGRID
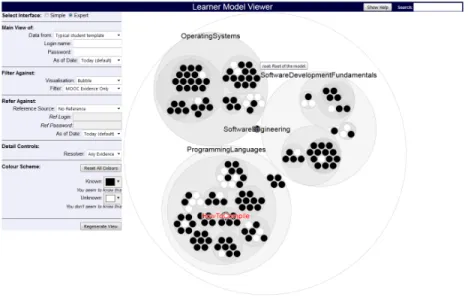
The INGRID system [Conejo et al., 2012] provides a public web service for presentation of user models. User models may be handed off in XML form, after which they are processed to present a visualisation in one of two forms. The first form is a simple tree structure, with only a single branch (plus its “ancestors” and ancestor siblings) displayed at any time. The second format uses a radial sunburst representation. In both forms, colouration of the represented nodes indicates how well known the items on that branch are known. Samples of these, from the paper, are shown in Figure 2.6.
The API used for access to the web service includes hooks for passing data (including change information) back to a contact point supplied in the config-uration XML data, as well as other data which should permit presentation of evidence if properly used.
Each of the two representations has its own strengths and limitations. The “tree” diagram can only show a single path (and siblings at each level) , which can make navigating the full tree difficult; essentially, the visibility it provides is quite limited in scope. In comparison, the “sunburst” representation gives an effective overview, but the amount of data in the user model rapidly becomes unwieldy.
2.1.5
Ontology Visualisation as a Guide to Learner Model
Visualisations
While many different OLM visualisations have been proposed and implemented in the literature, we can also draw on a much richer literature if we take full advantage of the conceptual link betweenontologies andlearner models.
In the earliest history of knowledge representation, ontologies were proposed by Aristotle in his classification of the natural world, extended into a logical tree structure by Porphyry and visually represented in the High Middle Ages. Linnaeus organised life into a logical tree when establishing his taxonomy of species, an idea which was used by Darwin in The Origin of Species [Darwin, 1859] including a diagram representing the branching of species through a tree. However, we are more interested in more recent work in computer-based visualisations of ontological structures.
These include tree and sunburst representations as demonstrated in IN-GRID, but many other visualisations have been proposed and implemented. Many ontology visualisations are designed for a fundamentally static view; oth-ers may be used interactively, but have not been used for representation of learner models.
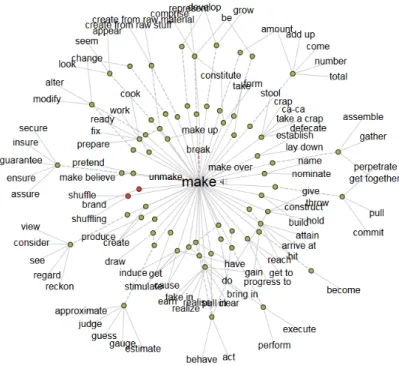
For example, we may look at the “force graph” as used in the online Visual Thesaurus [Thinkmap, 1998-2015] and for which implementations are available in several public libraries including the D3 library [Bostock et al., 2011] used in
Figure 2.6: INGRID tree and sunburst representations of a user model. The tree representation, at top, shows the expansion of one subtree at each level and the truth values of those items. The sunburst shows all elements, but lacks space to show information on each element.
Figure 2.7: Sample view of the Visual Thesaurus
our own implementation. Force Graphs are visually attractive in part due to their dynamism, but this very dynamism makes the representation of a partic-ular structure unstable, making it difficult for the learner to locate and track particular elements. Figure 2.7 demonstrates this with the word “make”, while also demonstrating why the representation is impractical for larger structures.
Another visualisation used is the “icicle” representation, developed by Kruskal et al. in the early 1980s [Kruskal and Landwehr, 1983] where all items are shown hierarchically as rectangles with size proportional to the significance of the the object represented. Figure 2.8 shows a full-tree representation using this method, again using Bostok’s D3 library; this example is sourced from the examples on the D3 web site.
Another readily available visualisation is the hyperbolic tree representation as first designed at Xerox PARC [Lamping et al., 1995]. The example in Fig-ure 2.9 shows FigFig-ure 1 from the original Xerox paper. One may zoom into any particular node which focuses on that part of the tree.
Its most notable problem is the degree to which fine-grained structure is minimised due to being restricted to the diagram’s margins. This is an issue with many visualisations; the smallest components are fundamentally arranged in a single dimension. That dimension may be horizontal or vertical, or along the circumference of a circle, but fundamentally, one dimension is reserved for representation of structure, while another attempts to represent the smallest
Figure 2.8: Sample Icicle plot
Figure 2.10: Sample of a Voronoi Treemap (Figure 10 from [Balzer et al., 2005])
component of the ontology.
However, there are some visualisations which make more extensive use of internal space. The Voronoi treemap, “based on a mathematical segmentation of Euclidean space that dates back to Descartes” [Lima, 2014] was proposed as the basis for visualisation of software metrics by Balzer et al. in 2005 [Balzer et al., 2005] and later re-purposed to represent ontological hierarchies.
Figure 2.10 reproduces Figure 10 from Balzer’s original paper. This structure makes highly efficient use of available space, but in so doing the actual structure being represented is somewhat obfuscated.
A simpler form of treemap is based on rectangular divisions. While simi-lar layouts had been used previously, the modern approach is usually ascribed to Schneiderman et al. [Shneiderman, 1992] with later extensive refinements. Figure 2.11 shows an example of this layout in representing disk usage in the freeware programWinDirStat.
This shares the problem of the Voronoi treemap: while space is used very efficiently, structure is obfuscated by the dense packing used.
Finally we examine the “Circular Treemap.” It appears that while these were first implemented by Kai Wetzel in an open source implementation, they were
Figure 2.11: Sample of a Rectangular Treemap (here from a disk usage analysis using WinDirStat). Larger blocks represent larger files and directories.
first referenced academically in a review paper concerning the state of the art in treemaps by Schneiderman [Shneiderman and Plaisant, 1998].
As noted by the original author and by Schneiderman’s review paper, circular treemaps are somewhat wasteful of space; as also noted, however, they make structure clearly visible. However, space usage for representing N nodes is still O(√2
N), using internal space much more efficiently than representations with a linear dimension such as simple trees.
Because this format combines relatively efficient use of space (compared to O(N) representations) with clear representation of structure, it was selected as our baseline visualisation for MOOClm. A sample is shown in Figure 2.12.
Readers interested in the field of visualisation of ontologies are referred to Manuel Lima’sThe Book of Trees [Lima, 2014].
Grundy et al. recently reviewed a number of different Open Learner Model visualisations in support of Formative Assessment [Law et al., 2015]. However, while their paper did cover a wide range of alternative visualisations, they lim-ited their analysis to very small-scale models, with only three outcomes shown for most examples. These approaches are of limited utility in examining large open learner models.
2.1.6
Overview of Visualisations
Table 2.1 summarises some of the visualisations covered here and their strengths and shortcomings in terms of those dimensions which are important for this thesis.
Here “Scalable” represents whether the visualisation can display very large learner models (greater than, for example, a hundred entries) effectively. “Com-pare Models” reflects whether the visualisation permits the user to com“Com-pare two
Figure 2.12: Sample of a Circular Treemap (from MOOClm)
different learner models. “Focus on Learning” indicates whether the visualisation provides useful guidance to the student on future learning opportunities.
This overview suggests that a Treemap format with supplemental features to permit comparison of learner models and refer students to learning resources may be helpful. This is because the format is scalable while preserving the model structure. Its shortcomings may be overcome by careful adaptation of the visualisation.
2.2
Computer Science Education
We briefly consider whether the use of computers in education is actually helpful. Several reviews of the literature [Kulik et al., 1980, Kulik and Kulik, 1991] as well as more recent individual studies [Shakibaei et al., 2011] have concluded that learning outcomes are more reliably achieved when computers are included when assembling learning solutions.
2.2.1
Knowledge Levels and the Bloom Taxonomy
A key concepts in education is one of taxonomies of knowledge levels. These differentiate degrees of familiarity with a concept. The most widely used taxon-omy is the Bloom taxontaxon-omy [Bloom and Krathwohl, 1956]. Originally outlined in 1956, it covered 6 terms, from simplest to most complex and from concrete to abstract:
Name # Scalable Learner Model? Compare Models?
Focus on learning?
qv No No No
LOSUM/SIV Somewhat No Yes
Fraction Helper No No Excellent
Mastery Grids No Yes Yes
INGRID Somewhat No No
Force Graph Good, but chaotic and hard to track in-dividual elements
No No
Icicle Medium - linear scaling when expanded No No Rectangular Treemap Good, but structure nonobvious No No Voronoi Treemap Good, but structure nonobvious and
size/shape of elements is inconsistent
No No
Circular Treemap Good, but some wasted space No No
Grundy et al. (various) Poor Yes Yes
Table 2.1: Summary of Visualisations
• Comprehension - Grasp the meaning of a concept
• Application - Being able to use the concept in new situations, without being prompted
• Analysis - Able to break down a problem or communication and identify component parts and their relationships.
• Synthesis - The ability to use the concept to create a new assembly which solves a nontrivial problem.
• Evaluation- Criticism, commentary; the ability to recognise the strengths and weaknesses of a work incorporating the concept.
Each term encapsulates the terms lower in the hierarchy, so understanding at an “Analysis” level is assumed to include understanding at the Application, Comprehension and Knowledge levels as well.
The taxonomy was revised in 2001 [Anderson et al., 2001] and an addi-tional dimension (the “Knowledge Dimension”) added to the existing scale (the “Cognitive Dimension”). The original noun terms were modified to a roughly equivalent scale of verbs: Remember, Understand, Apply, Analyse, Evaluate and Create. It is worth noting that the equivalencies for the last two terms have been exchanged, so “Creat[ion]” (equivalent to Synthesis) is in the new taxonomy regarded as more complex than “Evaluate” or Evaluation. One of the editors later released a much shorter, simpler summary of the changes made [Krathwohl, 2002].
However, despite these revisions, the original Bloom taxonomy remains in much wider use than the revised taxonomy, perhaps due to its familiarity and
widespread use, or perhaps due to confusion from the changes made, particularly the exchange of the two highest levels.
Other taxonomies abound. For example, the neo-Piagetian taxonomy uses only three levels (Pre-Operational, Concrete Operational and Formal Opera-tional) [Lister, 2011] and Ackoff [Ackoff, 2010] describes four (Data, Information, Knowledge, Wisdom). Note Ackoff uses “Knowledge” as the second-highest level whereas under Bloom it is the lowest; the same term is used to label different depths of concept.
These taxonomies are significant in Computer Science Education because they can be used to indicate the depth at which students are expected to know the course material. Each component in the course requirements can indicate not only the basic concept used (such as iteration), but the depth of under-standing with which the student can be expected to use that knowledge.
2.2.2
Pedagogies: Structuring Learning
There is more to the facilitation of learning than a simple knowledge base. One of the key characteristics of education is the pedagogy used. Pedagogy is “the method and practice of teaching, especially as an academic subject or theoretical concept” (OED) If an ontology is the “what”, the pedagogy is the “how.”
Siemens outlines the theory and cognitive basis for much of how the structure of learning is established in the modern, networked environment [Siemens and Baker, 2012]. He describes three core epistemologies and adds a fourth:
1. Behaviourism, which asserts that learning is a “black box” activity, in that we do not know what occurs inside the learner, focuses its efforts on managing external, observable behaviours, and finds much of its existence in objectivism.
2. Cognitivism, which spans a continuum from learning as in-formation processing (a computer model) at one end, to learning as reasoning and thinking on the other, finds much of its identity in pragmatism.
3. Constructivism, which covers a broad spectrum of research overlapping with cognitivism, contends that learning involves each individual learner making sense and constructing knowledge within his or her own context; it finds its foundation in interpretivism.
To the three-fold view of epistemology, Stephen Downes (2006) adds a fourth ... Connectivism posits that knowledge is distributed across networks and the act of learning is largely one of forming a diverse network of connections and recognizing attendant patterns. Of these, the last three form the basis of the most common approaches used by Learning Management systems:
1. Cognitivism forms the basis of the instructivist approach, driven by the largely one-way transfer of knowledge from teacher to student.
Figure 2.13: NSW Department of Education Science and Technology Learning Outcomes
2. Constructivist education focuses on “learning by doing,” with creation be-ing the primary driver for learnbe-ing.
3. Connectivist education make a knowledge base available then encourages students to learn from the knowledge base in collaboration with each other, often with teachers available as an additional resource for information outside of the provided knowledge base.
In practice, most Learning Management Systems use a combination of methods. While the EdX MOOC is nominally instructivist in approach, for example, it includes a forum discussion board system to facilitate connectivist learning.
2.2.3
Course Design Software and ProGoSS
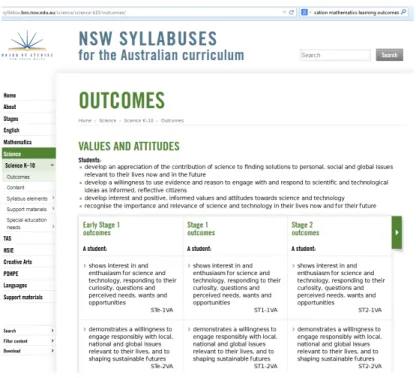
Part of the evolution of the educational process in recent years has been the increasing formalisation of learning outcomes. It is now commonplace for a curriculum to include a list of desired learning outcomes. For example, if one seeks to discover the learning outcomes for the NSW Department of Educa-tion Science and Technology curriculum, they can be found quite easily [NSW Department of Education, 2014] as in Figure 2.13.
However, while modern courses and their assessments are typically modeled quite closely on a curriculum and its listed learning outcomes, feedback from
Figure 2.14: Moodle Learning Outcomes - Course Summary
the assessment process to the course designer is often minimal. Assessments are modeled after learning outcomes, but the mechanisms in place to determine whether those learning outcomes are being met by the course may be absent.
Essentially, what is needed is a feedback mechanism to provide assurance that assessment results actually indicate that learning objectives are met. We wish to avoid those cases where knowledge is either taught or assessed incor-rectly, then that fault missed because the failure is lost against the background of successful results.
Linking learner outcomes to learner management systems is not a new idea. Vandepitte at al [Vandepitte et al., 2003] describe the process of linking a Learner Course Management System (Ariadne) with a Learner Management system (Blackboard). The Moodle LMS, also used as a MOOC, tracks learn-ing outcomes as well, but while it does track assessment results, it does not permit assessment to specify the knowledge (Bloom) level at which a question was answered. Each outcome is graded as to how well the course cohort knows that outcome, but a single-number, linear scale is used. Figure 2.14 shows an example from Moodle’s demonstration site.
Richard Gluga’s PhD thesis [Gluga, 2013] and a number of foreshadowing papers [Gluga et al., 2012, 2013] describe ProGoSS, which tracks Program Goal progeSSion of a course. This is done, firstly, by setting up a number of learning goals and levels (for example, learning the concept of iteration at the Bloom “Understanding” level), then by indicating which parts of the different assess-ment exercises in a course test which parts of the knowledge base. Different taxonomies may be selected for each Learning Outcome, so the course designer may choose to assess learning in terms of using the Bloom, revised Bloom, neo-Piagetian or any other selected taxonomy. Figure 2.15 shows the assess-ment form for the final exam for one course. Figure 2.16 shows how learning
Figure 2.15: List of Assessment Questions for an exam as represented in Pro-GoSS
outcomes are specified for a particular question.
In so doing, ProGoSS establishes a formalism which tests the effectiveness of a course in teaching its material at a “bare pass” and “top performer” level, with each learning outcome assessed not only in terms of gross success level, but also at the depth with which each outcome was learnt. Figure 2.17 shows ProGoSS’ summary of selected outcomes across a class.
ProGoSS also includes a module to test and advise assessor expertise in determining the Bloom (or neo-Piagetian) level at which an assessment exer-cise is aimed. In so doing, inaccuracies in testing course progression may also be reduced in the manner in which they are defined as well as in how they are assessed. However, this capability is not of primary interest for our pur-poses. What is useful in ProGoSS for our purposes is the ability to link learning outcomes and types to course elements. This mapping is potentially useful in establishing the learning outcomes for elements of a MOOC course.
2.2.4
The ACM CS2013 Model Curriculum
Many online courses teach fundamentally the same things, but present material in a different order. This makes cross-comparison of student objectives between courses more difficult. The obvious response to this is to map the course on-tology (the material taught by the course) to a common reference framework.
Figure 2.16: Assessed Topics for a question in ProGoSS, including topic names, descriptions, Bloom levels and the confidence level from which a learning out-come may be concluded
Many formalised courses already do this as a first step towards professional certification.
One of the basic ideas followed in our implementation is to build our ontol-ogy on the basis of a common reference framework so that all courses can be represented with a common, widely accepted set of learning outcomes. For our purposes we use the recent final publication revision of the ACM CS2013 Cur-riculum Guidelines for Undergraduate Degree Programs in Computer Science [ACM Joint Task Force, 2013]. However, it rapidly became clear when attempt-ing to map this against the course beattempt-ing used for comparison that the ACM curriculum contains a number of (probably deliberate) blind spots. In partic-ular, the curriculum is almost entirely language- and environment-agnostic. A learning outcome will address the concept of iteration and looping, but does not explicitly tie this to the for or while loop in C. The curriculum will discuss processes and threads, without referring to how these are handled under UNIX or Windows. Our approach to addressing these issues is discussed in the body of this thesis.
The ACM curriculum does not use Bloom or Piaget in representing knowl-edge levels, although it is loosely based around Bloom, “in part because several [Bloom levels] are driven by pedagogic context... in part because we intend the mastery levels to be indicative and not to impose theoretical constraint on users of this document.” Instead the ACM uses three levels of “mastery.” The first is
Familiarity, understanding of a concept and its meaning. The second isUsage, where “The student is able to use or apply a concept in a concrete way.” The third and final level isAssessment, the ability “to consider a concept from mul-tiple viewpoints and/or justify the selection of a particular approach to solve a problem.” (Ibid, page 34)
The mismatch in representation of mastery levels (for example, between Bloom and ACM representtaions) may introduce issues with cross-comparability of learning outcomes. If a course designer has designed the course learner out-comes around the Bloom taxonomy, determining whether those course objectives - as mapped in the ACM represemntation - corresponding to those learner out-comes has been met is made correspondingly more difficult. There is no clear, one-to-one, bidirectional mapping between the two taxonomies.
2.3
Massively Open Online Courses
Massively Open Online Courses, or MOOCs, are a relatively recent development. “A MOOC is an online course with the option of free and open registration, a publicly shared curriculum, and open - ended outcomes.” [McAuley et al., 2010] McAuley goes on to describe the general characteristics of a MOOC:
An online phenomenon gathering momentum over the past two years or so, a MOOC integrates the connectivity of social network-ing, the facilitation of an acknowledged expert in a field of study, and a collection of freely accessible online resources. Perhaps most importantly, however, a MOOC builds on the active engagement
of several hundred to several thousand “students” who self-organize their participation according to learning goals, prior knowledge and skills, and common interests. Although it may share in some of the conventions of an ordinary course, such as a predefined timeline and weekly topics for consideration, a MOOC generally carries no fees, no prerequisites other than Internet access and interest, no pre-defined expectations for participation, and no formal accreditation. (Ibid, page 4)
MOOCs present formal course materials to any individuals who want to use them, to encourage learning outside of a formalised environment. Because they are designed to support large cohorts of students, their design supports evalua-tion performed either by automated systems or by peer group.
MOOCs are an evolution of earlier automated tutoring systems that were frequently based on presenting material to much smaller class groups, known at the time as Asynchronous Learning Networks (ALNs) [Hiltz, 1998]. These persist today in the form of Learner Management Systems such as Moodle and Blackboard. The more modern systems typically include additional refinements to encourage the learning process by social participation and increasing the learner’s stake in the course by mechanisms such as peer assessment. MOOCs themselves are a fairly recent phenomenon, only appearing under that name since around 2007.
2.3.1
Types of MOOC
Siemens [Siemens, 2013] groups MOOCs into three categories. These are xMOOCs, cMOOCs and quasi-MOOCs. Lisa Lane [Lane, 2012] suggests addition of an-other category, for “Task Based” or constructionist MOOCs. The differences between these largely concern their choice of pedagogy.
The first category is that of cMOOCs, such as Downes’ and Siemens’ CCK08 [Siemens and Downes, 2008]. “cMOOCs are based on a connectivist pedagogical model that views knowledge as a networked state and learning as the process of generating those networks and adding and pruning connections.” [Siemens, 2013] cMOOCs emphasise networking and student collaboration as a pathway to learning. Students are not simply learners, but are expected to be co-teachers, assisting and mentoring each other and exploring the knowledge space of the course in order to gain a deeper understanding of the material. These MOOCs strongly encourage student collaboration in solution of exercises and coverage of material.
Rather than being centred on course material, a cMOOC is centred on the communications channels of the student. This approach is especially well suited to courses using peer assessment for student exercises.
The second type of MOOC is the xMOOC, such as most edX MOOCs [Bres-low et al., 2013] and Coursera, which fol[Bres-low a more traditional structure of “teacher as expert” and “learner as knowledge consumer” [Siemens, 2013]. A typical “xMOOC” such as edX [Breslow et al., 2013] places copies of lectures and
course material on site, usually (but no