Early Cretaceous lineages of monocot
flowering plants
Kåre Bremer*
Department of Systematic Botany, Evolutionary Biology Centre, Uppsala University, Norbyva¨gen 18D, SE-752 36 Uppsala, Sweden Edited by Peter H. Raven, Missouri Botanical Garden, St. Louis, MO, and approved February 14, 2000 (received for review October 1, 1999) The phylogeny of flowering plants is now rapidly being disclosed
by analysis of DNA sequence data, and currently, many Cretaceous fossils of flowering plants are being described. Combining molec-ular phylogenies with reference fossils of known minimum age makes it possible to date the nodes of the phylogenetic tree. The dating may be done by counting inferred changes in sequenced genes along the branches of the phylogeny and calculating change rates by using the reference fossils. Plastid DNArbcLsequences and eight reference fossils indicate that⬇14 of the extant monocot lineages may have diverged from each other during the Early Cretaceous>100 million years B.P. The lineages are very different in size and geographical distribution and provide perspective on flowering plant evolution.
D
uring the last 10 years, there has been a tremendous increase in our knowledge of flowering plant evolution. Many Cre-taceous fossils of various groups of flowering plants have been discovered and described (1–3), and the major branching pattern of the flowering plant phylogeny has been disclosed from cladistic analysis of molecular data (4–6). Combining the in-creasing information on fossils with the currently available molecular phylogenies opens up the possibility of dating the entire phylogeny of flowering plants. The major diversification of the flowering plants took place during the Early Cretaceous (2, 3), and with dated phylogenies, the extant lineages that survived from this period [⬎100 million years (Myr) B.P.] may now be characterized. Such entities of similar age are more relevant units of comparison in evolutionary biology and his-torical biogeography than the orders and families of current classification.Monocots comprise one-fourth of all flowering plants and include such familiar groups as lilies, orchids, palms, and perhaps the ecologically (grasslands) and economically (cereals) most important of all plant families, the grasses (Poaceae). A strongly supported phylogeny of monocots based on analysis of three genes is now available (6, 7), and there are sequences from the plastid DNA generbcLfrom all but a few of the⬇100 families of monocots. Several monocot fossils assignable to family or order are known from the Late Cretaceous (8–14). From these data, 14 lineages of monocot flowering plants are tentatively hypothesized herein to date back to the Early Cretaceous.
All dating methods based on molecular data involve some kind of molecular clock assumption (15) despite the fact that substi-tution rates are known to vary in different lineages (16, 17). In monocots, plastid DNA substitution rates have been shown to decrease in the order grasses-orchids-lilies-bromeliads-palms (18, 19). Several methods have been devised to deal with such rate variation and the problems of clock-based dating (20). One approach is to remove lineages and species showing significantly different rates until remaining lineages pass a relative-rate test (21). Another approach, also followed herein, is to allow for different rates in different parts of the tree. Sanderson (22) developed this approach even further, allowing for different rates among all of the branches of the tree, under the assumption that such differences are small between adjacent branches. There are, however, no real data or analysis of branch lengths sup-porting this assumption. Sanderson’s method is also
computa-tionally complex and not feasible for dating large trees with several reference fossils.
Herein, the focus is on divergence times for the basal nodes of the monocot phylogeny, and any precision in dating the upper nodes of the tree is not attempted. To this end, mean branch lengths from the terminals to the basal nodes of the tree are calculated. Unequal rates in different lineages are manifested as unequal branch lengths counting from the root to the terminals in phylogenetic trees, and the procedure of calculating mean branch lengths reduces the problem of unequal rates toward the base of the tree. Dating is done with a set of Cretaceous monocot fossils that may be attached to the nodes of the tree, and confidence intervals on the age estimates are calculated from the variation in branch lengths.
Materials and Methods
DNA sequences of therbcLgene were obtained from GenBank or by sequencing material from the herbarium at Uppsala University. Eight sequences were generated for this study for terminals 2, 30, 32, 62, 64, 80, 83, and 87 as listed in Fig. 1. Sequencing procedures have been described elsewhere (23). GenBank accession numbers are given in the legend to Fig. 1. Alignment is straightforward and involves no indels. The data matrix of aligned sequences is available on request. A general outline of the phylogeny of monocots was obtained from pub-lished analyses based on three genes providing strong support for the major clades (6, 7). Complete resolution was attained by parsimony analysis (24) of therbcLsequences with major clades constrained if supported also by the other data (4–7). The topology is seen in Fig. 1. Alternative equally parsimonious trees involve rearrangements mainly within some of the major groups and do not influence the conclusions on Early Cretaceous clades. Branch lengths (not shown in Fig. 1) were obtained by optimi-zation of therbcL data on the tree. Alternative optimization strategies (24) affect branch lengths and rate calibrations but have a negligible effect on the final age estimates.
The fossil record of monocots was surveyed, and all Creta-ceous fossils of monocots that safely can be attached to the phylogenetic tree in Fig. 1 are listed in Table 1. Tertiary fossils were not included, because their meaningful use as reference fossils for the phylogenetic tree in Fig. 1 would necessitate a much larger sample of terminals with several representatives from each family. The fossils provide a minimum age for the nodes above which they attach. The mean distance in rbcL nucleotide changes, as expressed by branch lengths, from the terminals to a node divided by its minimum age then provides an This paper was submitted directly (Track II) to the PNAS office.
Abbreviation: Myr, million years.
Data deposition: The sequences reported in this paper have been deposited in the GenBank database (accession nos. are listed in the legend to Fig. 1).
*To whom reprint requests should be addressed. E-mail: [email protected]. The publication costs of this article were defrayed in part by page charge payment. This article must therefore be hereby marked “advertisement” in accordance with 18 U.S.C. §1734 solely to indicate this fact.
Article published online before print:Proc. Natl. Acad. Sci. USA, 10.1073兾pnas.080421597. Article and publication date are at www.pnas.org兾cgi兾doi兾10.1073兾pnas.080421597
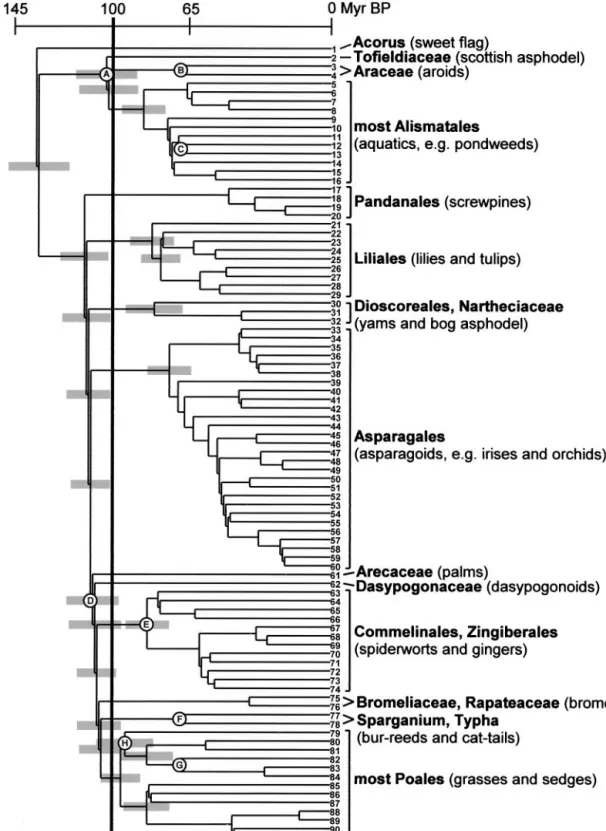
Fig. 1. Phylogeny of monocots with major clades that date back to the Early Cretaceous (⬎100 Myr B.P.). The nodes are arranged approximately by the age estimated from the branch lengths. Reference nodes A–H were used for calculating the change rates. The reference nodes have a minimum age given by the fossils (Table 1), and nodes B, C, F, and G are positioned accordingly. For nodes A, D, E, and H, the estimated age is greater, and they are thus arranged according to the age obtained from the mean branch length (Table 1) divided by the change rate (see text for calculation of change rates: node A 75/0.73⫽103 Myr, node D 85/0.73⫽116 Myr, node E 61/0.73⫽84 Myr, and node H 78/0.83⫽94 Myr). Confidence intervals (95%) for the datings of the basal nodes are indicated by gray bars. For complete circumscriptions of listed taxa see the current classification (6). Terminals are listed below with GenBank accession numbers in parentheses: 1Acorus(M91625), 2Tofieldia(AJ286562), 3Gymnostachys(M91629, Araceae), 4Pistia(M96963, Araceae), 5Hydrocharis(U80701), 6Butomus
(U80685), 7Alisma(L08759), 8Limnocharis(U80717), 9Aponogeton(U80684), 10Scheuchzeria(U03728), 11Posidonia(U80718), 12Cymodocea(U80687), 13
Ruppia(U03729), 14Triglochin(U80714, Juncaginaceae), 15Potamogeton(L08765), 16Zostera(U80734), 17Vellozia(L19970), 18Croomia(D28154, Stemona-ceae), 19Ludovia(L10251, Cyclanthaceae), 20Pandanus(M91632), 21Campynema(Z77264), 22Trillium(D28164, Melanthiaceae), 23Alstroemeria(Z77254), 24
Colchicum(L12673), 25Luzuriaga(Z77300), 26Lilium(L12682), 27Smilax(D28333), 28Philesia(Z77302), 29Ripogonum(Z77309), 30Narthecium(AJ286560), 31
observed change rate in that particular part of the tree (25). For example, for node A (Fig. 1) the mean distance in branch lengths from the node to terminals 2–16 is divided by the age to obtain the change rate 75/69.5⫽1.08 (Table 1).
The different reference fossils provide different change rates; however, if there was no reason to assume any overall differences in observed rates between different parts of the tree (as inves-tigated by ANOVA in branch lengths explained below), a mean change rate was calculated and used for the dating. Because a major source of error in phylogenetic dating is the rate calibra-tions (as discussed below), it is desirable to use a mean rate derived from several reference fossils rather than the individual rates. By dividing the mean distance in nucleotide changes from the terminals to other nodes with the mean change rates, an approximate dating of all of the nodes is possible. Being depen-dent on the species sampled as terminals, this dating is uncertain for upper nodes of the tree but should be more reliable for basal nodes where more terminals contribute to the age estimate.
Unequal branch lengths indicate that unequal rates may have been present. Specifically, if the branch lengths from the root to the terminals differ, as they certainly do, the observed change rates are unequal. ANOVA was used to investigate variation in branch lengths from the root to the terminals among and within the major clades of the phylogenetic tree. The major clades compared were Alismatales (terminals 2–16 in Fig. 1), Panda-nales (terminals 17–20), Liliales (terminals 21–29), Dioscoreales (terminals 30–32), Asparagales (terminals 33–60), commeli-noids (terminals 61–91), Commelinales⫹Zingiberales (termi-nals 63–74), and Poales (termi(termi-nals 79–91). Branch lengths were found to be significantly longer in Commelinales⫹Zingiberales and in Poales. Excluding these two clades, ANOVA found no significant added variation in branch lengths among the major clades (commelinoids then restricted to terminals 61–62 and 75–78 in Fig. 1) compared with the variation detected within the major clades. Because of the significantly longer branch lengths in Commelinales⫹Zingiberales and in Poales, separately
cal-culated change rates were obtained as explained above and used for the node datings within these two clades. Confidence inter-vals (95%) on the node datings were calculated from the variation in branch lengths as⫾ 1.96 standard errors for the mean branch length to the node divided by the change rate. Results
ANOVA found branch lengths to be significantly longer in most of the Poales and in Commelinales⫹Zingiberales than in other monocots. However, with these two clades excluded ANOVA found no significant added variance caused by major clade membership. Because branches were found to be longer in Poales and Commelinales⫹Zingiberales, three mean rates were calculated and used for dating the phylogeny. These rates are (0.53 ⫹ 1.12)/2 ⫽ 0.83 for Poales, 0.73 for Commelinales ⫹ Zingiberales, and (1.08⫹0.71⫹0.53⫹0.95⫹0.37)/5⫽0.73 changes per Myr for the remaining monocots (obtained from the rate column in Table 1). Observed mean rates thus turned out to be the same (0.73) in Commelinales⫹Zingiberales as in the remaining monocots (excluding Poales), despite the overall differences in branch lengths detected by ANOVA.
The datings and confidence intervals are shown in Fig. 1. The figure indicates that 13 nodes (including the root) in the monocot phylogeny are older than 100 Myr, and they lead to 14 clades or lineages of extant monocots that consequently date back to the Early Cretaceous. These are (i)Acorus, the sister group of all other monocots (26), (ii) Tofieldiaceae, (iii) Araceae, (iv) most Alismatales (excluding Araceae and Tofieldiaceae), (v) Panda-nales, (vi) Liliales, (vii) Dioscoreales ⫹ Nartheciaceae, (viii) Asparagales, (ix) Arecaceae, (x) Dasypogonaceae, (xi) Commeli-nales⫹Zingiberales, (xii) Bromeliaceae⫹Rapateaceae, (xiii) Sparganium⫹Typha, and (xiv) most Poales (excluding Sparga-niumandTypha).
Discussion
The rates are based on therbcLnucleotide changes along the branches of the tree as inferred from character optimization in
(Z73702), 38Lanaria(Z77313), 39Tecophilaea(Z73709), 40Doryanthes(Z73697), 41Iris(L05037), 42Ixiolirion(Z73704), 43Xeronema(Z69235), 44Xanthorrhoea
(Z73710), 45Convallaria(D28334), 46Lomandra(L05039, Laxmanniaceae), 47Allium(Z69204), 48Agapanthus(Z69221), 49Amaryllis(Z69219), 50Asphodelus
(Z73682), 51Muilla(Z69213, Themidaceae), 52Scilla(D2816, Hyacinthaceae), 53Anemarrhena(Z77251), 54Aphyllanthes(Z77259), 55Asparagus(L05028), 56
Hemerocallis(L05036), 57Behnia(Z69226), 58Hosta(L10253, Agavaceae), 59Anthericum(Z69225), 60Herreria(Z69230), 61Phoenix(M81814, Arecaceae), 62
Calectasia(AJ286557, Dasypogonaceae), 63Philydrum(U41596), 64Anigozanthes(AJ286556, Hemodoraceae), 65Commelina(L05033), 66Pontederia(U41597), 67Marantochloa(L05453, Marantaceae), 68Canna(L05445), 69Musa(L05455), 70Heliconia(L05451), 71Zingiber(L05465), 72Orchidantha(L05456, Lowiaceae), 73Costus(L05447), 74Strelitzia(L05461), 75Ananas(L19977, Bromeliaceae), 76Stegolepis(L19972, Rapateaceae), 77Sparganium(M91633), 78Typha(L05464), 79Flagellaria(L12678), 80Centrolepis(AJ286558), 81Elegia(L12675, Restionaceae), 82Bambusa(Poaceae) (M91626), 83Ecdeiocolea(AJ286559), 84Joinvillea
(L01471), 85Mayaca(AF036885), 86Eriocaulon(L10252), 87Xyris(AJ286563), 88Thurnia(AF036881), 89Prionium(U49223), 90Cyperus(Y13016), and 91Juncus
(L12681).
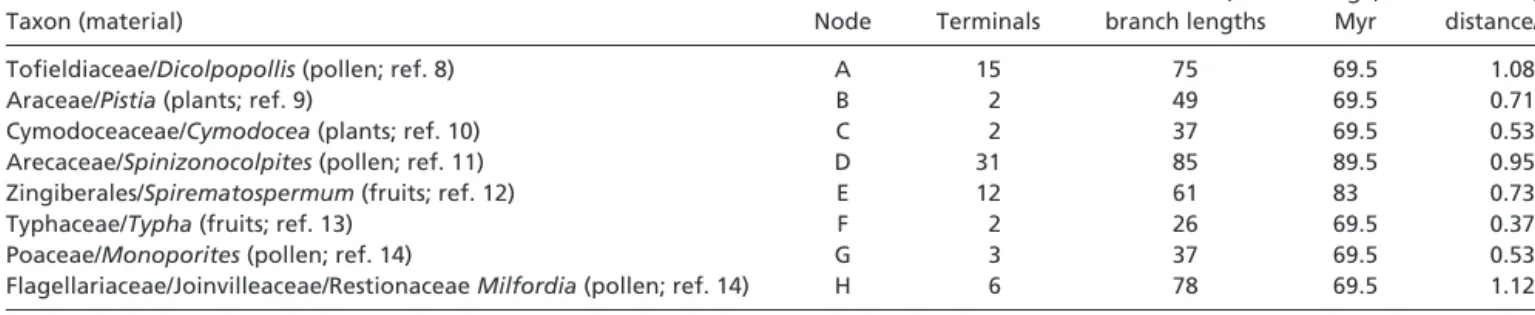
Table 1. Cretaceous monocot fossils
Taxon (material) Node Terminals
Distance, branch lengths Age, Myr Rate, distance/age
Tofieldiaceae/Dicolpopollis(pollen; ref. 8) A 15 75 69.5 1.08
Araceae/Pistia(plants; ref. 9) B 2 49 69.5 0.71
Cymodoceaceae/Cymodocea(plants; ref. 10) C 2 37 69.5 0.53
Arecaceae/Spinizonocolpites(pollen; ref. 11) D 31 85 89.5 0.95
Zingiberales/Spirematospermum(fruits; ref. 12) E 12 61 83 0.73
Typhaceae/Typha(fruits; ref. 13) F 2 26 69.5 0.37
Poaceae/Monoporites(pollen; ref. 14) G 3 37 69.5 0.53
Flagellariaceae/Joinvilleaceae/RestionaceaeMilfordia(pollen; ref. 14) H 6 78 69.5 1.12
Shown are the taxon (material) to which the fossil is assigned, the node above which they attach in the phylogeny of Fig. 1, the number of terminals descended from the node, the mean distance in branch lengths from the terminals to the node, the age of the oldest known fossil in Myr, and the observed change rate (distance/age). Several types of palm pollen (Arecaceae) are known from the Cretaceous, and reliable records have been obtained from the Turonian (89.5 Myr). Zingiberales fruits are from the Santonian–Campanian boundary (83 Myr). The other fossils are all from the Maastrichtian, without any more precise dating, and the age is thus set to mid Maastrichtian (69.5 Myr). There is a recent report (1) of a 90-Myr-old fossil of Triuridaceae, but this family lacks therbcLgene; this family is thus not represented in the phylogeny of Fig. 1, and the assignment to family requires further consideration (E. M. Friis, personal communication).
parsimony analysis and should and need not be taken as esti-mates of the real substitution rates. The dating method is not based on mean distances between pairs of sequences (27–29) but on mean branch lengths from the terminals to the nodes of a specific phylogeny. Attaching fossils to nodes of the phylogeny allows for calculation of change rates along the branches and dating the phylogeny, thereby bypassing pairwise sequence com-parisons and estimates of real substitution rates.
Rate calibration is probably a much greater problem in molecular clock dating than are unequal rates. The issue has not received much attention (20) and frequently only single or few fossils and reference nodes are used. Uncertain dating of the reference nodes rather than unequal substitution rates is prob-ably the reason behind the discrepancies in earlier estimates of monocot and flowering plant origin (27–29). In these earlier studies, single or few reference nodes of rather uncertain age were used, for example 50–70 Myr for a maize-wheat divergence (27) or around 1,000 Myr for a plants-animals-yeast divergence (28). Herein, several fossils have been used to alleviate this problem. Because the focus of this analysis is on the boundary between Early and Late Cretaceous, an attempt was made to include all known Cretaceous monocot fossils (Table 1) that can be attached to the phylogeny of Fig. 1.
The observed change rates for the monocot phylogeny in Fig. 1 vary from 0.37 to 1.12 changes per Myr for the wholerbcLgene (Table 1). It seems that the variation in rates stems mainly from error sources in rate calibration rather than underlying ences in real substitution rates, although there is such a differ-ence between the Poales and other monocots. The variation may be due to inadequate sampling of terminals (partly inevitable because of extinction) leading to short branch lengths and low rates or inadequate sampling of fossils (inevitable because of incomplete preservation and discovery) leading to underesti-mated node ages and high rates.
The split between Acorus and the remaining monocots is estimated to be more than 134 Myr old, near the Jurassic– Cretaceous boundary (145 Myr). This result is in agreement with Sanderson’s (22) dating of the split between Araceae (Spathiphyllum) and other monocots to the Jurassic–Cretaceous boundary in his analysis of land plant divergences. The result is also compatible with the estimate of the monocot–dicot diver-gence to 200⫾40 Myr ago made by Wolfeet al. (27), if it is assumed that at least 160 ⫺ 134 ⫽ 26 Myr passed between monocot origin (at least 160 Myr) and the split betweenAcorus and other monocots (134 Myr).
The list of 14 clades identified herein should be taken as a first hypothesis. As seen from the confidence intervals (Fig. 1), there are uncertainties regarding the number of Early Creta-ceous clades particularly within Alismatales and Poales. Sev-eral of the 14 lineages may be slightly younger than 100 Myr. On the other hand, there are some clades within the Poales that could be more than 100 Myr considering the confidence limits, although the dating indicates that they are younger. A more robust hypothesis will eventually be obtained by adding se-quences from more genes and more terminals. There are a few
monocot families not represented in the phylogeny of Fig. 1 and not assigned to any order in the current classification (6), and they may attach at nodes around 100 Myr old. Near-parsimonious alternatives indicate that some of the Early Cretaceous clades may consist of two such clades more than 100 Myr old. Hence, it could be that the number of Early Cretaceous monocot clades approaches 20, given that the change rates calculated herein are not too misleading. Inter-estingly, the rate for monocots excluding Poales (0.73) is close to that found with the same approach in a different group of flowering plants, the Asterales (0.74; ref. 25).
The largest known clade of flowering plants is the eudicots. They have some families with an Early Cretaceous fossil record (30, 31), and clearly there are many clades of eudicots more than 100 Myr old. Preliminary calculations indicate that there may be more than twice as many as for the monocots. Phylogenetically basal flowering plants (magnoliids, neither monocots nor eud-icots) comprise 15 more or less isolated orders and families not assigned to order (6). There are several Early Cretaceous fossils (2, 3), and it is likely that each of these 15 groups dates back to the Early Cretaceous; thus, the number of Early Cretaceous clades seems to be about the same as for the monocots. In all, it seems that the number of flowering plant clades that survived from the Early Cretaceous is more than 50 but less than 100. Identification of those Early Cretaceous clades is an exciting new goal for plant systematics.
Phylogenetic dating provides a new perspective on flowering plant evolution. The clades that survived from the period of early flowering plant diversification during the Early Cretaceous⬎100 Myr ago are not the same as those recognized as families, orders, etc. in plant classification (6). A brief look at the 14 Early Cretaceous clades of monocots listed herein indicates how different they may be. Most contain more than 1,000 species and are pantropical or worldwide but with very different distribution patterns. Asparagales include the orchids and comprise perhaps 25,000 species; the Poales comprise around 20,000 species. There are, however, only about 25 species of Tofieldiaceae and of SparganiumandTypha. Some of the clades consist of only a few species: there are two species of Acorusin the northern hemi-sphere and eight species of Dasypogonaceae, all in Australia. Although present distributions may be very different from those of the Cretaceous, such 100-Myr-old clades with restricted distributions and with no fossils found elsewhere may represent ancient Laurasian and Gondwanan elements and exemplify how we may be able to discover old patterns of historical biogeography.
I thank Birgitta Bremer for access to lab facilities, Nahid Heidari for sequencing several monocots, Else Marie Friis for critical evaluation of the fossil reports, Bengt Oxelman for ANOVA calculations, Tom Britton for methods of computation of confidence intervals, Sten Kaijser for various advice on statistics, and Mark W. Chase, Michael J. Sanderson, and two anonymous reviewers for comments on earlier versions of the text. The research was supported by the Swedish Natural Science Research Council.
1. Gandolfo, M. A., Nixon, K. C., Crepet, W. L., Stevenson, D. W. & Friis, E. M. (1998)Nature (London)394,532–533.
2. Crane, P. R., Friis, E. M. & Pedersen, K. R. (1995)Nature (London)374,27–33. 3. Crane, P. R., Friis, E. M. & Pedersen, K. R. (1994)Plant Syst. Evol. Suppl.8,
51–72.
4. Ka¨llersjo¨, M., Farris, J. S., Chase, M. W., Bremer, B., Fay, M. F., Humphries, C. J., Petersen, G., Seberg, O. & Bremer, K. (1998)Plant Syst. Evol.213,259–287. 5. Soltis, D. E., Soltis, P. S., Mort, M. E., Chase, M. W., Savolainen, V., Hoot, S. B.
& Morton, C. M. (1998)Syst. Biol.47,32–42.
6. Angiosperm Phylogeny Group (1998)Ann. Mo. Bot. Gard.85,531–553. 7. Chase, M. W., Soltis, D. E., Soltis, P. S., Rudall, P. J., Fay, M. F., Hahn, W. H.,
Sullivan, S., Joseph, J., Molvray, M., Kores, P. J.,et al. (2000) inMonocots: Systematics and Evolution. Vol. 1 of Proceedings of the Second International
Conference on the Comparative Biology of Monocotyledons, eds. Wilson, K. L. & Morrison, D. A. (CSIRO, Melbourne), in press.
8. Chmura, C. A. (1973)Palaeontogr. Abteilung B Pala¨ophytol.141,89–171. 9. Hickey, L. H. (1991)Am. J. Bot.78,Suppl. 115, 6.
10. Voight, E. (1981) inRecent and Fossil Bryozoa, eds. Larwood, G. P. & Nielsen, C. (Olsen & Olsen, Fredensborg, Denmark), pp. 281–298.
11. Harley, M. M. (1996) Dissertation (Royal Botanic Gardens, Kew, U.K.). 12. Rodrı´guez-de la Rosa, R. A. & Cevallos-Ferriz, S. R. S. (1994)Int. J. Plant Sci.
155,786–805.
13. Knobloch, E. & Mai, D. H. (1986)Rozpr. Ustred. Ustavu Geol.47,1–219. 14. Linder, H. P. (1987)Kew Bull.42,297–318.
15. Zuckerkandl, E. & Pauling, L. (1965) inEvolutionary Divergence and Conver-gence, eds. Bryson, V. & Vogel, H. J. (Academic, New York), pp. 97–166.
16. Bousquet, J., Strauss, S. H., Doerksen, A. D. & Price, R. A. (1992)Proc. Natl. Acad. Sci. USA89,7844–7848.
17. Gaut, B. S., Muse, S. V. & Clegg, M. T. (1993)Mol. Phylogenet. Evol.2,89–96. 18. Wilson, M. A., Gaut, B. & Clegg, M. T. (1990)Mol. Biol. Evol.7,303–314. 19. Gaut, B. S., Muse, S. V., Clark, W. D. & Clegg, M. T. (1992)J. Mol. Evol.35,
292–303.
20. Sanderson, M. J. (1998) inMolecular Systematics of Plants II DNA Sequencing, eds. Soltis, D. E., Soltis, P. S. & Doyle, J. J. (Kluwer, Boston), pp. 242–264. 21. Takezaki, N., Rzhetsky, A. & Nei, M. (1995)Mol. Biol. Evol.12,823–833. 22. Sanderson, M. J. (1997)Mol. Biol. Evol.14,1218–1231.
23. Kårehed, J., Lundberg, J., Bremer, B. & Bremer, K. (2000)Syst. Bot. 24,
660–682.
24. Swofford, D. L. (1993)PAUP, Phylogenetic Analysis Using Parsimony (Illinois Natural History Survey, Champaign, IL), Version 3.1.1.
25. Bremer, K. & Gustafsson, M. H. G. (1997)Proc. Natl. Acad. Sci. USA94,
9188–9190.
26. Duvall, M. R., Clegg, M. T., Chase, M. W., Clark, W. D., Kress, W. J., Hills, H. G., Eguiarte, L., Smith, J. F., Gaut, B. S., Zimmer, E. A.,et al. (1993)Ann. Mo. Bot. Gard.80,607–619.
27. Wolfe, K. H., Gouy, M., Yang, Y.-W., Sharp, P. M. & Li, W.-H. (1989)Proc. Natl. Acad. Sci. USA86,6201–6205.
28. Martin, W., Gierl, A. & Saedler, H. (1989)Nature (London)339,46–48. 29. Martin, W., Lydiate, D., Brinkmann, H., Forkmann, G., Saedler, H. & Cerff,
R. (1993)Mol. Biol. Evol.10,140–162.
30. Drinnan, A. N., Crane, P. R., Friis, E. M. & Pedersen, K. R. (1991)Am. J. Bot.
78,153–176.
31. Crane, P. R., Pedersen, K. R., Friis, E. M. & Drinnan, A. N. (1993)Syst. Bot.
18,328–344.