A framework for the integration of green and lean six sigma for
superior sustainability performance
Item type
Article
Authors
Benhida, Khalid; Garza-Reyes, Jose Arturo; Govindan,
Kannan; Elfezazi, Said; Cherrafi, Anass; Mokhlis, Ahmed
Citation
Cherrafi, A. et al. (2016) 'A framework for the integration
of green and lean six sigma for superior sustainability
performance', International Journal of Production Research,
DOI: 10.1080/00207543.2016.1266406
DOI
10.1080/00207543.2016.1266406
Publisher
Taylor and Francis
Journal
International Journal of Production Research
Downloaded
13-Jan-2019 02:53:30
For Peer Review Only
A Framework for the Integration of Green and Lean Six Sigma for
Superior Sustainability Performance
Anass Cherrafi a*, Said Elfezazi a, Kannan Govindan b, Jose Arturo Garza-Reyesc, Khalid Benhida a and Ahmed Mokhlis a
a Cadi Ayyad University, Av. Abdelkrim Khattabi, B.P. 511 - 40000- Marrakech - Safi, Morocco. b
Center for Sustainable Engineering Operations Management, Department of Technology and Innovation, University of Southern Denmark , Campusvej 55, DK-5230 Odense M, Denmark.
c
Derby Business School, The University of Derby, Kedleston Road Campus, Derby, DE22 1GB, UK.
*Corresponding author. Tel.: +212 6 59 34 09 44.
E-mail addresses: [email protected] (a. Cherrafi).
2 3 4 5 6 7 8 9 10 11 12 13 14 15 16 17 18 19 20 21 22 23 24 25 26 27 28 29 30 31 32 33 34 35 36 37 38 39 40 41 42 43 44 45 46 47 48 49 50 51 52 53 54 55 56 57 58 59
For Peer Review Only
A Framework for the Integration of Green and Lean Six Sigma for
Superior Sustainability Performance
Anass Cherrafi a*, Said Elfezazi a, Kannan Govindan b, Jose Arturo Garza-Reyesc, Khalid Benhida a and Ahmed Mokhlis a
a
Cadi Ayyad University, Av. Abdelkrim Khattabi, B.P. 511 - 40000- Marrakech - Safi, Morocco.
b
Center for Sustainable Engineering Operations Management, Department of Technology and Innovation, University of Southern Denmark , Campusvej 55, DK-5230 Odense M, Denmark.
cDerby Business School, The University of Derby, Kedleston Road Campus, Derby, DE22 1GB, UK.
Abstract
Evidence suggests that Lean, Six Sigma and Green approaches make a positive contribution to the economic, social and environmental (i.e. sustainability) performance of organizations. However, evidence also suggests that organizations have found their integration and implementation challenging. The purpose of this research is therefore to present a framework that methodically guides companies through a five stages and sixteen steps process to effectively integrate and implement the Green, Lean and Six Sigma approaches to improve their sustainability performance. To achieve this, a critical review of the existing literature in the subject area was conducted to build a research gap, and subsequently develop the methodological framework proposed. The paper presents the results from the application of the proposed framework in four organizations with different sizes and operating in a diverse range of industries. The results showed that the integration of Lean Six Sigma and Green helped the organizations to averagely reduce their resources consumption from 20% to 40% and minimize the cost of energy and mass streams by 7-12%. The application of the framework should be gradual, the companies should assess their weaknesses and strengths, set priorities, and identify goals for successful implementation. This paper is one of the very first researches that presents a framework to integrate Green and Lean Six Sigma at a factory level, and hence offers the potential to be expanded to multiple factories or even supply chains.
Keywords: Lean; Six Sigma; Green operations; Sustainability; Framework.
*
Corresponding author. Tel.: +212 6 59 34 09 44.
E-mail addresses: [email protected] (a. Cherrafi). 2 3 4 5 6 7 8 9 10 11 12 13 14 15 16 17 18 19 20 21 22 23 24 25 26 27 28 29 30 31 32 33 34 35 36 37 38 39 40 41 42 43 44 45 46 47 48 49 50 51 52 53 54 55 56 57 58 59
For Peer Review Only
1. Introduction
Recently, with the rise of operations, environmental, social and quality improvement methodologies such as Lean, Six Sigma, Green operations (hereinafter Green), among others, and the increasing concerns for the environment and social responsibility, the market dynamics have changed (Garza-Reyes 2015a). Traditionally, production efficiency and profitability, and later quality, flexibility, and customer satisfaction emerged as new competitive criteria (Garza-Reyes 2015a; Green et al. 2012). However, with the growing pressure from various stakeholders to improve social and environmental performance, organizations have now been forced to change their approaches to managing processes and operations (Wong and Wong 2014; Garza-Reyes 2015a; McCarty et al. 2011). According to Bergmiller and McCright (2009), the three dimensions of sustainability (economic, social, and environmental) need to be taken into consideration by organizations to keep their competitive edge. In this scenario, the challenge for organizations is to meet all their stakeholders’ needs through attaining positive economic performance while finding the right balance among the triple bottom line of sustainability (Alves and Alves 2015; McCarty et al. 2011).
To this end, Lean and Green have emerged as major parts of the sustainability answer (Cherrafi et al. 2016a). The combination of Lean and Green seems natural (Garza-Reyes 2015a), and is evident in the academic literature (Franchetti et al. 2009; Carvalho and Cruz-Machado 2009; Bergmiller and Mccright 2009; Martínez-Jurado and Moyano-Fuentes 2013; Dües et al. 2013; Hajmohammad et al. 2013; King and Lenox 2001; Kleindorfer et al. 2005). Researches have discussed and investigated the relationship between Lean and Green by highlighting the divergences and synergies between the two (Bergmiller and Mccright 2009; Carvalho and Cruz-Machado 2009), possible benefits of their integration in different contexts (King and Lenox 2001; Franchetti et al. 2009), their impact on organization’s performance, and their theoretical integration (Bergmiller and Mccright 2009; Kleindorfer et al. 2005; Cherrafi et al. 2016a). In a more recent research, Cherrafi et al. (2016a) and Garza-Reyes (2015b) conducted an extensive literature review on the relationship between Lean and Green. From these researches it is possible to conclude that:
1. Companies that are Lean can simply integrate Green practices, and consequently improve their sustainable performance (Pampanelli et al. 2014; Dües et al. 2012; Hajmohammad et al. 2013; Carvalho and Cruz–Machado 2009; Mollenkopf et al. 2010).
2. There is an intrinsic relationship between Lean and Green initiatives (Franchetti et al. 2009; Ng et al. 2015; Dües et al. 2013).
2 3 4 5 6 7 8 9 10 11 12 13 14 15 16 17 18 19 20 21 22 23 24 25 26 27 28 29 30 31 32 33 34 35 36 37 38 39 40 41 42 43 44 45 46 47 48 49 50 51 52 53 54 55 56 57 58 59
For Peer Review Only
3. Lean is successful when used for reducing environmental and social impacts (EPA 2006; EPA 2003; Franchetti et al. 2009; Chiarini 2014; Langenwalter 2006).
4. The integration of Green and Lean strategies benefits firms (EPA 2009; King and Lenox 2001; Bergmiller and McCright 2009; Dües et al. 2013; Carvalho and Cruz– Machado 2009; Hajmohammad et al. 2013).
5. The integration of Green and Lean strategies can have a more important, positive impact on the bottom–line performance when implemented together (Cabral et al. 2012; Carvalho and Cruz-Machado 2009; Bergmiller and McCright 2009; Kleindorfer et al. 2005).
As a result, a number of frameworks have been proposed to integrate Green and Lean. However, evidence indicates that the integration of the two strategies may have inherited the same limitations as the individual Green and Lean approaches, but that these may be overcame through the integration of Six Sigma (Garza-Reyes 2015a). Green, Lean and Six Sigma are three strategies that are compatible and complementary; thus, each strategy has the capacity to reduce the shortcomings of the others (Garza-Reyes 2015a; Banawi 2014). Lean is characterized by its ability to identify and eliminate waste (Klotz et al. 2007), but it does not take into consideration environmental impacts (EPA 2006; Pampanelli 2014). Hence, organizations have implemented Green to fill this gap (Sharrard et al. 2008; Ng et al. 2015; Li et al. 2010). Later, studies have proposed to integrate Green and Lean in order to reduce environmental wastes, but their integration has not helped organizations to achieve peak sustainability performance. Six Sigma has the capacity to address this gap (Garza-Reyes 2015a; Banawi 2014; Han et al. 2008). It offers a rigorous and disciplined structure for executing problem solving and improvement initiatives (Garza-Reyes, 2015a). In this context, the use of the DMAIC (define-measure-analyze-improve) model can provide Green Lean with a more specific and holistic project-based orientation to the implementation of Green Lean initiatives. In addition, according to Garza-Reyes (2015a), the systematic, data- and statistical-driven characteristic of Six Sigma can complement the Green Lean approach and contribute in overcoming the limitations and challenges of this concept. Despite the encouraging results shown by integrating Green and Lean Six Sigma, we reveal various challenges faced by organizations during the implementation of these initiatives. Thus, the key challenge is how to effectively integrate the two strategies. Moreover, until now, a generic framework to integrate Lean, Green and Six Sigma to guide companies of any industrial sector and size to improve their sustainability performance has not yet been proposed. Consequently, a contemporary research problem in the area of Green Lean Six 2 3 4 5 6 7 8 9 10 11 12 13 14 15 16 17 18 19 20 21 22 23 24 25 26 27 28 29 30 31 32 33 34 35 36 37 38 39 40 41 42 43 44 45 46 47 48 49 50 51 52 53 54 55 56 57 58 59
For Peer Review Only
Sigma (GL2S) is to effectively integrate and implement Green and Lean Six Sigma in companies with different processes and organizational cultures. Another important question is how to take into consideration project management aspects such as stakeholders’ requirements, monitoring and controlling, and knowledge management while integrating Green and Lean Six Sigma. Therefore, the purpose of this work is to:
1. Develop a framework, called the GL2S Framework, which aims to increase productivity in the consumption of resources and reduce environmental and social impacts;
2. Explain the transformation process and the adequate steps for implementing this framework in a practical and easy manner in order to help organizations achieve sustainability;
3. Demonstrate that this framework can be implemented by any type of organization and can reduce costs and improve environmental and social performance.
2. Literature review and research gap
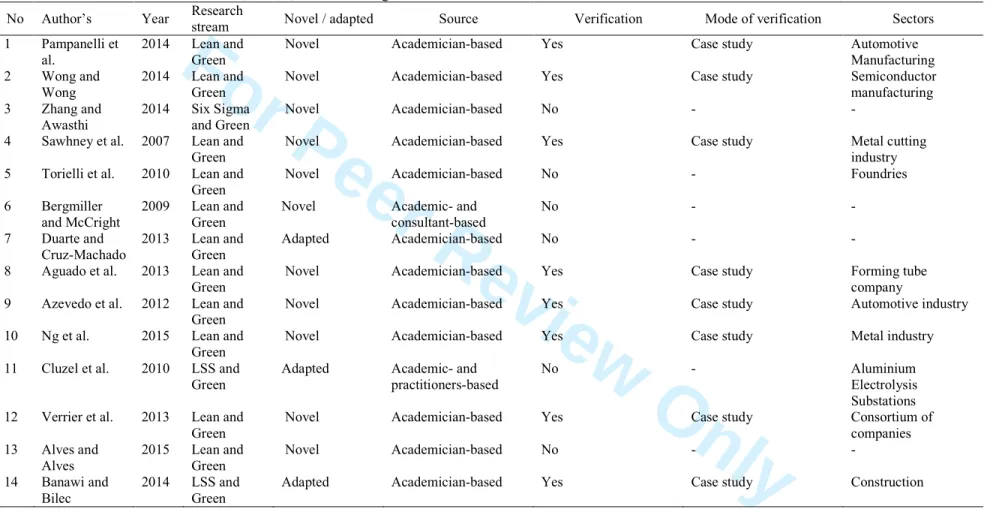
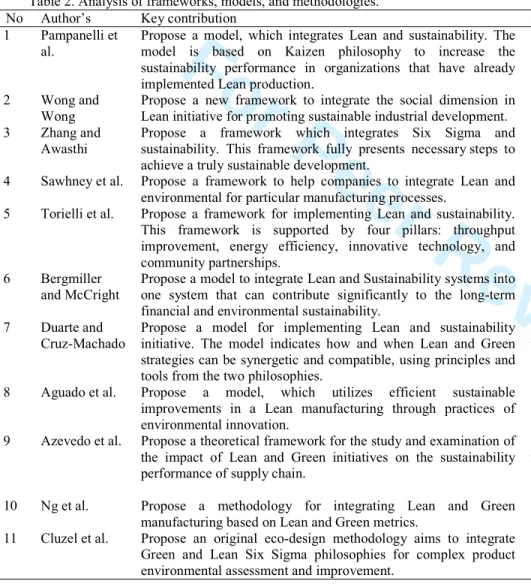
Because of the challenges that companies face when integrating and implementing Green, Lean/Six Sigma, various frameworks have been proposed to support organizations with this endeavor. The present study identified 14 frameworks through an extensive and critical review of the academic literature (Table 1 and Table 2). The location of the frameworks was carried out by using search strings linked to the main topic of the phenomenon under investigation. Similarly as Garza-Reyes (2015b), the context-intervention-mechanism-outcome (CIMO) (Briner and Denyer, 2012) approach was followed to facilitate the exclusion/inclusion criteria of the search strings. Search strings included (Lean), (Green), (Six Sigma) (Green Lean Six Sigma) (Lean Green), (models) and (framework). These search strings used Boolean operators (i.e. AND and OR) to identify further relevant papers. The search strings were input into Electronic databases that included Elsevier (sciencedirect.com), Taylor & Francis (T&F) (tandfonline.com), Emerald (emeraldinsight.com), Springer (springerlink.com), IEEE (ieeexplore.ieee.org), Inderscience (inderscience.com) and Wiley (onlinelibrary.wiley.com). Other data bases such as ISI Web of Science (wokinfo.com), EBSCO (ebscohost.com), and Google Scholar (scholar.google.com) were also consulted to broader the search of articles and validate those already located. For the sake of rigor, the literature review included only peer–reviewed journal articles. A final sample of 19 articles was identified. However, only 14 of these discussed rigorous frameworks to integrate Lean/Green and Six Sigma, and hence were further considered in this study.
2 3 4 5 6 7 8 9 10 11 12 13 14 15 16 17 18 19 20 21 22 23 24 25 26 27 28 29 30 31 32 33 34 35 36 37 38 39 40 41 42 43 44 45 46 47 48 49 50 51 52 53 54 55 56 57 58 59
For Peer Review Only
The literature review divulged issues that are common among different frameworks. These refer to the need for leadership, employee involvement, and a mature organizational level in applying Lean/Six Sigma tools and a good level of environmental awareness as important issues for cultural transformation and continuous improvement (Pampanelli et al. 2013; Zhang and Awasthi 2014; Ng et al. 2015). All the frameworks are based on a continuous improvement culture. The methodologies most applied are PDCA (plan-do-check-act),
DMAIC and Kaizen events. Generally, these frameworks start the implementation process by evaluating the current state of the sustainability performance before selecting the right techniques and tools to progress toward sustainability. The following section discusses some of the most relevant and recent frameworks.
Banawi and Bilec (2014) proposed a framework for integrating Green, Lean and Six Sigma in the construction industry. It is the only framework in the literature that integrates the three approaches. Its structure is based on DMAIC and organized into three steps:
• Step 1: Define and Measure;
• Step 2: Analyze and Improve; and
• Step 3: Control.
The first step aims to select a process for evaluation through the application of Value Stream Mapping (VSM) and Life Cycle Assessment (LCA) for identifying and quantifying environmental waste. Step 2 selects the right Six Sigma tools to reduce or eliminate wastes. Finally, step 3 re-evaluates the environmental waste using VSM and LCA to measure its reduction. Banawi and Bilec (2014) used a case study of pile cap installation to illustrate its application and associated results. They concluded that LG2S framework offers a comprehensive, multi-stage approach for process improvement and minimization of life cycle environmental impacts.
Pampanelli et al. (2014) proposed a model which integrates green into pure lean thinking by adopting a Kaizen approach to reduce energy and mass consumption in lean manufacturing cells. The model involves five steps:
• Step 1: Stabilizing the value stream;
• Step 2: Identifying environmental aspects and impacts;
• Step 3: Measuring environmental value streams;
• Step 4: Improving environmental value streams; and
• Step 5: Continuous improvement. 2 3 4 5 6 7 8 9 10 11 12 13 14 15 16 17 18 19 20 21 22 23 24 25 26 27 28 29 30 31 32 33 34 35 36 37 38 39 40 41 42 43 44 45 46 47 48 49 50 51 52 53 54 55 56 57 58 59
For Peer Review Only
Step one justifies the necessary pre-requisites for implementing the framework by identifying a cell that consumes important resources, has successful experience in implementing lean tools, and has a production flow that is stable. Step 2 determines the pilot area based on the identification of the relevant environmental impacts according to ISO 14001. Step 3 identifies, measures and collects environmental data such as energy, water, metallic and contaminated waste, oils and chemicals, and effluents. Step 4 identifies waste elimination opportunities by conducting Kaizen workshops, whereas step 5 develops action and communication plans for continuous improvement.
Verrier et al. (2014) proposed a framework for integrating green and lean to improve economic, environmental and social performance. The framework comprises green performance, lean and green intentions indicators. It needs a group of organizations for benchmarking their experiences in order to share the best knowledge and practices. Alves and Alves (2015) developed a model, and its implementation approach, to integrate sustainability and lean concepts, supported by a cultural transformation. The proposed model uses lean techniques and tools to minimize the consumption of natural resources and eliminate wastes. Cultural transformation is injected into the model using organizational actions to change attitudes, values, behaviors and outcomes by sharing knowledge and developing employee skills. The model involves:
• Stage 1: Structuring the implementation process;
• Stage 2: Implementation planning;
• Stage 3: Implementation of improvements;
• Stage 4: Stabilization of the processes; and
• Stage 5: Sharing knowledge and continuous improvement.
Using the findings from the literature review, the following gaps were identified:
• Table 1 reveals that the majority (11/14) of the frameworks have been developed without taking into consideration already existing frameworks in the area of GL2S. Only 3 frameworks (3/14) were fitted into the group of adapted frameworks.
• Twelve/14 of the existing frameworks were proposed by scholars, and only one article was published by academicians and practitioners. Therefore, there is a need to encourage more collaboration between all fields of researchers (practitioners, consultants and academics) to build more effective frameworks in a practical structured form with robust theory.
2 3 4 5 6 7 8 9 10 11 12 13 14 15 16 17 18 19 20 21 22 23 24 25 26 27 28 29 30 31 32 33 34 35 36 37 38 39 40 41 42 43 44 45 46 47 48 49 50 51 52 53 54 55 56 57 58 59
For Peer Review Only
• Table 1 shows that only 8/14 of the existing frameworks were tested using case study. Authors should test their work in a real industrial setting to encourage organizations to implement these frameworks.
• The number of frameworks developed in the GL2S stream was small compared to other streams (i.e. only one framework has attempted to integrate Green, Lean and Six Sigma).
• Collaboration and networking, especially with academic institutions and government bodies, to support sustainable manufacturing is not discussed in the existing frameworks.
• Few frameworks discuss stakeholders’ requirements, monitoring and controlling, knowledge management and how to integrate Green and Lean Six Sigma with limited resources. The implementation of GL2S should be conducted as a complete project that is thoroughly planned, implemented, monitored, controlled, evaluated and documented for lessons learned.
• Little attention has been given to the implementation sequences of the frameworks. In addition, the majority of the frameworks have been developed to help organizations implement these in specific industrial sectors instead of being generic frameworks. It is clear from the literature review that significant shortcomings exist. To overcome these limitations and promote GL2S, comprehensive and simplified implementation frameworks are necessary. This motivated the authors to conduct this research.
[Insert Table 1 about here] [Insert Table 2 about here]
3. Research methodology
This study presents a research project conducted between the 15 September 2013 and 30 December 2015 by a team of Lean Six Sigma and Green specialists from academia and industry. The project was carried out in four companies with different organizational characteristics (see Table 3).
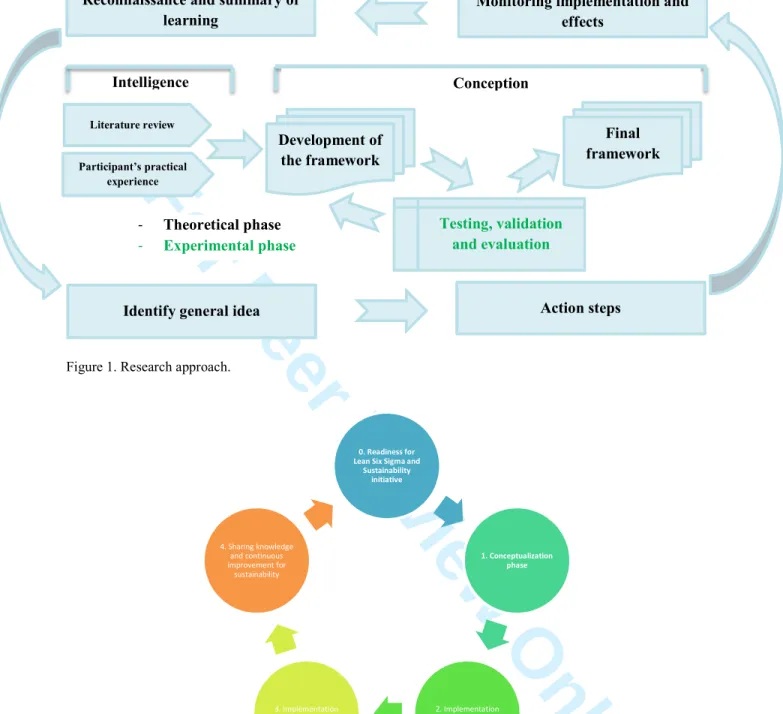
The GL2S framework was developed to improve sustainability performance. We aimed to achieve this goal by (1) increasing productivity in the consumption of resources; (2) decreasing environmental impact and (3) improving employee commitment. Figure 1 illustrates the research approach adopted in this study. The framework was developed, 2 3 4 5 6 7 8 9 10 11 12 13 14 15 16 17 18 19 20 21 22 23 24 25 26 27 28 29 30 31 32 33 34 35 36 37 38 39 40 41 42 43 44 45 46 47 48 49 50 51 52 53 54 55 56 57 58 59
For Peer Review Only
implemented and tested through a process of two macro-stages: intelligence and conception (Moreira et al. 2015). The intelligence stage aimed to present a literature review of concepts, theory and frameworks in the field of GL2S. This step was completed with the opinions of participants based on their experience in the implementation of Green practices and Lean Six Sigma projects. The main output of this phase was a map of the theory and previous works, which led to the identification of research gaps.
The conception macro-stage aimed to develop, validate and implement the framework. Each step took place through discussions with the experts and researchers using written feedback, workshops and conferences. The framework was first applied in company C1 in order to test its validity, overall structure, and make the necessary adjustments before rolling it out to the other companies.
The framework was built through a process of action learning cycles. These cycles were based on four phases of learning: (a) identify general idea; (b) action steps; (c) monitoring implementation and effects; and (d) reconnaissance and summary of learning. At the conclusion of each stage researchers and experts together critically evaluated the weaknesses and strengths of the process adopted to make sure that the objectives were achieved.
[Insert Table 3 about here] [Insert Figure 1 about here]
4. Structure of the proposed framework and its implementation method
The proposed GL2S framework explains how organizations can integrate Lean Six Sigma and Green in a systematic manner to improve economic, environmental and social performance. It consists of self-assessment models and five phases broken down into sixteen steps. Controlling and monitoring the process is integrated in all phases to ensure that the expected goals towards GL2S initiatives are achieved. Figures 2 and 3 illustrate the main implementation stages and sub-activities suggested to be performed in every stage. These are discussed in the following sections.
[Insert Figure 2 about here] [Insert Figure 3 about here] 2 3 4 5 6 7 8 9 10 11 12 13 14 15 16 17 18 19 20 21 22 23 24 25 26 27 28 29 30 31 32 33 34 35 36 37 38 39 40 41 42 43 44 45 46 47 48 49 50 51 52 53 54 55 56 57 58 59
For Peer Review Only
Phase 0: Readiness for GL2S initiative
Stage 0 is based on the diagnostic of requirements for the implementation and determination of the maturity stage of an organization to embark on a GL2S journey. We suggest the use of a self-assessment model (Appendix 1) as an instrument for assessing the actual situation of a company and its ability to undertake a new initiative. This self-assessment model was developed based on the Shingo, European Foundation for Quality Management (EFQM), Business Excellence (BE) and the Malcolm Baldrige National Quality Award (MBNQA) models (SP, 2010, 2012; EFQM, 2009, 2011; MBNQA, 2011; BEF, 2016). It is comprised of six elements to evaluate an organization’s preparedness to implementing GL2S:
1. Leadership and people;
2. Green and Lean Six Sigma tools; 3. Processes improvement;
4. Strategy and planning; 5. Stakeholders;
6. Result and Knowledge management.
Based on this self-assessment model, we proposed the Green Lean Six Sigma Preparedness Index (GL2SPI) to measure the organization’s readiness to implement GL2S. For each variable within each factor, a score is calculated based on five levels. The GL2SPI is calculated as an arithmetic mean of the different criteria. A score higher than 40 percent confirms that the organization is able to start the GL2S journey. This standard score was determined based on the scoring developed by BEF framework (BEF, 2016).
The self-assessment model also integrates a Green assessment as a mean to establish the current status and determine the best way to reduce environmental wastes and emissions.
Phase 1: Conceptualization stage
This is the kick-off phase, which helps a company to deal with the rational of the transformation process and measure the commitment level from the central management team. The principal knowledge and information of GL2S are transferred to the team. This preliminary phase is a vital step in establishing the foundations of the entire GL2S process.
Step1: Recognize the need for transformation
It is suggested that the need for transformation to integrate Green and Lean Six Sigma should be holistically justified prior to any action. This need for transformation may be externally driven by a variety of internal and external drivers (Cherrafi et al. 2016a). Table 4 provides a summary of external and internal transformation drivers. Internal drivers may be intertwined 2 3 4 5 6 7 8 9 10 11 12 13 14 15 16 17 18 19 20 21 22 23 24 25 26 27 28 29 30 31 32 33 34 35 36 37 38 39 40 41 42 43 44 45 46 47 48 49 50 51 52 53 54 55 56 57 58 59
For Peer Review Only
with external drivers to force the organization to think about the need for integrating Green and Lean Six Sigma. The strategic analysis would help organizations to identify their strengths and weaknesses and prioritize the potential transformation needed.It is important to note that linking GL2S project to business strategy and shareholders needs is critical for successful implementation.
[Insert Table 4 about here]
Step 2: Ensure involvement of managers and leaders
Top management plays a crucial role in facilitating change in a company, especially in the first wave of projects. A GL2S initiative must start with the management’s own commitment to improve sustainability. Without top management commitment, financial and human resources necessary to deploy improvement efforts will not be approved and the project can fail before it has even started. Table 5 summarizes the key responsibilities and roles of managers and their performance measures.
[Insert Table 5 about here]
Step 3: Develop training program for leaders
Organizations can use a variety of strategies to build their internal capacity to implement GL2S initiatives. Because the proposed framework is based on low-cost solutions, the best strategy to save resources is to collaborate with non-profit organizations, academic institutions and local government to get advantage of funding opportunities, obtain free technical assistance, and develop training courses. Governmental organizations such as the US Environmental Protection Agency (EPA) has developed toolkits and guides to help organizations reduce waste, become more sustainable and improve sustainability performance (http://www.epa.gov/Lean/). These agencies may also offer training courses and have downloadable resources on their websites. Academic institutions can also help organizations by proving training on techniques and tools of GL2S, students’ internships to participate in GL2S initiatives, and support from academics. Organizations have also the opportunity to benefit from free scientific resources that are available on numerous websites on the internet. Appendix 2 shows some of the websites that provide resources on GL2S.
2 3 4 5 6 7 8 9 10 11 12 13 14 15 16 17 18 19 20 21 22 23 24 25 26 27 28 29 30 31 32 33 34 35 36 37 38 39 40 41 42 43 44 45 46 47 48 49 50 51 52 53 54 55 56 57 58 59
For Peer Review Only
Phase 2: Implementation design stage
This is the warming up phase. It helps organizations to build momentum for implementing the transformation through the identification, selection and motivation of the team members, selection of first pilot project and determination of stakeholder’s requirement and needs in order to validate the scope of project.
Step 4: Select best employees for the first GL2S projects
It is important to select the best employees from all levels and departments with good technical and human skills to participate in the first wave of projects. This provides a strong indication to other employees that the organization is engaged in the implementation of GL2S initiatives. The organization can select the right people based on leadership skills and psychological factors. Key elements to consider are:
1. Availability of employees; 2. Ability to take responsibilities;
3. Knowledge of their functions andorganization’s structures;
4. Ability to serve as an informational resource for other employees in the company; 5. Enthusiastic about the GL2S team’s mission;
6. Good reputation and experience of participating in continuous improvement projects. In terms of the number of team members, no research has focused on determining an optimum number. We consider that this number depends on many factors such as the complexity of the process under improvement, organization’s environment, and the knowledge of the members. Ideally, the project team should consist of employees from different departments of the organization. The project team can also include members from outside the organization, e.g., internship students and academics. These members would provide an independent point of view to projects.
Step 5:Select pilot project
The selection and prioritization of the projects depends on the understanding of the overall processes. The easy way to understand processes and identify opportunities for improvement is by developing a VSM. In addition, to decide which organizational function and/or parameters (e.g. water consumption, CO2 emissions, energy consumption, etc.) should be
targeted first, organizations can use various Lean Six Sigma tools. These tools include quality function deployment, Pareto analysis, cost benefit analysis, project selection matrix, etc. (Garza-Reyes 2015a).
The results of the initial projects should be achieved in a short period of time with minimum effort and great financial return. It is desirable that these projects focus on key 2 3 4 5 6 7 8 9 10 11 12 13 14 15 16 17 18 19 20 21 22 23 24 25 26 27 28 29 30 31 32 33 34 35 36 37 38 39 40 41 42 43 44 45 46 47 48 49 50 51 52 53 54 55 56 57 58 59
For Peer Review Only
problems with strategic alignment to organization priorities and should be driven by data and voice of the stakeholders.
Step 6:Define stakeholder requirements, project charter and validate scope of project
In this step, the main task is to identify the concerns and sustainability priorities of stakeholders. Techniques to facilitate this include surveys, interviews, focus groups and study of stakeholder’s complaints. During this step, a draft project charter is also developed. It includes a short description of the process under study and the project goals. It should also include some milestones and define the responsibilities and roles of the team members.
Phase 3: Implementation and evaluation stage
This is the execution phase, which helps organizations to begin the change. This phase also includes an evaluation step in order to standardize and validate the implementation results.
Step 7: Select useful performance indicators
The implementation of GL2S initiatives requires appropriate metrics to identify and drive improvement. It is important that the indicators selected in this step reflect the priorities identified in steps 5 and 6. In addition, it will be necessary to select indicators that can help organizations to efficiently measure the three dimensions of sustainability. Figure 4 shows the process for selecting right indicators.
In order to facilitate the benchmarking between peers, the use of defined normalization indicators is essential. The use of indicators will require the management of different data. It is vital to set up a clear process to ensure that data is collected and managed in a robust and meaningful manner. Moreover, organizations should use visual management techniques to monitor the progress of their key performance indicators (Alves and Alves 2015).
[Insert Figure 4 about here]
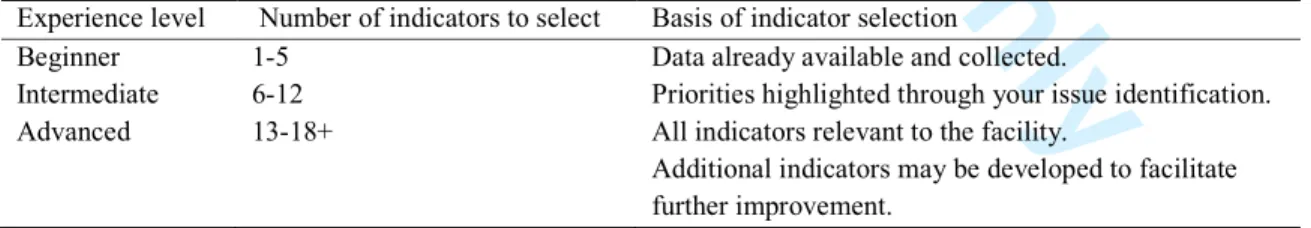
Organizations can start improving their sustainability performance on the basis of a few indicators. Then build on it over time as their experience grows and the value of using the indicators becomes clear, as illustrated in Table 6.
[Insert Table 6 about here]
Step 8: Measure current performance
The purpose of this step is to document the present state of the process under study, and develop a baseline performance data to guide the improvement efforts. In this step, the team 2 3 4 5 6 7 8 9 10 11 12 13 14 15 16 17 18 19 20 21 22 23 24 25 26 27 28 29 30 31 32 33 34 35 36 37 38 39 40 41 42 43 44 45 46 47 48 49 50 51 52 53 54 55 56 57 58 59
For Peer Review Only
sets up a clear process and practices to conduct the measurement and data collection. It is important to ensure that the methods used for undertaking the measurements are accurate and valid. Also, organizations must be able to ensure that the measurements are shared and reviewed in order to address any problems or wastes (e.g. excessive energy consumption, raw material consumption, CO2 emissions, etc.)
Step 9: Select the right Green and Lean Six Sigma methods and tools
This step aims to select the right and appropriate Green and Lean Six Sigma tools in order to analyze and improve the current performance measured in the previous step.
Once the team finds that the data collected has a statistically valid sample size, their results will help the organization to have a clear picture of their current performance. Based on this, the team will have to shortlist some of the methods and tools that can help the organization to overcome the problems highlighted by measurement. After the tools and methods have been shortlisted, the team should conduct a feasibility study to select the best methods and tools according to the organizational culture and needs. Appendix 3 provides a summary of some methods and tools that can be used for improving sustainability performance.
It is essential to remember that is a big mistake to think that the simple introduction of such tools and methods would lead firms to the successful implementation of GL2S. The methods and tools need to be carefully selected and used judiciously by involved people, and must fit with the organization in place (EPA, 2003; Cherrafi et al. 2016a). As indicated in Appendix 3, the project team can use several Lean Six Sigma tools to stratify and analyze the available data in order to identify root causes of problems. The authors suggest implementing 5S first in order to improve workplace organization, cleanliness and safety. Additionally, tools such as Pareto analysis, cause and effect analysis, 5 whys, time and motion studies, scatter plots, design of experiments, and analysis of statistical data can be used in this step. The results will determine the critical few root causes of wastes and the excessive use of water, energy, CO2, raw material, etc.
Step 10:Identify improvement opportunities
As data are collected and key causes are identified, the team begins to develop potential solutions to address the root causes. The team can typically work through a series of brainstorming workshops to generate creative solutions to reduce/eliminate sustainability related wastes.
Step 11: Analyze the solutions and develop an improvement plan
The team should evaluate each solution identified in the previous step in an objective manner using multiple criteria decision to determine appropriate solutions. Criteria usually include 2 3 4 5 6 7 8 9 10 11 12 13 14 15 16 17 18 19 20 21 22 23 24 25 26 27 28 29 30 31 32 33 34 35 36 37 38 39 40 41 42 43 44 45 46 47 48 49 50 51 52 53 54 55 56 57 58 59
For Peer Review Only
cost and time of implementation, economic gains resulting from improvement, easy implementation and permanence of the solution. The team can use priority matrix or Pugh matrix to find the feasible solutions.
Once the team has selected appropriate solutions a development plan is followed. In this task, the team should determine the implementation plan.
Step 12: Implement the action plan and start change management process
A successful implementation requires resource allocation, budgeting, documentation and communication plans. In order to minimize risks during this step, the team can use Failure Mode and Effects Analysis (FMEA) to identify and address potential problems that may arise during the implementation of solutions. It is important to take into consideration the impact of the change on the employees that are affected by the process. The team should develop a change-management approach, by analyzing the concerns and needs of different stakeholders, and developing a thoughtful communication plan.
Step 13: Measure the impact of theimprovements and sustain results
After the complete implementation of the solutions, the team should measure their impact to determine if the key metrics show improvement. At this point, frequent evaluations are required in order to ensure stable and predictable results.
It is essential to measure at the same time the economic, environmental and social performance to make sure that there is not a trade-off between the different types of impacts. Once the team is able to show improvement results, then it can move on to set the mechanisms for ongoing monitoring and institutionalization of improvements (Pyzdek 2014). Statistical tools such as run chart and statistical process control can be employed by the team to monitor important process parameters of sustainability.
Phase 4: Share knowledge and develop a culture of continuous improvement for sustainability
This phase aims to capture and share the best practices, knowledge and learning acquired in order to set the basis for continuous improvement and sustainability.
Step 14: Commitment to operational and sustainability excellence
Commitment to operational and sustainability excellence is a challenging mission that many organizations around the globe struggle to achieve. The development of human resources engaged to drive continuous improvement in meeting the internal and external stakeholder’s requirements is the appropriate answer. Thus, lessons and experiences learned throughout the project should be captured and shared. This is the basis for building a culture of continuous process improvement. 2 3 4 5 6 7 8 9 10 11 12 13 14 15 16 17 18 19 20 21 22 23 24 25 26 27 28 29 30 31 32 33 34 35 36 37 38 39 40 41 42 43 44 45 46 47 48 49 50 51 52 53 54 55 56 57 58 59
For Peer Review Only
Step 15: Communicating and celebrating initial success
Acknowledgements and celebration of success should be adequate with the organization’s culture and should be prepared in collaboration with the finance and human resources departments. All the economic, environmental and social benefits generated from the initiative should be communicated and reported. Multiple communication supports such as intranet and internal company can be exploited to contribute to internal marketing of GL2S initiatives. Such actions are important to motivate employees and increase their involvement and commitment to resolve problems concerning sustainability.
Step 16: Transition towards learning organization
Transition towards becoming a learning organization would help companies to sustain this initiative and its gains in the long-term. It is vital that organizations allocate necessary resources for mass and continual training of employees. Training programs should be based on needs of employees, with regular briefings and performance reviews in order to increase their effectiveness. Training programs should not only focus on techniques and tools of GL2S but also on soft issues such as leadership, team building, communication, motivation, etc.
5. Results
The pilot testing phase was carried out in company C1. Table 7 describes the main characteristics of the company where the GL2S Framework was applied.
[Insert Table 7 about here]
The pilot testing phase was carried out on May-August 2015 and followed the five phases of the proposed framework, see following sections. This event engaged a multidisciplinary team of 19 employees, comprising managers and team leaders, technical services staff and GL2S experts.
Phase 0: Readiness for GL2Sinitiative
In order to determine the preparedness of company C1 to implement GL2S initiative, a number of interview sessions with top management, employees and on-site visits were conducted. Based on the observation, the self-assessment was completed and the scores were transferred to a radar chart, see Figure 5.
[Insert Figure 5 about here] 2 3 4 5 6 7 8 9 10 11 12 13 14 15 16 17 18 19 20 21 22 23 24 25 26 27 28 29 30 31 32 33 34 35 36 37 38 39 40 41 42 43 44 45 46 47 48 49 50 51 52 53 54 55 56 57 58 59
For Peer Review Only
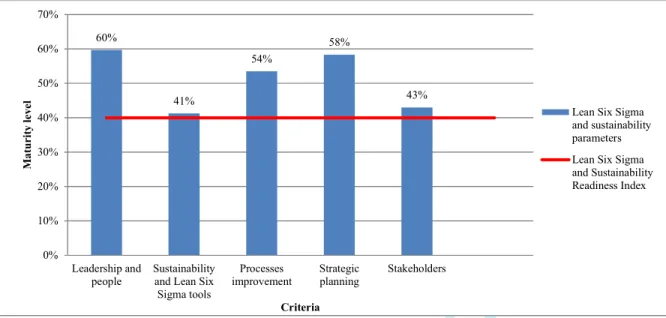
Once the score of each parameter was determined, a graph comparing the results obtained to the required GL2SPI was created, see Figure 6.
[Insert Figure 6 about here]
The results indicated that company C1 was ready to embark on phase 1 of the GL2S journey.
The result of the green assessment (Figure 7) indicated that key environmental issues in the production processes of company C1 were high consumption of water and energy. There was also concern with the health and safety of workers as the number of accidents was high. There were various environmental wastes embedded in the production processes that were ignored by employees because the company had concentrated more on production and quality than on sustainability.
[Insert Figure 7 about here]
Phase 1: Conceptualization stage
Step1: Recognize the need for transformation
Company C1 exports its products to a worldwide market. Over the recent years, the company has encountered fierce competition from low-labor-cost countries. This competition forced it to implement Lean Six Sigma in order to reduce costs. This mainly included the minimization of non-conforming products, improvement of productivity and machine availability. Today, company C1 is aware that its competitiveness is impacted also by a poor sustainability performance in terms of resources management. The company is motivated to implement the GL2S initiative to identify opportunities for improving resource efficiency by addressing existing challenges, e.g., high energy consumption, materials and water losses. Company C1 had also signed a partnership deal with a world market leader of canned products to provide access to a wide distribution network around the world. This partnership engaged the company to implement the Business Social Compliance Initiative (BSCI)to improve working conditions and reduce the environmental impacts of their plants.
Step 2: Ensure involvement of managers and leaders
Top management of company C1 was strongly committed to implement the GL2S initiative. They viewed their environmental problems as opportunities to improve the company’s competitiveness. They were committed on providing appropriate resources and making the 2 3 4 5 6 7 8 9 10 11 12 13 14 15 16 17 18 19 20 21 22 23 24 25 26 27 28 29 30 31 32 33 34 35 36 37 38 39 40 41 42 43 44 45 46 47 48 49 50 51 52 53 54 55 56 57 58 59
For Peer Review Only
initiative a top priority. According to the CEO, the company’s long term vision was for GL2S to become a key part of the company’s culture.
Step 3: Develop training program for leaders
Company C1 designed and implemented an education and training program with assistance from academics. This training program was developed based on the toolkits, guides and case studies provided by the US Environmental Protection Agency (EPA) and Washington State Department of Ecology. To be more efficient, the ‘train the trainer’ approach was adopted. In the first stage of training, several managers and team leaders from different departments received GL2S training who, in turn, trained other employees in their departments.
The training program focused on four key elements: 1. Lean Six Sigma and Green terminology and tools; 2. Methodology to integrate Lean Six Sigma and Green; 3. Techniques to identify and eliminate environmental wastes;
4. Strategies for communicating, managing change and working together internally.
Phase 2: Implementation design stage
Step 4: Select best employees for the first GL2S projects
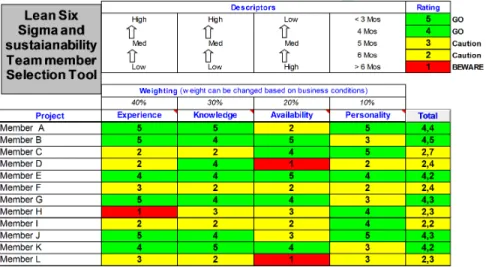
With assistance from the human resources department, the GL2S team was selected based on their experience, knowledge, availability and personality (see Figure 8). It is consisted of managers, engineers, supervisors and operators from manufacturing, maintenance and quality departments. This team also included the team of co-authors and a graduate student.
[Insert Figure 8 about here]
Step 5: Select pilot project
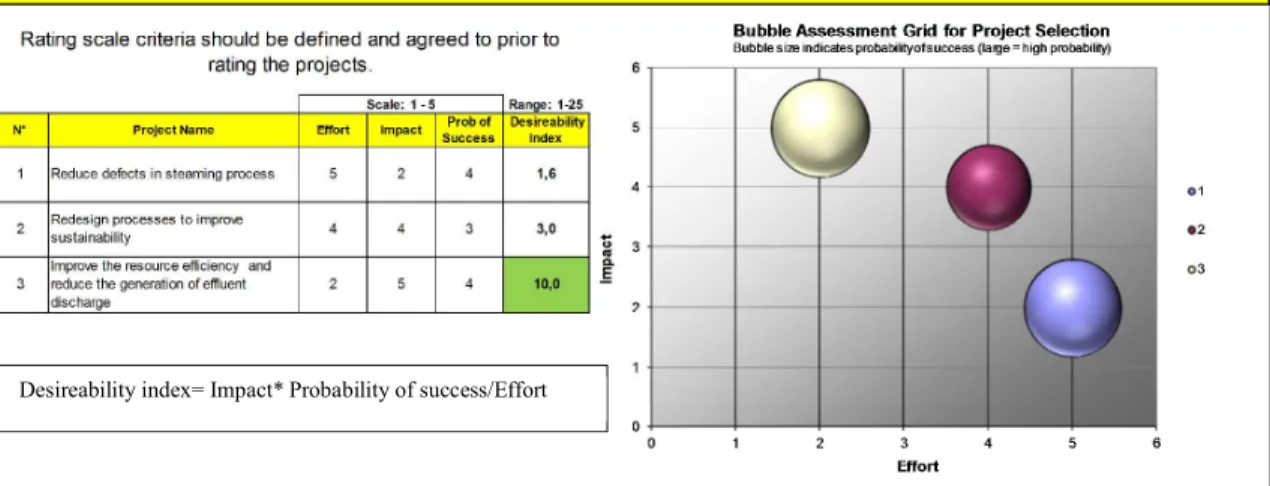
Through a number of brainstorming sessions, potential projects were identified based on their alignment to strategic planning and organizational objectives of company C1, duration and impact on stakeholders. Three projects were retained and their prioritization was done based on the GL2S project selection grid as shown in Figure 9. The project “Improve the resource efficiency” was chosen to address the high consumption of water and energy.
[Insert Figure 9 about here] 2 3 4 5 6 7 8 9 10 11 12 13 14 15 16 17 18 19 20 21 22 23 24 25 26 27 28 29 30 31 32 33 34 35 36 37 38 39 40 41 42 43 44 45 46 47 48 49 50 51 52 53 54 55 56 57 58 59
For Peer Review Only
Step 6:Define stakeholder requirement, project charter and validate scope of project
In this step, the traditional SIPOC (Supplier, Input, Process, Output, and Customer) was expanded to include process constraints (Cherrafi et al. 2016b). A SIPOCC (Supplier, Input, Process, Output, Customer, and Constraint) diagram was hence drawn for fish and seafood canning process as shown in Figure 10. It was used as an input to identify the stakeholders’ and determine the project’s scope.
[Insert Figure 10 about here]
To ensure that the goals of the project were in line with stakeholders requirements, data were collected through interviews with different stakeholders. The stakeholders’ comments were analyzed and translated to measurable requirements using the translation matrix shown in Figure 11.
[Insert Figure 11 about here]
After the identification of stakeholders’ requirements, the project team developed a charter to outline the project goals and set the project direction. This is shown in Table 8.
[Insert Table 8 about here]
Phase 3: Implementation and evaluation stage Step 7: Select useful performance indicators
Based on steps 5 and 6, the project team identified for each improvement area a key performance indicator. The improvement metrics identified are indicated in Table 9.
[Insert Table 9 about here]
For “working conditions” two metric were defined:
1. Physical Load Index (PLI): It was introduced by Hollman et al. (1999) to assess the physical work using the frequency of occurrence of different body positions and the handling of various loads (Faulkner and Badurdeen, 2014). The determination of the PLI score was based on a questionnaire and an equation. Details are provided in Appendix 4. 2 3 4 5 6 7 8 9 10 11 12 13 14 15 16 17 18 19 20 21 22 23 24 25 26 27 28 29 30 31 32 33 34 35 36 37 38 39 40 41 42 43 44 45 46 47 48 49 50 51 52 53 54 55 56 57 58 59
For Peer Review Only
2. Work environment risk: This indicator covers four risk groups due to: Pressurized systems (P), Electrical systems (E), Exposure to high energy components (H), and Slip, trip, and call risk (S). A rating system of 1-5, as shown in the Appendix 5, was used to evaluate each potential risk.
Step 8: Measure current performance
To understand and measure the current performance of the fish and seafood canning process, an extended VSM which included the use of water, electricity, steam, non-productive output (waste water, odor, solid waste generation) and working conditions indicators was created. This is shown in Figure 12.
[Insert Figure 12 about here]
Step 9: Select the right Green and Lean Six Sigma methods and tools
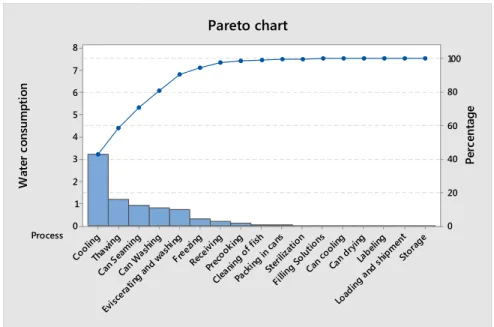
Root causes that affected resources inefficiencies, environmental wastes and working conditions were investigated. The project team used several Lean Six Sigma tools, including Pareto analysis, cause and effect analysis and 5why to identify the root causes of the high consumption of resources and waste generation. Figures 13 and 14 show examples of the tools used to understand the high water consumption.
[Insert Figure 13 about here] [Insert Figure 14 about here]
The project team conducted a Gemba walk in order to observe and inventory inefficiencies related to resources use. These included:
• Over production of 975 parts per day. This meant high levels of inventory in the shop floor. Thus, overproduction was consuming energy providing air conditioning and lighting to the extra floor space required.
• High energy consumption in the form of lighting and air conditioning for the inventory at the warehouse.
• Unnecessary movement of products due to high WIP.
• High consumption of resources in terms of resources per correct part produced as there was a high defect rate.
2 3 4 5 6 7 8 9 10 11 12 13 14 15 16 17 18 19 20 21 22 23 24 25 26 27 28 29 30 31 32 33 34 35 36 37 38 39 40 41 42 43 44 45 46 47 48 49 50 51 52 53 54 55 56 57 58 59
For Peer Review Only
• Energy waste in the form of waiting parts due to machine breakdowns at various stations.
From the findings it could be seen that there were various opportunities to decrease resources consumption.
Step 10: Identify improvement opportunities
Once the key causes were identified, the team developed potential solutions to address the root causes.
5S: the team proposed the application of 5S. Once the workplace was cleaned and organized, potential environmental wastes became easier to identify.
Manufacturing cell: the team also proposed to create manufacturing cells to the thawing and
eviscerating stations to reduce long waiting times of products and eliminate transportation problems between stations.
Standardized work: the team proposed to standardize the cleaning and packing processes by
creating a manual and video of the process in order to ensure a consistent method.
Total Productive Maintenance (TPM): the team proposed to apply TPM to reduce the
breakdowns causing waits. In addition, resources reduction opportunities were integrated into autonomous maintenance activities. A periodic maintenance plan including cleaning, lubrication, inspection and corrective actions was proposed to eliminate process failures that generated scrap, rework and high resource consumption.
Just-in-Time Production: The team proposed to apply Just-in-Time Production in order to
reduce storage space. This would eliminate the need to freeze raw material, thus reducing energy and water consumption.
Visual control:The team proposed to use visual controls to improve standardized procedures
and help employees to take the appropriate actions according to the status of processes.
Statistical Process Control (SPC): SPC was proposed to be used to monitor water and
electricity consumption and that abnormal changes could be detected in a timely manner.
Step 11: Analyze the solutions and develop an improvement plan
Costs and benefits of each proposed solution were identified to determine if the estimated benefits were greater than the implementation costs. Most of the costs were related to training, and the resources needed to implement the tools and to document the standardized procedures. The largest costs were related to corrective maintenance. The total investment was estimated at $US 190,042.
2 3 4 5 6 7 8 9 10 11 12 13 14 15 16 17 18 19 20 21 22 23 24 25 26 27 28 29 30 31 32 33 34 35 36 37 38 39 40 41 42 43 44 45 46 47 48 49 50 51 52 53 54 55 56 57 58 59
For Peer Review Only
Step 12: Implement the action plan and start change management process
Then, the improvement plan shown in Table 10 was created. Improvement actions were implemented across a three month period. We created an implementation plan for any improvements that would take more than one week to deploy or that required significant expenditures, and defined the associated costs and benefits at a finer detail than in step 11. Approval from the Finance Director to proceed with the implementation of the improvement opportunities was gained.
Improvements were implemented and appropriate processes redesigned to incorporate such improvements. As part of the project management of the implementation, weekly status reports were provided to the team. This included tasks that were completed and the status and estimated completion date. Any outstanding unresolved issues on an Item for Resolution Form were documented.
Additionally, a FMEA to identify and address potential problems that may arise was conducted. An example is provided in Table 11.
Step 13: Measure the impact of theimprovements and sustain results
We measured the impact of the improvements after the progression of the improvement plan for approximately 8 months.
Table 12 summarizes the pilot project’s results.
[Insert Table 12 about here]
The results of the analysis showed also the improvements in terms of emissions to air, noise pollution and effluents. The improvements implemented were controlled through plans to sustain the results achieved through the project.
Phase 4: Share knowledge and develop a culture of continuous improvement for sustainability
Step 14: Commitment to operational and sustainability excellence
The lessons and experiences learned throughout the project were collected and shared. These lessons were categorized by project knowledge area and descriptions, impacts, and recommendations were provided for consideration on similar future GL2S projects. The following charts list the lessons learned from the project.
[Insert Table 13 about here] 2 3 4 5 6 7 8 9 10 11 12 13 14 15 16 17 18 19 20 21 22 23 24 25 26 27 28 29 30 31 32 33 34 35 36 37 38 39 40 41 42 43 44 45 46 47 48 49 50 51 52 53 54 55 56 57 58 59
For Peer Review Only
Step 15: Communicating and celebrating the initial success
One of the last, but very important, steps of the framework is to take the time to celebrate the initial success, even if it was something as simple as going out for a lunch to celebrate, which the team did.
Step 16: Transition towards learning organization
Table 12 shows encouraging results obtained from the pilot testing. It demonstrated the feasibility of the GL2S Framework and its prerequisites. In addition, the study confirmed the theoretical finding that Lean Six Sigma tools contribute to improve sustainability performance. In this context, VSM can be used to identify environmental wastes of production processes; 5S can be useful for improving waste management; and cellular manufacturing can be used to reduce electricity consumption. The study also found that TPM can reduce several machine-related impacts, such as emission to air, noise pollution and oil leakage.
The successful results motivated the project team to roll out the framework to other companies. The rollout phase of the framework was lunched in collaboration with companies C2, C3 and C4. These companies were from different sectors and affected by different environmental considerations. The framework implemented for this phase was the same as presented in section 5. Table 14 presents the basic characteristics of the companies where the GL2S Framework was applied. The results are presented in Table 15.
[Insert Table 14 about here] [Insert Table 15 about here]
In addition to these quantifiable savings, the roll-out phase also generated other benefits including improvements in workers’ health and safety, staff communication and morale. This finding is in line with the results of the case studies conducted by Washington State Department of Ecology (2007a, 2007b, 2008a, 2008b).
The rollout phase of the framework was successful; it confirmed the results obtained in the pilot testing phase. Based on the results in Tables 12 and 15, we can conclude that the GL2S Framework is a suitable strategy for improving sustainability:
• In terms of increasing the sustainable exploitation of natural resources and reducing the negative environmental impacts of industrial activities, the results showed that the GL2S Framework can help organizations reduce their resources consumption by 20-40% when they have the needed score of GL2SPI (score > 40 percent).
2 3 4 5 6 7 8 9 10 11 12 13 14 15 16 17 18 19 20 21 22 23 24 25 26 27 28 29 30 31 32 33 34 35 36 37 38 39 40 41 42 43 44 45 46 47 48 49 50 51 52 53 54 55 56 57 58 59
For Peer Review Only
• In terms of cost saving opportunities, the implementation of the framework permitted a significant cost saving of 7-12% of the total cost of natural resources (i.e., energy, water, fuel, etc.) of the organizations.
• In terms of confirming keys to management success of the proposed framework, various elements should be taken into consideration when implementing the framework. The two phases of our project confirmed the predefined keys that are critical to the success for the integration of Green and Lean Six Sigma initiatives (see section 6).
6. Discussion
Along the four GL2S projects a number of tactical lessons learned were identified:
1. The project helped the four companies to achieve significant positive results. The team followed up the project with the companies 8 months after the implementation of the framework to verify whether these results were sustained. All four companies sustained the gains achieved during the GL2S initiative, although some attention to follow up and additional training was needed to prevent back sliding. For at least one company, C1, the pilot project enabled a better tracking of environmental savings, whereas the actual annual environmental cost savings for C2 were much higher than the estimates presented in the initial case study.
2. In all four projects, companies successfully used Lean Six Sigma tools and methods as a platform for identifying and implementing environmental improvement opportunities. The rudimentary understanding of Lean Six Sigma tools and their deployment results in ineffectiveness and misapplications. Thus, the application of these tools require training and co-operative environment.
3. It is crucial to be flexible in the implementation of the proposed framework, recognizing that every organization is different. Thus, although the proposed framework is based on a systematic approach, it does not intend to be a rigidly prescribed way to conduct GL2s projects. In this case, companies can add, eliminate skip, or revisit steps according to their specific needs and situations.
Top management support and team participation were two important key successes factors. For example, in project C, there were significant changes in top management during the implementation of the framework, as well as some variability in the availability of team members. This impacted the implementation of the framework.
2 3 4 5 6 7 8 9 10 11 12 13 14 15 16 17 18 19 20 21 22 23 24 25 26 27 28 29 30 31 32 33 34 35 36 37 38 39 40 41 42 43 44 45 46 47 48 49 50 51 52 53 54 55 56 57 58 59
For Peer Review Only
7. Conclusions
With growing pressure from customers, regulators, and other stakeholders for improving social and environmental performance, sustainability is nowadays one of the strategic imperatives for organizations (Garza-Reyes 2015a). As a result, many management systems have been used, or integrated, to make progress towards achieving sustainability (Chiarini 2015).
To overcome the limitations of the existing frameworks, this paper presents a framework, called GL2S framework, which integrates Lean Six Sigma and Green thinking to achieve economic, environmental and social sustainability. The framework was designed to explore the possible gains of integrating Lean Six Sigma and Green concepts in terms of reducing waste, consumption of natural resources and improving workplace health and safety.
GL2S consists of six keys to management success, a self-assessment model, and five phases sub-divided into sixteen steps. It aims to help companies of different sectors and sizes in a practical structured form to effectively implement GL2S, adjustments and modifications may be made to the proposed framework to be tailored to the specific needs and situations of every organization. The framework presented in this paper was developed for a factory level, providing the potential for future research to expand it to multi-factories and supply chain levels.
Before starting the implementation of the GL2S Framework, we identified a set of keys to management to ensure the effective and successful implementation of Green Lean Six Sigma initiatives: (i) leadership and people, (ii) Green and Lean Six Sigma tools, (iii) continuous process improvement, (iv) strategic planning, (v) stakeholders, (vi) results and knowledge management.
The framework was implemented in four companies that operate in different sectors, contexts and are affected by different environmental and social considerations. The framework is simple in structure and can be implemented without significant resources. With this advantage, small and medium-sized enterprises can easily implement the proposed framework. Based on the results obtained in this research project, we can conclude that GL2S Framework is a suitable strategy for achieving sustainability. Thus, it can be a part of a solution for organizations that are looking to achieve sustainability.
The GL2S framework presented in this contribution has been specifically tested in four different processes. Other processes, especially sensitive processes such as painting, chemical treatment and metal finishing, may be difficult to improve using this framework. The next 2 3 4 5 6 7 8 9 10 11 12 13 14 15 16 17 18 19 20 21 22 23 24 25 26 27 28 29 30 31 32 33 34 35 36 37 38 39 40 41 42 43 44 45 46 47 48 49 50 51 52 53 54 55 56 57 58 59
For Peer Review Only
step will be to extend the proposed framework to multi-factory and supply chain levels. These expansions are part of the future research agenda derived from this paper.
Acknowledgement
The authors would like to thank the industrial managers of the companies who participated in the comments which improved immensely the paper, as well as Dr. S. Azmoune, B. Baadi, A. Gaouji, A. Mokhles, E. Elayachi, M. Benzina for their support and enlightenment during this project.
References
Aguado, S., Alvarez, R., Domingo, R. 2013. “Model of efficient and sustainable improvements in a Lean production system through processes of environmental innovation.” Journal of Cleaner Production. 47, 141–148.
Alves, J.R.X., Alves, J.M. 2015. “Production management model integrating the principles of Lean manufacturing and sustainability supported by the cultural transformation of a company.” International Journal of Production Research. 51(11), 1–14.
Azevedo, S.G., Carvalho, H., Duarte, S., Cruz–Machado, V. 2012. “Influence of Green and Lean upstream supply chain management practices on business sustainability.” IEEE Transactions on Engineering Management. 59(4), 753–765.
Banawi, A., Bilec, M.M. 2014. “A framework to improve construction processes: integrating Lean, Green and Six Sigma.” International Journal of Construction Management. 14(1), 45–55. BEF. 2011. European Foundation for Quality Management, available at:
https://www.saiglobal.com/improve/excellencemodels/businessexcellenceframework/ (accessed 08 October 2016).
Bergmiller, G.G., McCright, P.R. 2009. “Are Lean and Green programs synergistic?.” Industrial Engineering Research Conference, Miami, Florida, USA, May 30 – June 3.
Briner, R.B., Denyer, D., 2012. Systematic Review and Evidence Synthesis as a Practice and Scholarship Tool. Handbook of Evidence-based Management: Companies, Classrooms and Research, 112-129.
Cabral, I., Grilo, A., Cruz-Machado, V. 2012. “A decision-making model for Lean, Agile, Resilient and Green supply chain management.” International Journal of Production Research. 50(17), 4830-4835.
Carvalho, H., Cruz–Machado, V. 2009. “Lean, agile, resilient and Green supply chain: a review.” In Proceedings of the Third International Conference on Management Science and Engineering Management in Bangkok, Thailand, 2009, 3–14.
Cherrafi, A., Elfezazi, S., Chiarini, A., Mokhlis, A., Benhida, K. 2016a. “The integration of lean manufacturing, Six Sigma and sustainability: a literature review and future research directions for developing a specific model.” Journal of Cleaner Production, 139, 828-846.
Cherrafi, A., Elfezazi, S., Chiarini, A., Mokhlis, A., Benhida, K. 2016b. “Production Management Model Integrating Green and Lean Six Sigma.” Proceedings of the 2016 International 2 3 4 5 6 7 8 9 10 11 12 13 14 15 16 17 18 19 20 21 22 23 24 25 26 27 28 29 30 31 32 33 34 35 36 37 38 39 40 41 42 43 44 45 46 47 48 49 50 51 52 53 54 55 56 57 58 59