Wandile Sihlobo
Thesis submitted in partial fulfilment of the requirements for the degree of
Master of Science in Agriculture (Agricultural Economics) in the Faculty of
AgriSciences at Stellenbosch University
Supervisor: Ms L. Ndibongo-Traub
ii DECLARATION
By submitting this thesis electronically, I declare that the entirety of the work contained therein is my own, original work, that I am the sole author thereof (save to the extent explicitly otherwise stated), that reproduction and publication thereof by Stellenbosch University will not infringe any third party rights and that I have not previously in its entirety or in part submitted it for obtaining any qualification.
Date: March 2016
Copyright © 2016 Stellenbosch University All rights reserved
iii
ABSTRACT
South Africa’s maize exports are generally irregular and inconsistent. This lack of consistency is attributed primarily to uneven surplus levels which, in certain years, preclude South Africa’s regular participation in larger import markets. We therefore applied a revealed comparative advantage index, agri benchmark production model, growth-share matrix, indicative trade potential index, relative indicative trade potential index and market attractiveness index to assess the competitiveness of South African maize exports, and the scope to expand the market share in existing markets and to identify unexploited and attractive markets.
We found that South Africa’s maize exports are competitive relative to leading global exporters. However, the production costs analysis showed that South Africa is less competitive relative to Argentina, Brazil, the USA and the Ukraine. High-potential and attractive markets were identified as Japan, Mexico, Taiwan, the United Arab Emirates, Thailand and Zimbabwe. These are markets that South Africa should prioritise to develop in the short to medium term. Moreover, the Market Attractiveness Index showed that Indonesia, Nigeria, Malaysia, Saudi Arabia, Mauritius, the United Arab Emirates, Taiwan, Iran, the Democratic Republic of Congo and Yemen are the top ten attractive markets for South African maize exports.
In terms of market access, South Africa faces relatively similar tariff levels in global markets compared to its competitors. However, with regard to non-tariff barriers, South Africa faces restrictions in markets such as Thailand, Saudi Arabia and within the EU countries, since South Africa’s maize production is approximately 85% genetically modified.
Recommendations for developing South African maize exports would be to closely view the top 25 attractive markets presented on the Market Attractiveness Index and strategically position the industry to access these markets. There also is a need to design an industry export strategy that will prioritise these markets in line with business interests and to explore the existing potential. The current South African maize exports are concentrated and there is scope to access new markets.
iv
OPSOMMING
Suid-Afrika se mielie-uitvoere is oor die algemeen onreëlmatig en onkonsekwent. Hierdie gebrek on konsekwentheid word hoofsaaklik toegeskryf aan oneweredige oorskotvlakke wat in sommige jare Suid-Afrika se gereelde deelname in groter invoermarkte verhoed. Ons het dus ’n onthulde vergelykende voordeel-indeks (revealed comparative advantage index), die agri benchmark produksiemodel, die groei-aandeel matriks, aanduidende handelspotensiaal-indeks (indicative trade potential index), relatiewe aanduidende handelspotensiaal-indeks (relative indicative trade potential index) en die markaantreklikheidsindeks (market attractiveness index) gebruik om die mededingendheid van Suid-Afrikaanse mielie-uitvoere te bepaal, sowel as die moontlikheid om die markaandeel in huidige markte uit te brei en om onontwikkelde en aantreklike markte te identifiseer.
Ons het gevind dat Suid-Afrika se mielie-uitvoere mededingend is relatief tot die voorste globale uitvoerders. Die produksiekoste-analise het egter getoon dat Suid-Afrika minder mededingend is relatief tot Argentinië, Brasilië, die VSA en Oekraïne. Aantreklike markte met ’n hoë potensiaal is in Japan, Meksiko, Taiwan, die Verenigde Arabiese Emirate, Thailand en Zimbabwe geïdentifiseer. Hierdie is markte waaraan Suid-Afrika voorkeur moet gee om in die kort- tot mediumtermyn te ontwikkel. Verder het die markaantreklikheidsindeks getoon dat Indonesië, Nigerië, Maleisië, Saoedi-Arabië, Mauritius, die Verenigde Arabiese Emirate, Taiwan, Iran, die Demokratiese Republiek van die Kongo en Jemen die top tien aantreklike markte vir Suid-Afrikaanse mielie-uitvoere is.
In terme van marktoegang staan Suid-Afrika voor redelik eenderse tariefvlakke in die globale markte as sy mededingers. Met betrekking tot nie-tarief struikelblokke staan Suid-Afrika voor beperkings in markte soos Thailand, Saoedi-Arabië en binne die EU-lande, aangesien Suid-Afrika se mielieproduksie ongeveer 85% geneties gemodifiseer is.
Aanbevelings vir die ontwikkeling van Suid-Afrikaanse mielie-uitvoere behels ’n nadere beskouing van die top 25 aantreklike markte in die markaantreklikheidsindeks en om die bedryf strategies te posisioneer om hierdie markte te betree. Daar is ook ’n behoefte aan die ontwerp van ’n bedryfsuitvoerstrategie wat voorkeer gee aan hierdie markte in lyn met
v
sakebelange en om die huidige potensiaal te ondersoek. Huidige Suid-Afrikaanse mielie-uitvoere is gekonsentreerd en daar is ruimte vir toegang tot nuwe markte.
vi
ACKNOWLEDGEMENTS
My sincere gratitude goes to my supervisor, Ms Lulama Ndibongo-Traub, for her valuable support and leadership during this research.
I would also like to say thank you to the Grain SA team, particularly Mr Jannie De Villiers, Mr Wessel Lemmer and Dr Marinda Visser. To Mr Nico Hawkins, Dr Dirk Esterhuizen, Mr Divan van der Westhuizen, Mr Louw Piennar, Mr Tinashe Kapuya, Mr Simpiwe Tshoni, Mr Bonani Nyhodo, Mr Hamlet Hlomendlini, Mr Awonke Mbangi, Mr Thamaga Malapane, Ms Masego Moobi, Ms Lyndre Nel, Ms Sam Munro, Ms Reaane Olivier, Mr Tsikaro Mapena and everyone who encouraged me during the course of this study – thank you. Your interest and encouragement are highly appreciated.
I wish to say thank you to Prof. Nick Vink, for making it possible for me to join Maties and the great support we have received under his leadership.
My family – thank you for your support, encouragement and the faith you had in me to complete this study.
I would like to thank God Almighty for giving me strength and wisdom to complete this study, as this would not have been possible without Him.
Come, all you who are thirsty, come to the waters; and you who have no money, come, buy and eat – Isaiah 55, v 1
vii
Contents
DECLARATION ... ii ABSTRACT ... iii OPSOMMING ... iv ACKNOWLEDGEMENTS ... vi LIST OF FIGURES ... x LIST OF TABLES ... xiCHAPTER ONE: INTRODUCTION ... 1
1.1 BACKGROUND ... 1
1.2 PROBLEM STATEMENT ... 2
1.3 OBJECTIVES OF THE STUDY ... 4
1.4 KEY ASSUMPTION ... 4
1.5 RESEARCH METHODOLOGY AND HYPOTHESES ... 4
1.6 OUTLINE OF THE STUDY ... 5
CHAPTER TWO: A BRIEF OVERVIEW OF THE SOUTH AFRICAN MAIZE VALUE CHAIN ... 6
2.1 INTRODUCTION ... 6
2. 2 BASIC CONDITIONS: AGRICULTURAL MARKETING AND TRADE POLICY FOR MAIZE ... 7
2.2.1 Brief Overview of Agricultural Marketing Policy ... 7
2.2.2 Brief Overview of South African Agricultural Trade Policies ... 8
2. 3 OVERVIEW OF SOUTH AFRICAN MAIZE PRODUCTION ... 8
2.3.1 South African Maize Production Trends ... 8
2.4 INTERNATIONAL TRADE OF SOUTH AFRICA’S MAIZE ... 13
2.4.1 South Africa’s Maize Exports ... 13
2.4.2 South Africa’s Maize Imports ... 17
2.5 DOMESTIC CONSUMPTION AND INTERNATIONAL TRADE OF MAIZE PRODUCTS ... 18
2.5.1 Overview of Domestic Maize Consumption Trends... 18
2.5.2 Brief Overview of Maize Products Trade ... 19
2.6 CONCLUSION ... 19
CHAPTER THREE: THEORETICAL FRAMEWORK ... 21
3.1 INTRODUCTION ... 21
3.2 EVOLUTION OF TRADE THEORIES ... 22
3.2.1 Mercantilist and Classical Trade Theory ... 23
3.2.2 Neoclassical Models ... 25
viii
3.3 NEW TRADE THEORY SCHOOL OF THOUGHT ... 30
3.3.1 Porter’s Diamond Model ... 31
3.3.2 Growth Share Matrix ... 34
3.4 CONCLUSION ... 36
CHAPTER FOUR: TECHNIQUES OF MEASURING COMPETITIVENESS AND IDENTIFYING NEW MARKETS ... 37
4.1 INTRODUCTION ... 37
4.2 REVEALED COMPARATIVE ADVANTAGE ... 37
4.3 REAL EXCHANGE RATE ... 39
4.4 NET EXPORT INDEX ... 40
4.5 PRODUCTION COSTS BENCHMARKING ... 40
4.6 MARKET ATTRACTIVENESS INDEX ... 42
4.7 CONCLUSION ... 43
CHAPTER 5: DESCRIPTION AND INTERPRETATION OF THE RESULTS ... 45
5.1 INTRODUCTION ... 45
5.2 HOW COMPETITIVE ARE SOUTH AFRICAN MAIZE EXPORTS RELATIVE TO LEADING GLOBAL EXPORTERS? ... 45
5.2.1 South Africa’s Revealed Comparative Advantage Within the Global Context ... 45
5.2.2 Competitiveness of South Africa’s Maize Sector at Farm Level ... 47
5.3 POTENTIAL MAIZE EXPORT MARKETS: CAN SOUTH AFRICA INCREASE ITS MARKET SHARE IN THE EXISTING MAIZE MARKETS? ... 50
5.3.1 Growth-share Analysis of South Africa’s Major Export Markets ... 50
5.3.2 Growth-share Analysis of Major Global Import Markets ... 53
5.3.3 South Africa’s Maize Export Potential ... 54
5.4 WHICH ARE OTHER UNEXPLOITED, POTENTIAL MARKETS FOR SOUTH AFRICAN MAIZE EXPORTS? ... 57
5.5 A TARIFF BARRIER ANALYSIS OF SOUTH AFRICA’S STRATEGIC AND POTENTIALLY STRATEGIC EXPORT MAIZE MARKETS ... 61
5.5.1 Market Access in South Africa’s Attractive Markets ... 62
5.5.2 Market Access in Potential and Attractive Markets ... 63
5.6 A NON-TARIFF BARRIER ANALYSIS OF SOUTH AFRICA’S STRATEGIC AND POTENTIALLY STRATEGIC MAIZE MARKETS ... 65
5.7 CONCLUSION ... 66
CHAPTER SIX: CONCLUSIONS AND RECOMMENDATIONS ... 68
ix
6.2 REVISITING THE RESEARCH QUESTION ... 68
6.3 CONCLUSIONS AND RECOMMENDATIONS ... 69
6.4 FURTHER RESEARCH... 69
LIST OF REFERENCES ... 71
APPENDIX A: DATA USED IN CHAPTER FIVE TO CALCULATE SOUTH AFRICA’S GROWTH SHARE MATRIX IN ATTEMPTS TO UNDERSTAND IF SOUTH AFRICA CAN INCREASE ITS MARKET SHARE IN EXISTING MAIZE MARKET ... 79
x
LIST OF FIGURES
Figure 2.1: Area planted to maize by province ... 9
Figure 2.2: South Africa’s maize production by province ... 10
Figure 2.3: Area planted to white and yellow maize in the past 14 years ... 12
Figure 2.4: South African maize imports and exports ... 17
Figure 2.5: South African maize consumption ... 18
Figure 2.6: South African maize flow ... 20
Figure 3.1: Adam Smith’s absolute advantage ... 23
Figure 3.2: Production possibility frontier ... 24
Figure 3.3: Porter cluster theory of competitiveness ... 33
Figure 3.4: Growth share matrix ... 34
Figure 4.1: Market Attractiveness Index and Indicators ... 43
Figure 5.1: Farm input cost comparison ... 47
Figure 5.2: Farm input costs for South African Maize Farmers ... 49
Figure 5.3: Growth share matrix for South Africa’s selected major export markets ... 52
Figure 5.4: Growth share matrix major global maize import markets ... 53
Figure 5.5 Market attractiveness index for South African maize exports ... 58
Figure 5.6: Country demand index for South African maize ... 59
xi
LIST OF TABLES
Table 1.1: Research question, hypothesis and methodology ... 5
Table 2.1: Ranking of the 20 largest global maize exporters in 2014 ... 14
Table 2.2: Ranking of South Africa’s top 20 maize export markets in 2014 ... 15
Table 3.1: Evolution of trade theories ... 22
Table 5.1: Revealed comparative advantage for the top ten global maize exporters ... 46
Table 5.2: Trade potential for South Africa’s in its maize export markets ... 56
Table 5.3: Market attractiveness index results for South African maize... 61
Table 5.4: Tariffs faced by major global exporters in South Africa’s attractive markets .... 62
Table 5.5: Trade agreements major global exporters in South Africa’s attractive markets 63 Table 5.6: Tariffs faced by major global exporters in potentially attractive markets ... 64
Table 5.7: Trade agreements major global exporters in South Africa’s attractive markets 64 Table 5.8: Countries that have a ban on genetically modified (GM) crops ... 65
1
CHAPTER ONE: INTRODUCTION
1.1BACKGROUND
The origin of maize can be traced to the Tehuacan Valley of Mexico, from where it spread throughout the Americas in about 2500 B.C. (Mangelsdorf & Reeves, 1938). The first documented account of maize on the African continent was in 1549, when a Portuguese pilot noted established maize fields in the Cape Verde Islands (McCann, 2001). Maize was first introduced in South Africa 1655, and has since become one of dominant food crops (Kempton, 1931; McCann, 2001).
Maize is produced in all the provinces of South Africa, but the most significant producing regions are the Free State, Gauteng, Mpumalanga and North-West province (GSA, 2015a). On average, between 2.5 and 2.75 million hectares of commercial maize is planted in South Africa each year (MaizeTrust, 2014). Furthermore, about 350 000 to 500 000 hectares is planted by small-scale farmers. In general, South Africa’s maize-planting season starts in late spring or early summer, with optimal planting times between October and December. The harvesting time usually starts in March and ends in August (GSA, 2015a).
Genetically modified (GM) maize crops were introduced in South Africa in the 2001/2002 season (GSA, 2015a). By 2010, South Africa was the ninth’s largest global cultivator of biotech crops, with more than 2.2 million hectares under GM maize (Pioneer, n.d.). According to the Maize Trust (2014), 85% of South Africa’s total maize crop is GM maize. The adoption of genetically modified maize, coupled with other technological improvements has led to significant increases in yields. For example, before the introduction of GM maize, yield levels under irrigation in the Northern Cape province were around 9.12 tons per hectare in the 1997/1998 production year, but these increased to 12 tons per hectare in the 2007/2008 production year, which to date is the highest commercial yield on the African continent (GSA, 2015a).
Besides its importance as a staple food for the majority of the population, maize is a major feed grain for livestock. Estimates by Grain South Africa indicate that, on a 10-year average (2005-2015) national maize production of 11 million tons, 84% is consumed domestically (GSA, 2015b). Approximately 40% of that total is for human consumption, whilst the animal
2
feed industry has a share of 38% (GSA, 2015b). The rest might be used for gristing or farm uses. White maize is mainly for human consumption and yellow maize for animal feed.
The maize industry is important to the South African economy and food security of the country, and therefore its competitiveness is a matter of concern. The industry has seen some dramatic changes over the past two decades, moving from a heavily regulated market environment towards a free-market environment that is interlinked to the global market environment (Traub & Jayne, 2004).
1.2 PROBLEM STATEMENT
Prior to 1997, the Marketing of Agricultural Products Act No. 59 of 1968 provided the framework for domestic and international trade in agricultural commodities. For the maize industry, a single-channel fixed-price scheme was established using a cost-plus approach to commodity pricing and margin determinations (Traub & Meyer, 2010). However, following the gradual liberalisation of the grain commodity markets in the mid-1980s and the removal of trade sanctions against South Africa, the South African agricultural industry had become fully liberalised by 1997, with producers and marketing agents more interlinked to global markets and thereby to market forces.
The Marketing of Agricultural Products Act No. 47 of 1996 currently shapes agricultural marketing policy in South Africa (Traub & Meyer, 2010). Under this Act, prices are based on negotiations between market actors, and several trade reforms were enacted to meet the objective of establishing a market-orientated economy and to comply with the requirements of various trade agreements. These structural changes in the maize market have given rise to the drive by many agricultural entities and government to assess, understand and improve the competitiveness of the industry (Esterhuizen, 2006). In this respect, a number of studies were done in many agricultural industries by both international and domestic researchers, but little has been done on the South African maize industry.1
Evidence suggests that, on the production side, South Africa’s maize industry, when compared to other leading global exporters, is less competitive (Bureau for Food and Agricultural Policy [BFAP], 2014). For example, South African farmers establish maize at
1 Van Rooyen and Van Rooyen, 1998; Van Rooyen, Esterhuizen and Doyer, 2000; Valentine and Krasnik, 2000; Pitts and Lagnevic, 1997; Ferto and Hubbard, 2001; Esterhuizen, 2006; Esterhuizen and Van Rooyen, 2005.
3
higher costs than farmers in the United States, Argentina and the Ukraine, owing to high fertiliser and pesticide costs (BFAP, 2015). However, on the production side, South Africa is competitive when compared to regional maize producers. According to ReNAPRI (2014), the costs of fertiliser (urea) in the commercial market, in the 2011/2012 season in the South African small farming environment was US$38 per 50 kilograms, while in Malawi it cost US$59 per 50 kilograms and US$41 per 50 kilograms in Zambia. Moreover, South Africa’s cost of maize seed in 2011/2012 was at US$85 per hectare, while Zambia’s seed costs were at US$112 per hectare.
In the same vein, South Africa’s traditional maize export markets are highly concentrated, meaning that large proportion of South Africa’s maize exports go to a few countries (ITC, 2015a). This is on the back of the adoption of the Comprehensive Africa Agriculture Development Programme in 2003, which aimed at increasing African countries’ agricultural gross domestic product growth by 6% per year (Bahiigwa & Benin, 2013). This meant that governments had to spend 10% of their national expenditure on agriculture. This, in turn, led to increased subsidies and price support for maize, which ultimately resulted in surplus production in Malawi and Zambia, which were previous South African export markets (Ricker-Gilbert, 2011).
At the same time, South Africa’s commercial maize production has shown a significant increase. From 2009/2010 to 2013/2014, South Africa’s maize production increased by 12%, from 12.8 million tons to 14.3 million tons. Within the same period, South Africa’s commercial domestic consumption grew by just 6%, and currently is at 9.7 million tons (GSA, 2015b). The development of new export markets might bring profit for the farmers and foreign earnings to the economy. There is little understanding of the competitiveness of the South African maize industry and the possibility to access new markets.2 Thus, this study will address these research gaps.
2 Van Rooyen and Van Rooyen, 1998; Esterhuizen and Doyer, 2000; Valentine and Krasnik, 2000; Pitts and Lagnevic, 1997; Ferto and Hubbard, 2001; Esterhuizen, 2006; Esterhuizen and Van Rooyen, 2005
4 1.3 OBJECTIVES OF THE STUDY
The broad objective of the study was to evaluate the competitiveness of South African maize exports relative to the global exporters.
Specific Objectives
To describe and provide evidence of the competitiveness status of the South African maize exports.
To assess the scope for South Africa to increase its market shares in existing maize export markets.
To identify unexploited potential markets for the South African maize exports.
1.4 KEY ASSUMPTION
The key assumption underlying the study is that maize is homogeneous, as trade databases do not offer more nuanced product differentiation and, as a result, both yellow and white maize statistics conflate into a single product. To address the research question and test the various hypotheses, this study made use of the International Trade Centre’s (ITC) Harmonized Systems classification data, quoting the product line “HS100590” (i.e. maize (corn) nes (not elsewhere specified)), which essentially treats maize as a homogeneous product.
1.5 RESEARCH METHODOLOGY AND HYPOTHESES
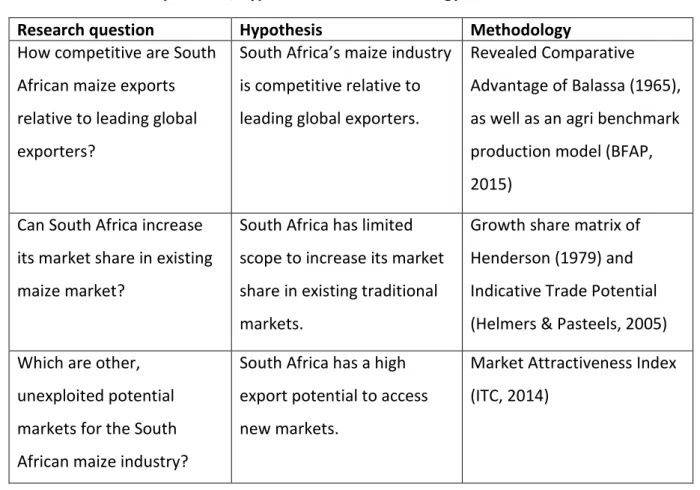
The study attempted to assess the competitiveness of South Africa’s maize exports by following the quantitative approaches of Balassa (1965), the growth-share matrix of Henderson (1979) and the International Trade Centre’s (2014) Market Attractiveness Index. Table 1.1 presents a summary of the research questions, hypotheses and methodology of the study.
5
Table 1.1: Research questions, hypotheses and methodology
Research question Hypothesis Methodology How competitive are South
African maize exports relative to leading global exporters?
South Africa’s maize industry is competitive relative to leading global exporters.
Revealed Comparative Advantage of Balassa (1965), as well as an agri benchmark production model (BFAP, 2015)
Can South Africa increase its market share in existing maize market?
South Africa has limited scope to increase its market share in existing traditional markets.
Growth share matrix of Henderson (1979) and Indicative Trade Potential (Helmers & Pasteels, 2005) Which are other,
unexploited potential markets for the South African maize industry?
South Africa has a high export potential to access new markets.
Market Attractiveness Index (ITC, 2014)
1.6 OUTLINE OF THE STUDY
To address the objectives of this study, Chapter 2 provides an overview of the South African maize industry. This is done by exploring the agricultural marketing and trade policy, the production pattern over the years, international trade of South Africa’s maize and lastly, domestic consumption and international trade of maize products. Chapter 3 provides a summary of the theoretical framework that underpins the notion of comparative advantage. In Chapter 4 the methodological approaches that were applied to measure the competitiveness of the South African maize industry are discussed. Chapter 5 presents the results of the Revealed Comparative Advantage model, Production Cost Comparisons, Growth Share Matrix and Market Attractiveness Index. Chapter 6 provides the conclusions and recommendations of the study.
6
CHAPTER TWO: A BRIEF OVERVIEW OF THE SOUTH AFRICAN MAIZE VALUE CHAIN 2.1 INTRODUCTION
The South African maize industry contributes significantly to the economy of South Africa, both upstream to the input industries and downstream to the processing industries (MaizeTrust, 2014). In 2014, the primary agricultural industry contributed 2.5% to the gross domestic product (GDP) of South Africa (StatsSA (Statistics South Africa), 2014). At the same time, the maize industry’s contribution to the total GDP was estimated at 0.4%. Maize plays a vital role as an input in the manufacturing industry, which contributes about 13% to the total GDP of the country (StatsSA, 2014).
Moreover, the maize contribution to foreign earnings has been growing. From 2001 to 2014, South African maize foreign earnings grew significantly, from R629 841 000 to R4 865 266 000 in real terms (ITC, 2015a).This was on the back of increasing maize exports, from 599 156 tons to 1 642 540 tons (ITC, 2015a).
The South African maize industry comprises producers or farmers, governmental organisations and agribusinesses (i.e. trading companies, co-operatives, financial institutions, etc.). However, the umbrella producer or farmer organisation is Grain South Africa (Grain SA). Moreover, the maize industry is divided into commercial and small-scale agriculture. In 2011, the number of commercial maize farmers was estimated at 8 000 and the number of developing agricultural farmers remain unknown (Tshilambuli, 2011).
The South African maize industry provides income to the value chain agents: farmers, processors, exporters and transporters. Hence, it is an important crop from both the food security and income generation perspectives. It is worth noting that the industry is one of the most mechanised industries in South Africa, hence requires highly skilled labour relative to industries such as the table grape industry (Goldblatt, 2009). Primary agriculture, with the maize industry included, contributes about 6% to formal employment in the country (StatsSA, 2015a).
7
2. 2 BASIC CONDITIONS: AGRICULTURAL MARKETING AND TRADE POLICY FOR MAIZE
2.2.1 Brief Overview of Agricultural Marketing Policy
In South Africa, agricultural policy has a significant impact on the maize industry. From the 1930s up to 1997, maize marketing and pricing were heavily regulated by the state (Traub & Jayne, 2004). This was under the Marketing Act of 1937. Nonetheless, it is important to highlight that, in the early 1960s, the South African agricultural industry faced increasing pressure to liberalise its markets, which led to the deregulation of state agricultural marketing schemes within the framework of the Marketing Act of 1968. These deregulation steps had an influence only on the domestic environment, since South Africa was isolated from the world market due to international sanctions under the Apartheid regime.
The first opening for the maize sector to the influences of the world market came with the Marrakesh Agreement of the General Agreement on Tariffs and Trade (GTT) in 1993, when all government controls on agricultural trade were replaced by tariffs (Vink & Kirsten, 2002). The most significant policy change, however, was brought about by the Marketing of Agricultural Products Act, No 47 of 1996. After the implementation of this Act, farmers had to take sole responsibility for the production and marketing of their products for the first time since the 1930s (Vink & Kirsten, 2002). The Maize Board, which used to do the marketing and pricing of maize, was abolished and futures trading was introduced through the South African Futures Exchange (SAFEX) (Traub & Jayne, 2004).
The deregulation process meant that prices and production decisions were to be influenced by global market forces (Chabane, 2002). These were challenging market forces to which farmers had to adapt after operating in a guaranteed and enclosed environment for decades. These challenges included international maize price volatilities and influences, exchange rate volatilities, local production and consumption levels, and stock level (world and domestic market) influences. It is worth noting that the deregulation of agricultural marketing was a success, with notable improvements in increasing production efficiency (Chabane, 2002). Thus, the South African maize industry is among the world’s notable maize producers and exporters (ITC, 2015a).
8
2.2.2 Brief Overview of South African Agricultural Trade Policies
Trade policy reform is one of the important policy interventions made in the maize industry. Before 1994, South African trade policy involved quantitative restrictions, tariff lines, ad-valorem duties and surcharges (Vink & Kirsten, 2002). These methods changed after the Marrakech Agreement of the GTT in 1993. The South African maize trade currently is under tariff restrictions which are calculated by the world maize reference prices (GSA, 2014a). The reference price in October 2015 was at US$110/ton and delivers a tariff when prices trade below this reference price by US$10 for 21 consecutive days (GSA, 2014a).
These reforms included the phyto-sanitary standard, import and export permits. Moreover, a number of institutions were established to implement these reforms, such as the International Trade Administration Commission, Food Safety and Quality Assurance, South African Agricultural Food, Quarantine and Inspection Services Directorate, Perishable Products Export Control Board, Plant Health and Quality Directorate and the Department of Health (Traub & Meyer, 2010). The main aim of this policy was to enhance South Africa’s international maize competitiveness (Vink & Kirsten, 2002).
South Africa also has successfully negotiated favourable trade agreements, such as all the World Trade Organisation agreements, African Growth and Opportunity Act, the Trade and Development Cooperation Agreement, the Southern African Development Community, and the Southern Africa Customs Union Treaty, and in 2015 was negotiating the Tripartite Free Trade Area (Traub & Meyer, 2010; Andriamananjara, 2015).
2. 3 OVERVIEW OF SOUTH AFRICAN MAIZE PRODUCTION
2.3.1 South African Maize Production Trends
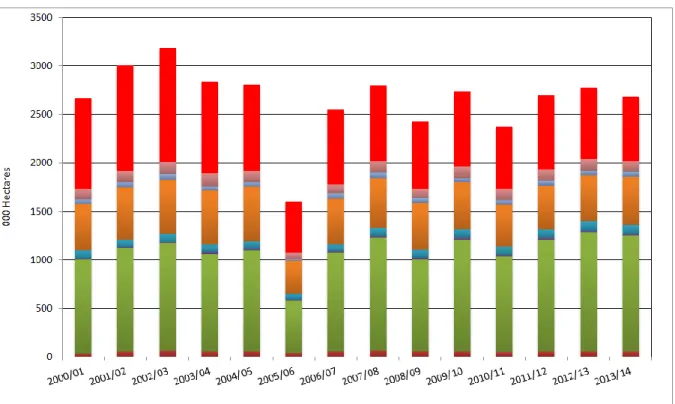
Maize is produced throughout South Africa, with the Free State, Mpumalanga and North West provinces being the largest producers, accounting for approximately 80% of the total production (GSA, 2015a). Figure 2.1 shows the trend of maize area planted by province over the past 14 seasons. The area has varied throughout the 14 production seasons, with an average area of 2.6 million hectares (GSA, 2015a). The Free State province has the largest area planted to maize, accounting for about 44.45% of the total maize area planted in the 2013/2014 production season. The second largest maize area planted is in North West province, accounting for 24.74% of the total area planted in 2013/2014. The third largest
9
maize area planted is in Mpumalanga province, accounting for 18.60% in the 2013/2014 production season (GSA, 2015a).
Figure 2.1: Area planted to maize by province Source: Grain SA (2015a)
The maize hectares are expected to decrease in Mpumalanga province in the near future (2021), as the main agricultural land is continuously being taken by the coal mining industry (BFAP, 2012). In 2013/2014, the area planted to maize in Mpumalanga was 500 000 hectares. The BFAP (2012) argues that there is a possibility that 326 022 hectares of total agriculture in the Mpumalanga province might be lost as a result of coal mining expansion. This would include all summer crop hectares, such as soybeans, sunflower seed, sorghum, etc. The BFAP (2012) further claims that 439 577 hectares of agricultural land in Mpumalanga province is at risk of being transferred to the mining industry between 2012 and 2021. This area totals to 765 599 hectares.
Gauteng province also is a significant player in the production of maize, with the area planted to maize accounting for 4.39% of the 2.6 million hectares planted in 2013/2014 (GSA, 2015a). The other provinces, such as the Eastern Cape, KwaZulu-Natal and Limpopo,
10
are also significant players in South African maize production, but most importantly in small-scale farming, which contributes significantly to household food security (TIPS (Trade and Industrial Policy Strategies), 2009). The total area planted to small-scale farming or non-commercial farming was estimated at 408 000 hectares in 2013/2014, which is 15% of the total area planted to commercial maize, at 2.6 million hectares (CEC, 2015).
Figure 2.2 illustrates the production trends of total maize production by province for the past 14 seasons. During this period, South African maize production increased by 91%, from 7.5 million tons to 14.3 million tons. The significant increase in production was largely driven by yields due to improved production technologies, production methods and new seed varieties (Pioneer, n.d.; BFAP, 2012). The observed production volatility in some years is due to changes in climatic conditions. Evidently, the 2005/2006, 2007/2008 and 2012/2013 production seasons were heavily affected by drought, especially in the western maize-producing areas of the country, which are the North West province and the western parts of the Free State province, which are the main white maize-producing areas (GSA, 2015a).
Figure 2.2: South African maize production by province Source: GSA (2015a)
11
From 2000/2001 to 2013/2014, the total maize production or output of the Free State increased by 44%, to 6.3 million tons, which accounts for 43.84% of the total production. As previously highlighted, the production increase is due to improved production practices, favourable weather conditions and the adoption of improved technologies, such as GMO seeds (GSA, 2015a). The second largest maize-producing province is North West, accounting for 20.34% in the 2013/2014 production season. The third largest maize producing province is Mpumalanga, accounting for 19.52%. Gauteng, the Northern Cape, KwaZulu-Natal and the Eastern Cape province are also signification maize producers (GSA, 2015a). The smallest maize-producing province is the Western Cape. The Western Cape province mainly produces winter grains, such as wheat, barley, canola and oats (GSA, 2015a).
Additionally, maize production takes place largely on dry land, although there is about 17% that is produced under irrigation, mainly in the Northern Cape province (GSA, 2015a). There are many factors that influence maize production, ranging from inputs to climatic conditions. Successful maize production depends on the correct application of production inputs that will sustain the environment, as well as agricultural production (Du Plessis, 2003). Some essential methods are improved seed cultivars, plant population, soil tillage, fertilisation, weed, insect and disease control (GSA, 2015a).
The eastern parts of South Africa are mostly conducive for yellow maize production, while the western regions of the country are mostly conducive for white maize production (GSA, 2015). These production variations are due to climatic differences. The production proportion between white and yellow maize has been changing over the years. Research shows that much of this is largely due to changes in household consumption. Rising income and positive class mobility rates have led to diet diversification and the increasing consumption of protein. Therefore, over the past decade or so, the demand for yellow maize from the feed industry has risen significantly (BFAP, 2014). This phenomenon is apparent on both the domestic and global front.
12
Figure 2.3 illustrates the changes in South African maize hectares over the past 14 production seasons. By the 2013/2014 marketing year, the area planted to maize had generally decreased, but, in proportion, yellow maize area planted increased by 8% from 2000/2001 to 2013/2014 in response to the global demand. White maize area planted is still significant and likely to remain that way, as white maize is the staple food for millions of people in Southern Africa (see Figure 2.3).
Figure 2.3: Area planted to white maize and yellow maize in the past 14 seasons Source: GSA (2015a)
13
2.4 INTERNATIONAL TRADE OF SOUTH AFRICA’S MAIZE 2.4.1 South Africa’s Maize Exports
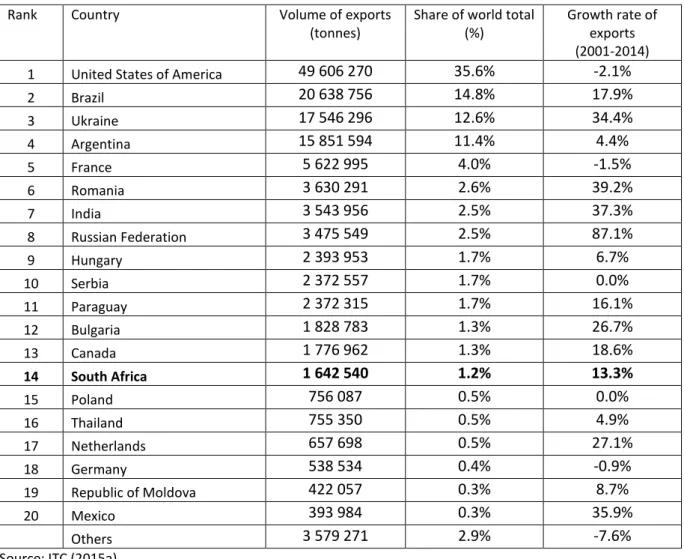
South Africa can be considered as one of the smaller players in the global maize export market, contributing a modest 1.2% of total world maize exports in 2014 (see Table 2.1). Given the relatively small size of South Africa in the global context, the domestic industry is a price taker, with production and exports in the USA, Brazil, Argentina and the Ukraine largely influencing global maize prices (Mofokeng, 2012). According to Bahta (2004), South Africa’s participation in global markets has seen some fierce competition from the larger exporters, particularly those among the top four global players. Global maize exports are concentrated within the top four largest exporters, which are countries that account for 74% of total global exports. Meanwhile, 97% of the volume of the world’s maize exports comes from the top 20 exporters (see Table 2.1).
With the exception of Argentina, the USA, France, Hungary, Serbia, Poland, Thailand, Germany and the Republic of Moldova, all the other countries within the top 20 largest exporters grew at a faster pace than South Africa’s exports. The Ukraine, Romania, India, Russia, Bulgaria, the Netherlands and Mexico showed phenomenal growth rates in export volumes between 2001 and 2014, with average annual growth rates of between 20% and 86%. South Africa’s exports grew by 13.3% over the same period, which is above the world average growth rate of 3.7%.
14
Table 2.1: Ranking of the 20 largest global maize exporters in 2014
Rank Country Volume of exports
(tonnes)
Share of world total (%)
Growth rate of exports (2001-2014)
1 United States of America 49 606 270 35.6% -2.1%
2 Brazil 20 638 756 14.8% 17.9% 3 Ukraine 17 546 296 12.6% 34.4% 4 Argentina 15 851 594 11.4% 4.4% 5 France 5 622 995 4.0% -1.5% 6 Romania 3 630 291 2.6% 39.2% 7 India 3 543 956 2.5% 37.3% 8 Russian Federation 3 475 549 2.5% 87.1% 9 Hungary 2 393 953 1.7% 6.7% 10 Serbia 2 372 557 1.7% 0.0% 11 Paraguay 2 372 315 1.7% 16.1% 12 Bulgaria 1 828 783 1.3% 26.7% 13 Canada 1 776 962 1.3% 18.6% 14 South Africa 1 642 540 1.2% 13.3% 15 Poland 756 087 0.5% 0.0% 16 Thailand 755 350 0.5% 4.9% 17 Netherlands 657 698 0.5% 27.1% 18 Germany 538 534 0.4% -0.9% 19 Republic of Moldova 422 057 0.3% 8.7% 20 Mexico 393 984 0.3% 35.9% Others 3 579 271 2.9% -7.6%
Source: ITC (2015a)
In 2014, South Africa exported significant volumes of maize to five of the top 20 major importers of maize, including Japan, Korea, Chinese Taipei, Italy and the UK (ITC, 2015a). As shown in Table 2.2, South Africa’s market share in these countries is as follows: Japan (1.3%); Republic of Korea (1.5%); Chinese Taipei (7.2%); Italy (0.4%); and the UK (0.1%). These five countries, altogether, took up 41% of South Africa’s total maize exports.
A look at South Africa’s export markets shows that, outside of these five major markets, South Africa exported 53% of its maize within the Southern African Development Community (SADC) countries (i.e. Zimbabwe, Mozambique, Angola, Lesotho and all the states in the Southern African Customs Union (SACU)). The remaining 6% of maize exports was destined for other markets, such as Portugal, the United Arab Emirates (UAE), Thailand, Côte d'Ivoire, Cameroon, Madagascar and North Korea (ITC, 2015a).
15
Source: ITC (2015a)
a. Area Nes – Not elsewhere specified. b. SA – South Africa
c. NA – Data is not available
In total, South Africa exported its maize to 115 different countries over the 14-year period (2001 to 2014), with some countries being more consistent importers than others. The SACU and SADC countries feature more prominently each year, while countries such as Sweden, Kuwait, Mauritania, Turkey, Benin, Seychelles and Thailand, among others, appear sporadically in particularly years (ITC, 2015a)
Moreover, South Africa’s maize export market structure is concentrated, meaning that significantly large share of South Africa’s maize exports go to only a few countries. Between Table 2.2: Ranking of South Africa’s top 20 maize export markets in 2014
Rank Country Volume of
SA exports to country i (tonnes) Share of country i in SA exports (%) Country i imports from the world
(tons) Market share of SA in country i (%) 1 Taipei, Chinese 303 158 18.5% 4 211 679 7.2% 2 Zimbabwe 234 409 14.3% 283 873 82.6% 3 Japan 198 697 12.1% 15 032 129 1.3% 4 Botswana 189 118 11.5% 194 173 97.4% 5 Korea, Republic of 155 807 9.5% 10 220 987 1.5% 6 Namibia 150 363 9.2% 166 053 90.6% 7 Mozambique 116 053 7.1% 149 831 77.5% 8 Swaziland 89 451 5.4% 999 085 9.0% 9 Lesotho 88 874 5.4% 88 874 100% 10 Portugal 52 500 3.2% 1 768 666 3.0% 11 Italy 20 001 1.2% 4 580 354 0.4% 12 Angola 6 721 0.4% NA NA 13 Viet Nam 5 331 0.3% NA NA 14 Cameroon 5 118 0.3% 33 423 15.3% 15 Thailand 4 908 0.3% 36 974 13.3%
16 United Arab Emirates 4 335 0.3% N/A NA
17 Area Nes 4 031 0.2% 4 034 NA
18 Côte d'Ivoire 2 558 0.2% 3 050 83.9%
19 United Kingdom 1 718 0.1% 2 192 625 0.1%
20 North Korea 1 575 0.1% 17 233 9.1%
16
2001 and 2014, South Africa’s top five export markets accounted for an average of 48% of the country’s total maize exports. At the same time, the top ten markets have averaged 61%, while the top twenty have averaged 65% of the total maize exports (ITC, 2015a).
The percentage share of the top five, ten and twenty countries dipped in particular years, namely 2004, 2007, 2009, 2011 and 2012. The drop in the share of the major markets in South Africa’s total exports was due to the opening up of new markets, an occurrence that is sporadic and random, as well as low output on the back of drought conditions, particularly in 2007 and 2012 (GSA, 2015a). In 2009, 70% (1 117 702 tons) of South African maize was exported to Kenya, which is currently not part of the top twenty existing markets, thus there was a significant drop in that year’s export concentration.
Furthermore, from 2004 to 2010, Kenya was among the largest South African maize export markets, but volumes have since decreased due to increased competition from Zambia and Malawi (ITC, 2015). These countries’ increased maize production has mainly been supported by fertiliser subsidies (Ricker-Gilbert, 2011). Zambian maize imports have been on a decreasing trend since 2009; from 41 929 tons to 2 207 tons in 2014. However, the existing leading suppliers still are South Africa and Malawi. On the one hand, Zambia’s maize exports increased from 8 845 tons in 2001 to 75 533 tons in 2014 (ITC, 2015b). In 2012, Zambia recorded the highest export volume of 613 588 tons, with Zimbabwe, Mozambique, the Democratic Republic of Congo and Kenya being the leading importers. The available data shows that Malawian maize exports increased from 6 688 tons in 2001 to 357 246 tons in 2011 (ITC, 2015b). There was a decrease from 2012 to 2014, with exports at 3 847 tons (ITC, 2015b). This decrease can be attributed to low output on the back of unfavourable weather conditions.
Moreover, in 2011 and 2012, Mexico imported about 36% (1 030 430 tons) and 62% (919 568 tons) of South African maize respectively (ITC, 2015a). These imports were on the back of drought conditions in Mexico, which in turn led to low output (Reuters, 2011). Nonetheless, the long-term trend suggests declining levels of concentration over time, signifying that; overall, South Africa is exporting its maize to more countries than it used to.
17 2.4.2 South Africa’s Maize Imports
South Africa’s domestic demand is largely met by domestic supply (GSA, 2015b). In most years, the country is a net exporter of maize. Nonetheless, at times of drought, South Africa usually imports maize from the Ukraine, Botswana, Zambia, Argentina, the USA and Brazil (ITC, 2015a). In 2002, 2004, 2006 and 2007, South Africa had low output due to unfavourable weather conditions, which in turn resulted in large import volumes. Figure 2.4 illustrates South African maize imports and exports over the past 14 years (2001 to 2014).
Figure 2.4: South African maize imports and exports (2001 to 2014) Source: ITC (2015a)
18
2.5 DOMESTIC CONSUMPTION AND INTERNATIONAL TRADE OF MAIZE PRODUCTS
2.5.1 Overview of Domestic Maize Consumption Trends
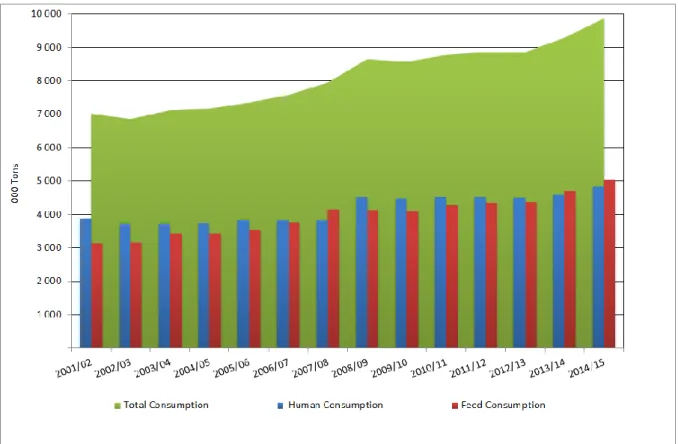
In South Africa, maize is consumed by both humans and the animal industry. In the past 14 years, South Africa’s maize consumption averaged at 8.1 million tons (GSA, 2015b). Of this total, 3.9 million tons went to the feed industry while the rest was for human consumption. In the 2014/2015 market year, South Africa’s human consumption accounted for 34% of that season’s total output of 14.3 million tons. In the same season, animal feed consumption accounted for 35% and the rest was for farm use and export markets. Figure 2.5 shows South Africa’s maize consumption.
Figure 2.5: South Africa’s maize consumption Source: GSA (2015b)
As noted earlier, yellow maize consumption has been increasing due to the high demand from the animal feed industry. From the 2001/2002 to 2014/2015 marketing years, South African feed consumption grew by 62%, from 3.1 million tons to 5.04 million tons. At the same time, human consumption grew by 23%, from 3.9 million tons to 4.8 million tons (GSA,
19
2015b). Moreover, South African population growth is also among the main drivers of increasing consumption. From 2004 to 2015, the South African population grew from 46 million people to 54 million people (StatsSA, 2015b).
2.5.2 Brief Overview of Maize Products Trade
South Africa also exports maize products, which are usually maize meal and samp. These export products mainly go to regional markets, such as Zimbabwe, Lesotho, Swaziland and Botswana (SAGIS, 2015). From 2001/2002 and 2014/2015, average maize products exports averaged 111 000 tons (SAGIS, 2015). Over this period, maize export products grew by 267%, from 54 000 tons to 198 000 tons (SAGIS, 2015). Nonetheless, maize products exports are still significantly lower than the exports of maize, which average at 1.2 million tons from 2001/2002 and 2014/15 (SAGIS, 2015).
2.6 CONCLUSION
Maize is the staple food for millions of South Africans and continues to contribute significantly to the GDP of the country. The industry is interlinked with many industries in the manufacturing sector, hence increasing its contribution to the overall economy. The exports also contribute significantly to the South African economy. Over the years there have been increasing foreign earnings, through increasing maize exports. It is important to note that the maize area planted has decreased significantly, but productivity has shown a meaningful increase, thus compensating for the lost hectares. The policy changes that were made over the years have also contributed positively to the South African maize industry’s competitiveness. Figure 2.6 presents a summary of the graphic flow of the South African maize.
20
Figure 2.6: South African maize flow Data Source: GSA (2015)
In some seasons, such as in 2013/2014, South Africa had large surpluses which would have generated the country additional revenues and supported the maize prices if they were exported timely. This study hence aims to evaluate the competitiveness of South African maize exports and further identify unexploited potential markets for the maize industry.
21
CHAPTER THREE: THEORETICAL FRAMEWORK 3.1 INTRODUCTION
Rising globalisation within the food system has given rise to the need for agricultural industries to compete not only in domestic markets but also globally. As a result of these new challenges, competitiveness has become a key focus for many industries (Esterhuizen, 2006). Hence there is a real need for businesses and governments to assess, understand and improve their international competitiveness with respect to trade. Against this background, an open economy such as that of South Africa, which has large imports of agricultural inputs, gives rise to a need for the maize industry to be more internationally competitive. The current trade environment in the South African maize industry is informed by the deregulation process of agricultural markets and re-submission to World Trade Organization agreements. Hence this chapter reviews the trade theories and briefly refers to their alignment with the current trade environment.
Comparative and competitive advantage briefly tabulated
The concepts of competitiveness and comparative advantage are usually confused with one another (Lim, 1997). From a business perspective, competitiveness is defined as the “ability of companies, industries, regions, nations, and multinational regions to generate relatively high factor income and factor employment levels on a sustainable basis, while remaining exposed to international competition” (Latruffe 2010, p.5). In short, it is the advantage that a firm has over its competitors, allowing it to generate greater sales or margins and/or to retain more customers than its competition. The source of this advantage can arise from the firm's differential advantage and/or comparative advantage. Differential advantage refers to the uniqueness of a firm’s product offerings relative its competitors. In contrast, comparative advantage (or cost advantage) refers to a firm’s ability to produce a good or service at a lower opportunity cost than its competitor (Serin & Civan, 2008). Thus, competitiveness and comparative advantage are the essential ideas of trade theory, as countries are expected to export goods for which autarky relative prices are lower than those of other countries.
22
In spite of the clarity on competitive and comparative advantage, this chapter focuses only on comparative advantage (no concerted effort was made to describe the evolution of competitive advantage).
3.2 EVOLUTION OF TRADE THEORIES
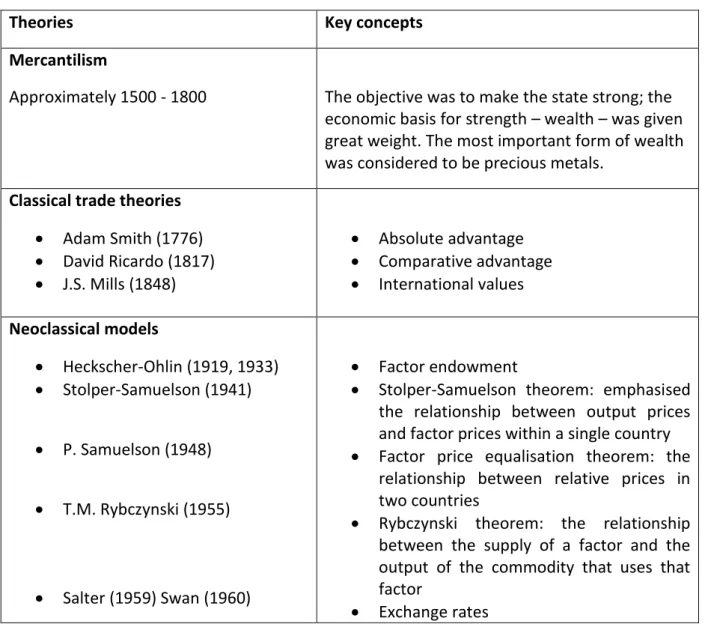
The origin of the current trade theories can be traced back from the 1500s, a period that marks the era of Mercantilism. This theory was later challenged in 1776 and 1817 by Adam Smith in his publication The Wealth of Nations, and by David Ricardo is his Principles of Economics respectively. Adam Smith and David Ricardo’s theories heralded the formulation of a theory of free trade. Table 3.1 presents a summary of the evolution of trade theories.
Table 3.1: Evolution of trade theories
Theories Key concepts
Mercantilism
Approximately 1500 - 1800 The objective was to make the state strong; the
economic basis for strength – wealth – was given great weight. The most important form of wealth was considered to be precious metals.
Classical trade theories
Adam Smith (1776) David Ricardo (1817) J.S. Mills (1848) Absolute advantage Comparative advantage International values Neoclassical models Heckscher-Ohlin (1919, 1933) Stolper-Samuelson (1941) P. Samuelson (1948) T.M. Rybczynski (1955) Salter (1959) Swan (1960) Factor endowment
Stolper-Samuelson theorem: emphasised the relationship between output prices and factor prices within a single country
Factor price equalisation theorem: the relationship between relative prices in two countries
Rybczynski theorem: the relationship between the supply of a factor and the output of the commodity that uses that factor
23
Challenges to comparative advantage
Leontief (1953) S. Linder (1961) R. Vernon (1966) Krugman (1979) Lancaster (1979) Leontief Paradox Overlapping demand
The product cycle
Economies of scale Source: Masters (1995) and Esterhuizen (2006)
3.2.1 Mercantilist and Classical Trade Theory
The Mercantilist view dominated trade theory between 1500 and 1750 (Appleyard, Field & Cobb, 2010). The fundamental principle of the mercantilists’ school of thought was that a nation’s growth pathway was determined by its ability to remain a net exporter. Throughout this process, a nation’s revenue was the inflow of precious metals, primarily gold and silver generated through trade. However, in the short run there was a fixed amount of gold and silver, which meant that nations could not simultaneously be net exporters. This implied that trade could only occur at the expense of the other nations (Appleyard et al., 2010). Hence this zero-sum game led to the emergence of import restrictions and export promotion to the advantage of the king, exporters and domestic producers, while domestic consumers lost due to higher domestic prices and limited product variety.
The challenges of zero-sum games that emerged from the mercantilist period were later addressed by the classical economists, namely Adam Smith (1723-1790), David Ricardo (1772-1823) and John Stuart Mill (1806-1873). Adam Smith, in his book The Wealth of Nations (1776) argued that Mercantilism ensured that only a few benefited and therefore weakened a nation in the long run. He reasoned that, through specialisation and free trade, all nations could benefit from trade. His viewpoint was that when nations specialised in industries that they have absolute advantages, trade becomes a positive-sum game, where all trading nations benefit. As a result, Smith strongly advocated a policy of laissez-faire government involvement in trade, arguing that free trade would increase productivity and maximise world welfare (Salvator, 2011). Figure 3.1 below illustrates the net welfare gains from free trade using the market model.
24
Figure 3.1: Adam Smith’s absolute advantage
Assuming that two countries, A and B, produce goods X and Y and require labour for their production (see Figure 3.1). Country A takes one day to produce three units of X and two units of Y, while country B takes one day to produce four units of X and one unit of Y. Therefore, country A has an absolute advantage in terms of the production of Y, as it can produce it at a lower cost than country B, which has an absolute advantage in the production of X. Country A will benefit if it produces and exports good Y and country B will benefit by specialising in the production and export of good X. In this situation, both countries will benefit from trade (Salvator, 2011).
David Ricardo (1772-1823), further refined Adam Smith’s notion of specialisation and gains from trade. In contrast to Smith, Ricardo emphasised the concept of comparative advantage, which proved that mutually beneficial trade could occur even when one nation was absolutely more efficient in the production of all goods (Salvator, 2011). As did Smith, Ricardo advocated specialisation, although arguing that the pattern of specialisation and trade should be in industries in which they have lower opportunity cost in production. Figure 3.2 below illustrates the gains from trade through specialisation in industries for which a country has a comparative advantage.
25
Figure 3.2 shows the production possibility frontier for country A, which has fixed endowments to produce 200 tons of maize and 100 tons of soybeans per year. The slope of the frontier shows the marginal opportunity cost of producing one commodity (either maize or soybeans) in terms of the amount of the other. For example, the marginal opportunity cost of soybeans in terms of maize is increasing when moving down the PPF. The country has a comparative advantage for the good with the lower marginal opportunity cost (Salvator, 2011).
The main assumptions behind Ricardo’s view were that labour and capital were immobile between countries, and also that costs remained constant as output increased. Without these assumptions, specialisation would not be met (Esterhuizen, 2006). Ricardo’s views were then measured in terms of the labour theory of value, which stresses the role of labour in value creation.
John Stuart Mill (1806-1873) advocated David Ricardo’s view of comparative advantage and further introduced the law of international trade values, arguing that the actual barter terms of trade depend not only on domestic costs, but also on the pattern of demand (Esterhuizen, 2006). Mill’s theory also highlighted that the value of an imported commodity equals the value of the commodity exported to pay for it. Mill concluded that the terms of international exchange depended on the strength and elasticity of demand for each product in the foreign country.
3.2.2 Neoclassical Models
In general, the classical economists concluded that almost all nations could improve the welfare of the population and spur economic growth through international trade. Even today this is still one of the fundamental principles underlying trade agreements and the need to improve the competitiveness of industries. Classical economists recommended free trade and that government should focus on maintaining competitive national markets by investing in public initiatives such as research and education, instead of restricting trade. In the 1900s, international trade theory developed further through the contribution of neoclassical economists. Adam Smith, David Ricardo and John Stuart Mill clearly demonstrated the gains from trade; however, they provided no explanation for differences in productivity (Salvator, 2011). Neoclassical economists, however, attempt to understand
26
and explore explanations for why opportunity costs differ across nations and/or firms. Without such explanations for the rise and fall of major industries, it could be argued that the theory of learning by doing (experience) is the only source of comparative advantage (Masters, 1995).
Eli Heckscher (1919) and Bertil Ohlin (1933) introduced the concept of factor proportions and further developed these into a theory. The basic notion of the Heckscher-Ohlin theorem is that international trade is based on differences in the factor endowments of nations, which means that a nation will have a comparative advantage in, and therefore will export, a good of which production is relatively intensive in the factor with which the country is relatively well endowed (Salvator, 2011). Hecksher-Ohlin concludes that the more abundant the factor, the lower the costs of production. Hence each nation will export the goods intensive in its relatively abundant and cheap factor and import the goods intensive in its relatively scarce and expensive factor. Consequently, all nations will enjoy gains from trade simultaneously.
In 1941, a publication by Wolfgang Stolper and Paul Samuelson led to the introduction of the Stolper-Samuelson theorem (Samuelson, 2005). This theorem contributed to the Heckscher-Ohlin model, which suggests that a change in the price of a good changes, in the same direction and more than proportionally, the price of the factor used intensively in the good’s production. The Stolper-Samuelson theorem highlights that the ratio of trade results to output price changes, which alter real factor rewards, hence creating incentives for nations with abundant input resources to support and nations with scarce input resources to resist moves towards free trade. In conclusion, this theorem presents the relationship between output prices and factor prices within a single country (Samuelson, 2005). This idea will be scrutinised in Chapter 5 when applying the agri benchmark production model, which measures maize production inputs across the leading maize-producing countries.
In 1948, Paul Samuelson further contributed to the Heckscher-Ohlin model by introducing the factor price equalisation model. The model argues that international trade will bring about an equalisation in the relative and absolute returns to homogeneous factors across nations (Salvator, 2011). However, there are certain assumptions that need to hold for factor price equalisation to occur. These are zero transportation costs, no trade barriers and
27
identical technology. The model highlights that foreign investments are not necessary in free trade, assuming foreign investment to be an international transfer of production factors such as technology, labour and capital (Esterhuizen, 2006). It is important to note that the real world brings many market imperfections, which limit the success of the factor price equalisation model. Ossa (1998) highlighted that this is because the model is based on counterfactual assumptions. Moreover, as early as in 1964, some scholars, such as Travis (1964) and Rassekh and Thompson (1993), argued that the ability of trade to equalise factor returns is limited, even if transport costs would be zero.
In 1955, Tadeusz, Mieczyslaw and Rybczynski introduced the Rybczynski theorem, which highlighted that, if an economy produces two goods using two factors of production (i.e. capital and labour), then – under neoclassical technology with constant returns to scale – an increase in its endowment of capital will result in an expansion of the output of the capital-intensive good and a contraction of the labour-capital-intensive good (Rybczynski, 1955). For example, if only labour grows in a nation, then the output of labour-intensive industry will expand more proportionally, while the output of capital-intensive industry will decline (Long, 1992). Esterhuizen (2006) presented an example of economic development in Japan and Korea, which showed that because both these countries have had high savings and investment, they consequently have produced more capital-abundant goods. At the same time, the labour-abundant sectors contracted in both countries, with labour being released into the capital-abundant sectors.
In 1959, Salter and Swan advocated the concept of an exchange rate on international trade and developed the Salter-Swan theorem. The theorem assumes the economy is split into a traded goods and a non-traded goods sector (Adenauer & Vagassky, 1998). The traded goods comprise exportable and importable goods, hence their price is determined in the world market; the non-traded goods are those which do not enter the world market, mainly traded on domestic markets. For traded goods, foreign exchange leads to increasing domestic income; consequently, the added income results in added expenditure on both traded and traded goods. This consequently will lead to labour being drawn to the non-traded goods sector (Adenauer & Vagassky, 1998). On the other hand, goods with high transport costs relative to their real value will be “non-traded”, hence their prices will not be influenced by international trade.
28
3.2.3 Challenges to the Comparative Advantage Theories
The classical and neoclassical models are fundamental to trade theories. However, over time the economies or industries have grown and became more complex, hence making it hard to apply the classical and neoclassical models (Esterhuizen, 2006). In particular, the empirical data on trade flow patterns do not support classical trade theory, the result being the development of alternative techniques that have led to new measurement methods such as the real exchange rate index, the revealed comparative advantage model, net exports index, production costs comparison and market attractiveness index. These methodologies will be discussed in Chapter 4 and some be applied in chapter 5 in assessing the competitiveness of South African maize exports.
In 1951, Wassily Leontief conducted an empirical test of the Heckscher-Ohlin model using United States data for the year 1947 (Leontief, 1956). Leontief’s expectations were in line with the Heckscher-Ohlin model, namely that the United States (the most capital-abundant country in the world) should export capital-intensive goods and import labour-intensive goods; however, the results showed that the United States’ import-competing goods required 30% more capital per worker than its export goods (Esterhuizen, 2006). Leontief’s calculations showed that the US capital-labour ratio was US$14 000 per worker in export goods and US$18 100 per worker in import-competing goods (Esterhuizen, 2006), hence proving the opposite of what Heckscher-Ohlin’s model suggested.
In 1961, just eight years after the introduction of the Leontief Paradox, Stefan Linder recognised the contribution of the Heckscher-Ohlin theory in explaining the supply-oriented theory in the trade of primary products. However, he argued that another explanation was necessary to explain demand-orientated theory (Bukhari, Ahmad, Alam & Butt, 2005). This led to the introduction of the Linder theory, which notes that the pattern of trade derives from “overlapping demand”, which means that countries generally produce goods for the domestic market and then export the surplus (Bukhari et al., 2005). This demand-oriented explanation was in contrast to Heckscher-Ohlin’s view of the supply-oriented factor-endowment theory, which focuses on factor factor-endowments and intensities as sources of comparative advantage and international trade patterns.
29
The demand-oriented theory states that customers are strongly affected by income levels, and therefore a nation’s income per capita determines the kinds of goods they will demand. Furthermore, in a given country, domestic industry will produce goods to meet the domestic demand, and these products reflect a country’s income per capita. A surplus of these goods will eventually be exported. This gave rise to Linder’s view that international trade in manufactured goods will be stronger between countries with similar per capita income levels (Dakal, Pradhan & Upadhyaya, 2009). The Linder theory concluded that the goods that will be traded between countries are those for which there is an overlapping demand.
In 1966, Raymond Vernon introduced the concept of the “product life-cycle”. The product life-cycle assumes that firms tend to be stimulated by the needs and opportunities in the domestic market (Vernon, 1966). The idea behind the theory is that new goods are developed in advanced countries and exported to less-developed countries. The product cycle has three stages, namely new product stage, maturing stage and standardised product stage (Vernon, 1966). In addition, when the production of a good becomes old, production location changes and the comparative advantage ranking is reversed (Marjit, 1989). The product cycle presents two technology-based arguments, noting that technical innovation that leads to new and profitable products involves capital and highly skilled labour. These production factors are mainly available in industrialised nations (capital intensive).
In 1979, Paul Krugman advocated the idea of economies of scale. Economies of scale are generally understood as a situation in which increasing output leads to decreasing costs (Krugman, 1979). Additionally, as firms produce more they learn ways to improve efficiency, hence resulting in a reduction in production costs. Economies of scale make a significant contribution to international trade theory; they show that a nation can become a low-cost producer without having abundance in production factors. Furthermore, the economies of scale explain trade patterns that cannot be explained by the Heckscher-Ohlin theory. The Heckscher-Ohlin theory assumes constant returns to scale; however, the economies of scale postulate that, in production, output will be more than doubled if inputs are doubled (Krugman, 1979).
30
All the theories discussed above remain relevant even today. They serve as a guideline in many nations when they engage in trade policies. However, with globalisation and trade liberalisation, today’s world is more complex, hence cannot be simplified by a single theory.
3.2.4 Relevance of Trade Theories for the South African Maize Trade Environment
The international trade literature comprises mostly theories that are in favour of free trade. Hence, it becomes important to review the relevance of these theories to the World Trade Organization agreements that currently dominate the maize trade environment. Generally, agriculture is among the highly distorted industries. These distortions exist in the form of tariffs, quotas, subsidies and other forms of agricultural support (Nyhodo, 2009). South Africa’s maize industry, for example, currently is under a tariff restriction that is calculated from the world maize reference prices (GSA, 2014a). At the time of the commencement of the study, this reference price was at US$110 per ton.
Subsidies are another form of distortion that still dominates the agricultural industry globally. These refer to the funding that farmers receive from government, regardless of commodity market conditions (Nyhodo, 2009). For example, within the top twenty global maize exporters, some countries and regions, such as the United States and the European Union, receive subsidies or producer support of about 9.8% and 18% respectively. South Africa’s level of producer support is estimated at 2% (OECD, 2015). This means that some countries might have an advantage, relative to others, not because of natural endowment – as suggested by trade theories, but because of government support. It remains unknown if the same outcome would prevail if the same level of support were to be applied across all countries.
3.3 NEW TRADE THEORY SCHOOL OF THOUGHT
The new trade theory was established in the 1980s and comprises a collection of economic models in international trade.3 These models attempt to address the shortcomings of standard trade theory, as highlighted briefly in the section above. This is done by incorporating a number of factors in the analysis that might have been left out of the standard trade theories. These models also serve as a link between comparative advantage and competitiveness.
3