Comparison of Hedging Cost with Other
Variable Input Costs
by
John Michael Riley and John D. Anderson
S d i i f
Suggested citation format:
Riley, J. M., and J. D. Anderson. 2009. “Comparison of Hedging Cost with Other Variable Input Costs.” Proceedings of the NCCC-134 Conference on Applied Commodity Price Analysis, Forecasting, and Market Risk
Comparison of Hedging Cost with Other Variable Input Costs
John Michael Riley and
John D. Anderson1
Paper presented at the NCCC-134 Conference on Applied Commodity Price Analysis, Forecasting, and Market Risk Management
St. Louis, Missouri, April 20-21, 2009
Copyright 2009 by John Michael Riley and John D. Anderson. All rights reserved. Readers may make verbatim copies of this document for non-commercial purposes by any means, provided that this copyright notice appears on all such copies.
1
Riley is an Assistant Extension Professor ([email protected]) and Anderson is an Extension Professor in the Department of Agricultural Economics at Mississippi State University.
Comparison of Hedging Cost with Other Variable Input Costs Practitioner’s Abstract
Recent spikes in commodity prices have led to higher margin amounts and option premiums. For the most part, producers have always attributed their lack of use in reducing risk via futures and options markets to the high cost associated with the use of these markets. This study determines the relative costs of hedging with futures and options and compares these with the costs of other variable inputs. We find that with the exception of hedging corn with both tools and soybeans with options the costs of hedging has only increased at roughly the same rate as all other inputs.
Key Words: Hedging costs, Costs of production, Risk management
Introduction
Recently, US crop producers have experienced a dramatic rise in commodity prices. Corn has increased from $2.11/bu in 2005 to $7.50/bu in July of 2008. A bushel of soybeans in 2005 was valued at $6.08 whereas in July of 2008 it was $16.08/bu. For the past three years cotton prices have ranged from $0.51/lb in 2005 to $0.71/lb in 2008. Chicago Board of Trade wheat prices rose from about $3.24/bu in 2005 to as high as $12.45/bu in July 2008 (similar price movement was seen on Kansas City wheat futures).
While higher output prices and increased yields have led to higher gross revenues for agricultural producers, increasing costs of inputs have been experienced as well. In the past three years agricultural cropland values and rents have increased 41% and 23%, respectively, according to the United States Department of Agriculture (USDA). Fertilizer and diesel fuel prices reported by USDA have increased approximately 110% and 84%, respectively.
At the same time producers have indicated that the costs of using risk management tools have increased at levels far beyond those of other input costs. Given the added volatility markets have experienced recently higher costs related to margin amounts and option premiums is not unusual. However, the rate at which costs associated with hedging has increased is likely lower than producers perceive.
This paper estimates the cost of hedging using futures contracts and options for representative corn, soybean, wheat, and cotton producers. Comparisons are drawn associated to the costs of using these tools with the costs of land rents, fertilizer, fuel, wage rates, chemicals, seed and other variable inputs.
Previous Literature
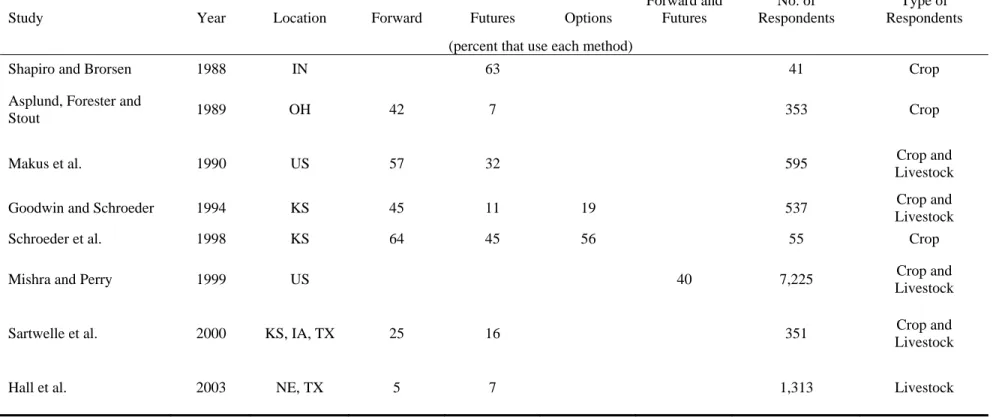
Numerous studies have documented the lack of participation by producers regarding their reduction of price risk. Table 1 summarizes the results from a number of studies that have reported the use of risk management tools by crop and livestock producers and/or industry participants.
Mishra and Perry (1999) state that roughly 40 percent of farmers had used a marketing strategy that included futures or forward contracts. Hall et al. (2003) surveyed Nebraska and Texas producers and found that 5 percent had used forward contracts and 7 percent had used futures and options. Shapiro and Brorsen (1988) found that 63 percent of crop producers in Indiana hedge some portion of their crop. Of the total crop acreage hedged they found that 11.4 percent was hedged using futures contracts and 20.5 percent was forward contracted despite stating that three-fourths of the 41 farmers surveyed were risk averse. The belief of futures markets’ ability to stabilize income was noted as a reason for the lack of using futures and education about futures did not significantly impact futures use.
Makus et al. (1990) surveyed 595 producers across 22 states and found that 32.3 percent had used futures contracts to hedge from 1986 to 1987 and 57.1 percent had used forward
contracting. They found that age, whether the producer was engaged full-time, part-time or a land owner and whether the producer utilized government programs did not significantly affect futures use. The factors that did impact the use of futures were education, farm size, previous use of forward contracting and membership in marketing clubs.
Goodwin and Schroeder (1994) reported that only 10.4 percent of all Kansas agricultural producers surveyed used futures markets and only 8.4 percent of cattle producers hedged with futures contracts. Options on futures were utilized more frequently by cattle producers as 10.1 percent reported they used options. They found that 42.8 percent of producers used forward contracts; however of those surveyed only 11.9 percent of livestock producers forward contracted their cattle. They found farm size, education, crop and input intensity (the level of inputs such as fertilizer chemical used per acre) and debt-to-assets ratio increased the adoption of forward and futures use; however, experience decreased the level of price risk management use. Sartwelle et al. (2000) surveyed producers in Iowa, Kansas and Texas and found that 16 percent used futures or options and 25 percent used forward contracting. Experience was a significant factor in futures use but the number of crop acres, farm size and level of specialization did not have an effect. The amount of acres planted and the level of diversification did have a significant impact on the level of use of forward contracting; however, experience did not impact this use. While a number of reasons have been given for this lack of use of risk management tools, the costs of the tools is often among them. Arias, Brorsen, and Harri (2000) found that the cost associated with hedging greatly impacted wheat and cattle producer’s decision to hedge. For the wheat producer as the cost of hedging goes from 1.4 cents per bushel to 2.8 cents/bu the optimal hedge ratio moves from greater than 60% to less than 20%.
Data
Data on the costs for the various production inputs such as fertilizer, chemicals, land rent, labor, etc. were collected from the Economic Research Service’s Commodity Costs and Returns report for the period 1975 to 2007. Futures and options prices were collected from the database
provided by the Commodity Research Bureau. Harvest contract corn and soybean prices are from the Chicago Board of Trade. Harvest cotton prices are from the Intercontinental Exchange
(formally known as the New York Board of Trade). Harvest wheat prices are from the Kansas City Board of Trade.
Methods
Five representative production practices are used. Corn production is based in central Illinois. Soybean production both in central Illinois and the Mississippi delta is examined. A Mississippi cotton farm is used as a proxy for this commodity. Lastly, wheat production for this study takes place in western Kansas.
Harvest contract information associated with the margin amount and option premiums are determined at the time that planting decisions are made. For all summer grown crops (corn, soybeans and cotton) we assume planting decisions are made on March 15 of each growing year. For wheat producers in western Kansas, we assume these decisions are made on September 1 of each growing year. We assume Illinois corn is harvested in mid October and therefore the December corn contract is considered the harvest contract. Illinois soybeans are assumed to be harvested in late October and thus the November contract is used. For production in Mississippi, soybeans are typically harvested in late August and as such the September contract is used as the harvest time contract. Cotton production in Mississippi is assumed to end in mid November and so the December contract is used for the harvest price information. Lastly, wheat in western Kansas is usually harvested in late June as so the July contract was used as the harvest time contract.
For the five crop production systems four different hedging scenarios will be analyzed. First, no hedge is placed to establish a baseline regarding production costs. Second, a simple straight hedge is analyzed where 100% of the expected production is hedged using futures contracts. Next, a put option hedge is used. Here the producer buys a put option to hedge 100% of expected production. Lastly, a partial hedge is examined. The partial hedge consists of hedging one-third of expected production at planting using futures contracts, hedging another one-third at the middle of the growing season and leaving the remaining one-third unhedged.
The cost associated with each input is calculated as the proportion of total variable cost:
c c i c i TVC COST PROP, = , (1)
where, PROPi,c is the proportion of the cost of input i for crop c, COSTi,c, in relation to the total cost of all variable inputs, TVCc. Costs for all crops excluding cotton are reported in dollars per bushel, cotton is reported in cents per pound. All costs are calculated per bushel (per pound for cotton) at planting, so the expected yield is based on the previous three year average of yield per planted acre.
To determine the amount of margin required to enter into futures contract hedges the following from Lam, Sin and Leung (2004) is used:
where: (3) and
∑
= − = T i i t t R T 1 1 μ∑
= − − − = T i t i t t R T 1 2 2 ) ( 1 1 μ σ (4)The margin amount, MA, is a function of the previous day’s closing price as well as the mean, t
μ , rate of return, R, and the standard deviation of the rate of return, , over T days. Lam, Sin and Leung (2004) state that the Chicago Mercantile Exchange and the Chicago Board of Trade commonly use T=90 days.
2
t
σ
To determine the option premium for all dates from 1978 to 2007, the Black Commodity Option Pricing Model (the Black model) is used (Black 1976). At the money puts are used in this analysis. The Black model is:
(5) ( ) 1 2 ( , ) r T [ ( ) ( )] OP F t =e FN d −SN d where: 2 1 ln ( ) 2 ( ) F T S d T σ σ ⎡ ⎛ ⎞ + ⎤ ⎜ ⎟ ⎢ ⎝ ⎠ ⎥ ⎣ ⎦ = (6) 2 2 ln ( ) 2 ( ) F T S d T σ σ ⎡ ⎛ ⎞ − ⎤ ⎜ ⎟ ⎢ ⎝ ⎠ ⎥ ⎣ ⎦ = (7)
Black’s model uses the current 90-day Treasury bill rate, r, and the time to maturity, T, along with the current futures price, F, option strike price, S, and market volatility, σ , to determine the option premium. Here the volatility measure used is the 120-day historical volatility for each commodity.
Results
The baseline for all crop growing situations is an unhedged scenario calculated based on the prior three year average yield per planted acre. Hedging 100% of the expected crop with futures contracts and options as well as hedging one-third of expected yield at planting and one-third at
the middle of the growing year are then calculated for comparisons. Tables 2 through 6 report the cost associated with each of the variable inputs and the costs of hedging using the described methods on a dollar per bushel basis (cents per pound for cotton).
For the representative central Illinois corn production scenario the majority, 72.5%, of the costs are tied up in land, fertilizer and seed for 2007 (31.3%, 27.2% and 14.0%, respectively). This is common across all years. When considering the cost associated with hedging, prior to 2007 this costs was relatively small. The average margin amount required to take a short position in the futures market from 2001 to 2005 was 4 cents per bushel which is the same amount for 2006. However, in 2007 that cost jumped to 13 cents/bu a 225% increase. Similar findings are seen for the other two hedging scenarios. In the case of a put option hedge, the average premium from 2001 to 2005 was 3 cents/bu and in the 2006 the premium was 2 cents/bu but in 2007 the premium was 13 cents/bu. Not surprisingly, the impact for a partial hedge is less due to less of the crop being hedged and because of a portion being hedged half-way through the growing year. The total costs of the partial hedge (accounting for the margin of the first one-third and the margin amount for the second one-third) were 4 cents/bu for both the average of 2001 to 2005 and for 2006. An increase is still noticed in 2007 as the costs is 9 cents/bu.
Soybean production cost for Illinois is primarily composed of two inputs, land rents and seed. These collectively account for 66.1% of total variable costs, 48.8% and 17.3%, respectively. When hedging costs are factored in these two inputs still dominate in terms of the proportion of total variable costs. The amount of margin for the straight hedge scenario represents 4.0% of the costs, 19 cents/bu, while land rent and seed account for 46.9% and 16.6%, respectively. Prior to 2007 the margin amount was less with the 2001 to 2005 average being 12 cents/bu and in 2006 the amount was 13 cents/bu. Hedging using a put option was more dramatic in its cost increase as the premium from 2006 to 2007 increased 425%, from 4 cents/bu to 21 cents/bu. The partial hedge cost was less dramatic as it increased 40% and 56%, respectively, from the 2001 to 2005 average and 2006. The cost for placing a partial hedge in 2007 was 14 cents/bu.
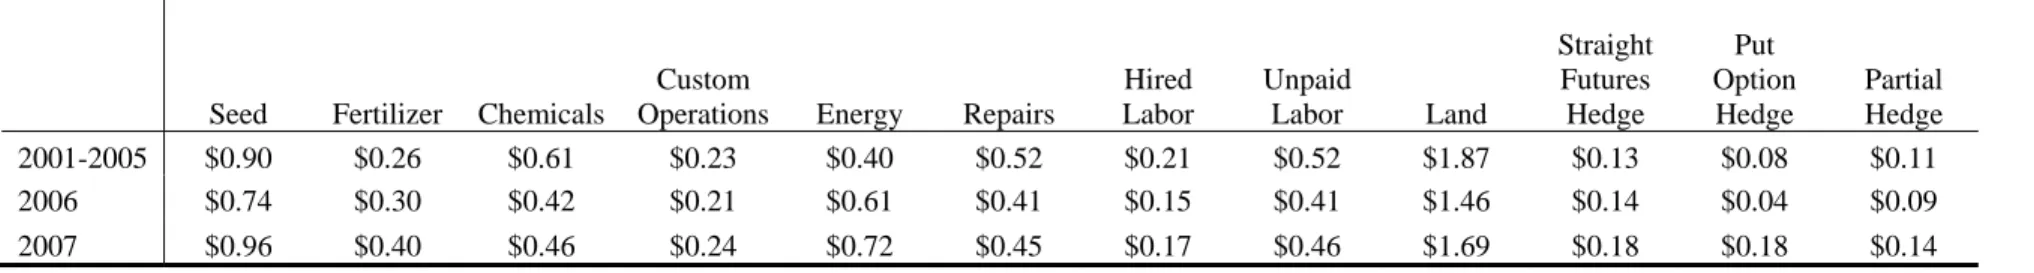
Transitioning from Illinois production systems to Mississippi, in the case of soybeans in 2007 the variable input costs are much more evenly disbursed with none amounting for more than 31% each. In 2007 land rent is the highest contributor to total cost at 30.4%, seed is second highest at 17.3% and energy at 13.0% (fuel, electricity, petroleum based lubricants, etc.) is the only other input accounting for more than 10% of total variable cost on an individual basis. When
considering hedging cost for Mississippi soybean production, as with the case in Illinois, a partial hedging scenario represents the lowest total hedging costs at 14 cents/bu, and a straight hedge is equally as expensive as a put option hedge in 2007 at 18 cents/bu. The partial hedge costs account for 2.5% of total variable costs during 2007 as compared to a 5 year average of 2.2% from 2001 to 2005 and 1.8% in 2006. A straight hedge in 2007 accounted for 3.2% of the total variable cost up from 2.8% in 2006 but below 2004 and 2005, 4.4% and 4.1% respectively. A put option hedge jumped to 3.1% of variable cost in 2007 compared to 0.8% in 2006 and 1.8% in 2005 but still less than that experienced in 2004 when the put option premium accounted for 4.2% of the costs.
Over 75% of the cost of producing cotton in Mississippi in 2007 is comprised of ginning
a straight hedge, a put option hedge and a partial hedge in 2007 accounted for 1.4%, 0.6% and 1.2%, respectively. These values are not much different across all years in the data. The cost of a straight hedge has been decreasing from a high of 2.6% of total variable costs in 2005. The same is true for the other two hedging scenarios where in 2005 the costs associated with a put option hedge was 1.8% of total variable costs and 1.7% for a partial hedge.
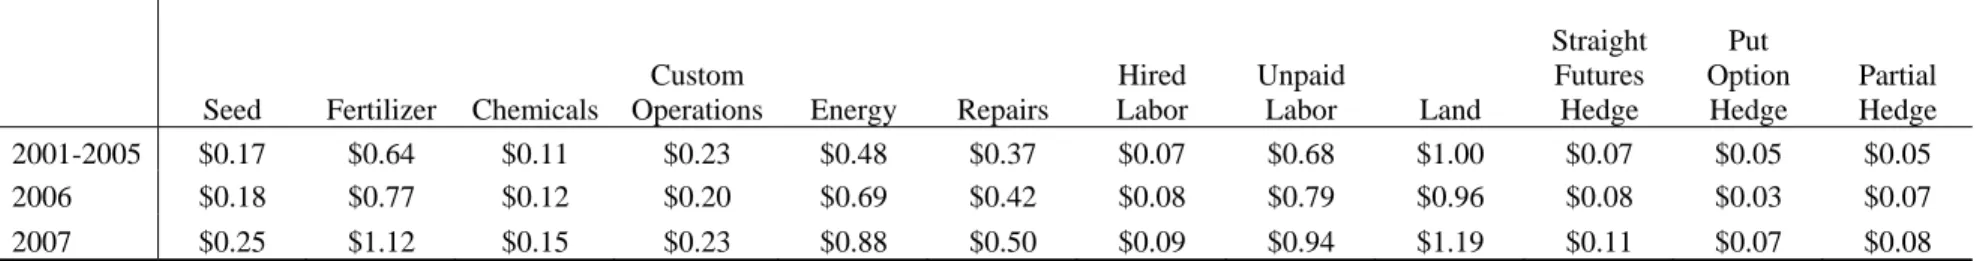
For Kansas wheat production, in 2007 the primary costs are land rent (22.2%), fertilizer (20.9%), unpaid labor (17.6%) and energy (16.4%). A straight hedge in 2007 represented 2.1% of the costs, as compared to 1.9% in 2006 and an average of 1.8% from 2001 to 2005. A put option hedge accounted for 1.3% of costs in 2007 versus 0.7% in 2006 and 1.3% from 2001 through 2005. A partial hedge cost 8 cents/bu in 2007 or 1.5% of total variable cost. This roughly even with the cost of a partial hedge as a proportion of total variable cost in 2006 and the five year average from 2001 to 2005 which was 1.6% and 1.3%, respectively.
Conclusions and Implications
This study compared the rise in the costs of hedging, using different hedging scenarios, to other common variable input costs of production. For the most part the proportion of the cost
associated with hedging has remained relatively consistent across the time period from 1978 to 2007.
The cost of hedging corn has increased more when compared to the other costs in 2007. In 2002, renewable fuel standards were introduced by the US Congress which placed minimum thresholds on the amount of fuels to be derived from renewable resources. Corn used for ethanol was the primary product that fulfilled this minimum amount. So, during this time corn used for ethanol has become closely tied with energy prices, a commodity that is well known for its volatility. Therefore, it is not surprising that this higher volatility has translated into higher prices for margin amounts and option premiums. Therefore, the higher costs associated with hedging corn should not be considered uncommon.
In the case of soybeans for both Illinois and Mississippi production systems the costs of hedging with put options were higher in 2007 relative to previous years. As with corn, this commodity can be used as a renewable fuel source (bio-diesel) and as such has become a more volatile market. The increased volatility is transferred into higher option premiums.
Regarding cotton and wheat hedging costs, these commodities have remained relatively stable through the recent years with cotton hedging costs actually decreasing when compared to other variable input costs.
The perception by producers that the cost of placing hedges with futures contracts and options has increased is true. However, with the exception of corn hedging costs and soybean option hedging cost these have increased at the same rates when compared across all inputs that go into the production of each commodity.
References
Arias, J., B.W. Brorsen and A. Harri. 2000. “Optimal Hedging Under Nonlinear Borrowing Cost, Progressive Tax Rates and Liquidity Constraints.” Journal of Futures Markets 20:375-396.
Asplund, N.M., D.L. Forster and T.T. Stout. 1989. “Farmer’s Use of Forward Contracting and Hedging.” Review of Futures Markets 8:24-37.
Black, F. 1976. “The Pricing of Commodity Contracts.” Journal of Financial Economics 3:167-179.
Goodwin, B.K. and T.C. Schroeder. 1994. “Human Capital, Producer Education Programs, and the Adoption of Forward-Pricing Methods.” American Journal of Agricultural Economics 76:936-947.
Hall, D.C., T.O. Knight, K.H. Coble, A.E. Banquet and G. F. Patrick. 2003. “Analysis of Beef Producers’ Risk Management Perceptions and Desire for Further Risk Management Education.” Review of Agricultural Economics 25:460-448.
Lam, K., C. Sin, R. Leung. 2004. “A Theoretical Framework to Evaluate Different Margin-Setting Methodologies.” Journal of Futures Markets 24:117-145.
Makus, L.D., B.H. Lin, J. Carlson and R. Krebill-Prather. 1990. “Factors Influencing Farm Level Use of Futures and Options in Commodity Marketing.” Journal of Agribusiness 6:621-631.
Mishra, A.K. and J.E. Perry. 1999. “Forward Contracting of Inputs: A Farm-Level Analysis.”
Journal of Agribusiness 17:77-91.
Sartwelle, J., D. O’Brian, W. Tierney, Jr, T. Eggers. 2000. “The Effect of Personal and Farm Characteristics Upon Grain Marketing Practices.” Journal of Agricultural and Applied
Economics 32:95-111.
Schroeder, T.C., J.L. Parcell, T.L. Kastens and K.C. Dhuyvetter. 1998. “Perceptions of
Marketing Strategies: Producers versus Extension Economist.” Journal of Agricultural
and Resource Economics 23:279-293.
Shapiro, B.I., B.W. Brorsen. 1988. “Factors Affecting Farmers’ Hedging Decisions.” North
Central Journal of Agricultural Economics 10:145-153.
United States Department of Agriculture, Economic Research Service. Commodity Costs and
Returns report, multiple issue.
United States Department of Agriculture, National Agricultural Statistics Service. September 2008. Agricultural Prices September 2008.
United States Department of Agriculture, National Agricultural Statistics Service. August 2005.
Land Values and Cash Rents 2005 Summary.
United States Department of Agriculture, National Agricultural Statistics Service. August 2008.
Table 1 Summary of Multiple Studies Reporting Risk Management Usage by Producers
Study Year Location Forward Futures Options Forward and Futures No. of Respondents Type of Respondents (percent that use each method) Shapiro and Brorsen 1988 IN 63 41 Crop Asplund, Forester and
Stout 1989 OH 42 7 353 Crop
Makus et al. 1990 US 57 32 595 Crop and Livestock Goodwin and Schroeder 1994 KS 45 11 19 537 Crop and
Livestock Schroeder et al. 1998 KS 64 45 56 55 Crop
Mishra and Perry 1999 US 40 7,225 Crop and Livestock
Sartwelle et al. 2000 KS, IA, TX 25 16 351 Crop and Livestock
Table 2. Illinois Corn
Seed Fertilizer Chemicals Custom
Operations Energy Repairs Hired Labor Unpaid Labor Land Straight Futures Hedge Put Option Hedge Partial Hedge 2001-2005 $0.24 $0.37 $0.18 $0.07 $0.13 $0.08 $0.01 $0.15 $0.68 $0.04 $0.03 $0.04 2006 $0.27 $0.51 $0.16 $0.06 $0.14 $0.08 $0.01 $0.13 $0.63 $0.04 $0.02 $0.04 2007 $0.31 $0.59 $0.16 $0.06 $0.15 $0.08 $0.01 $0.13 $0.68 $0.13 $0.13 $0.09
Table 3. Illinois Soybean
Seed Fertilizer Chemicals
Custom
Operations Energy Repairs Hired Labor Unpaid Labor Land Straight Futures Hedge Put Option Hedge Partial Hedge 2001-2005 $0.63 $0.19 $0.40 $0.13 $0.18 $0.22 $0.03 $0.37 $2.23 $0.12 $0.08 $0.10 2006 $0.71 $0.28 $0.32 $0.12 $0.25 $0.24 $0.03 $0.32 $2.26 $0.13 $0.04 $0.09 2007 $0.78 $0.32 $0.30 $0.11 $0.25 $0.22 $0.02 $0.30 $2.20 $0.19 $0.21 $0.14
Table 4. Mississippi Soybeans
Seed Fertilizer Chemicals
Custom
Operations Energy Repairs Hired Labor Unpaid Labor Land Straight Futures Hedge Put Option Hedge Partial Hedge 2001-2005 $0.90 $0.26 $0.61 $0.23 $0.40 $0.52 $0.21 $0.52 $1.87 $0.13 $0.08 $0.11 2006 $0.74 $0.30 $0.42 $0.21 $0.61 $0.41 $0.15 $0.41 $1.46 $0.14 $0.04 $0.09 2007 $0.96 $0.40 $0.46 $0.24 $0.72 $0.45 $0.17 $0.46 $1.69 $0.18 $0.18 $0.14
Table 5. Mississippi Cotton
Seed Fertilizer Chemicals
Custom
Operations Energy Repairs Hired Labor
Unpaid
Labor Ginning Land
Straight Futures Hedge Put Option Hedge Partial Hedge 2001-2005 $0.08 $0.06 $0.13 $0.04 $0.03 $0.04 $0.04 $0.03 $0.12 $0.09 $0.01 $0.01 $0.01 2006 $0.09 $0.07 $0.11 $0.05 $0.03 $0.03 $0.02 $0.03 $0.12 $0.08 $0.01 $0.01 $0.01 2007 $0.10 $0.08 $0.12 $0.05 $0.04 $0.03 $0.02 $0.03 $0.13 $0.09 $0.01 $0.00 $0.01
Table 6. Kansas Wheat
Seed Fertilizer Chemicals
Custom
Operations Energy Repairs Hired Labor Unpaid Labor Land Straight Futures Hedge Put Option Hedge Partial Hedge 2001-2005 $0.17 $0.64 $0.11 $0.23 $0.48 $0.37 $0.07 $0.68 $1.00 $0.07 $0.05 $0.05 2006 $0.18 $0.77 $0.12 $0.20 $0.69 $0.42 $0.08 $0.79 $0.96 $0.08 $0.03 $0.07 2007 $0.25 $1.12 $0.15 $0.23 $0.88 $0.50 $0.09 $0.94 $1.19 $0.11 $0.07 $0.08