OPTIMIZATION OF SHOT PEENING
PROCESS PARAMETERS USING
TAGUCHI APPROACH AND
VALIDATION BY DATA MINING
Prof. E.V.RAMANA*
Professor & Head, Department of Mechanical Engineering, Shadan College of Engineering & Technology, Peerancheru, Hyderabad, India
Dr. P. RAVINDER REDDY
Professor& Head, Department of Mechanical Engineering, Chaitanya Bharati Institute of Technology, Hyderabad, India
Abstract
This paper presents the results from a study conducted to optimize shot peening parameters to achieve the highest tensile strength of mild steel. The principal input process parameters were identified by their rank based on signal-to-noise ratios using Taguchi approach. Microsoft Naïve Bayes, Neural Networks and Logistic Regression algorithms available in SQL Server 2008 have been applied to build data mining models based on experimental data related to these principal parameters to predict the tensile strength. The predictions for tensile strength by these models indicate that results are in agreement with experimental values with less percentage of error. It validates the ranking given to input parameters by Taguchi approach.
Keywords Taguchi approach, Data mining, Shot peening, Minitab, Orthogonal Array 1. Introduction
Shot peening is a cold working process used to produce a compressive layer and modify mechanical properties of metal. Peening a surface spreads it plastically, causing changes in the mechanical properties of the surface. It is used on cams, gears, cam shafts, coil springs etc.[1][2] It helps in increasing fatigue life; tensile strength, prevent stress, corrosion and cracking of metal parts. Pressure, mass flow rate, angle of impact, distance from target, time of shot peening, shot size and type etc are some of the factors that have influence in the shot peening process. [3]
Design of Experiments (DOE) is a collection of statistical methods for studying the relationships between input variables (independent variables) and their interactions on a response variable (dependent variable). [4] Full factorial designs require carrying out large number of experiments when number of process parameters increases resulting in high experimental cost and time. Robust design is an engineering methodology for optimizing the product and process conditions which are less sensitive to various sources of variation and which produce high quality product with less developmental cost. [5] Taguchi method provides simple, efficient and systematic approach to optimize designs for performance, quality and cost. [6] He has combined the engineering and statistical knowledge to optimize design and manufacturing processes to achieve high quality at low cost and time. Taguchi technique is an important tool for robust design. It helps to identify the process parameters and their levels to put quality characteristic on target and to limit number of experiments for optimization. [7] Taguchi approach has been used for optimizing resistance spot welding; shielded metal arc welding; surface roughness in turning operation and turning process. [8-11] Data mining techniques are being used for quality prediction and process optimization. It helps to optimize setting of input process parameters to achieve the desired quality level of output.
2. Experimental set up 2.1 Blasting cabinet
The cabinet is fabricated from thick mild steel sheet and lined with 3 mm thick rubber sheets for protection against abrasion.
2.2 Blast nozzle
Tungsten carbide nozzles (2 Nos.) are mounted on telescope arm gun mounting stand for setting the nozzle angle and distance with respect to specimen.
2.3 Fabric dust collector
The dust generated inside blast cabinet is drawn into fabric dust collector. 3. Material
Mild Steel with a tensile strength 679 N/mm2 has been chosen for shot peening operation. 4. Testing equipment
Universal Testing Machine (UTM) was used to measure the tensile strength of the material. 5. Design of Taguchi Experiment
The objective of study was to optimize shot peening process parameters to achieve high tensile strength of the material under study.
5.1 Identification of process parameters and their levels
Sufficient numbers of preliminary experiments were conducted to fix the optimum range for each factor. The range is split into three levels. The following process parameters were selected based on literature survey, experimentation and suggestions of expert. The process parameters and their levels are shown in Table 1. (1) Pressure (bar): Air pressure is used to deliver the stream of shot to the surface of specimen and is directly related to speed of the shot and hence energy transfer from shot to surface of the specimen.
(2) Distance from the target (specimen) (3) Time of peening (sec)
Table 1 Process parameters and their levels for shot peening process
Control Factor Factor code Unit Level 1 Level 2 Level 3
Pressure A bar 4 5 6
Distance B mm 50 100 150 Time C sec 60 90 120
5.2 Orthogonal array
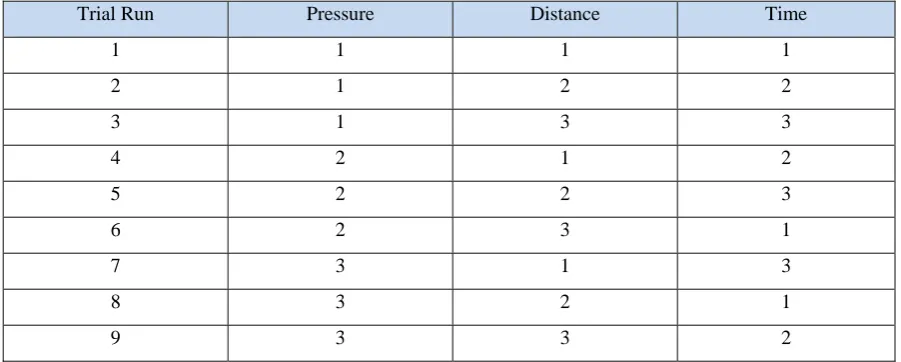
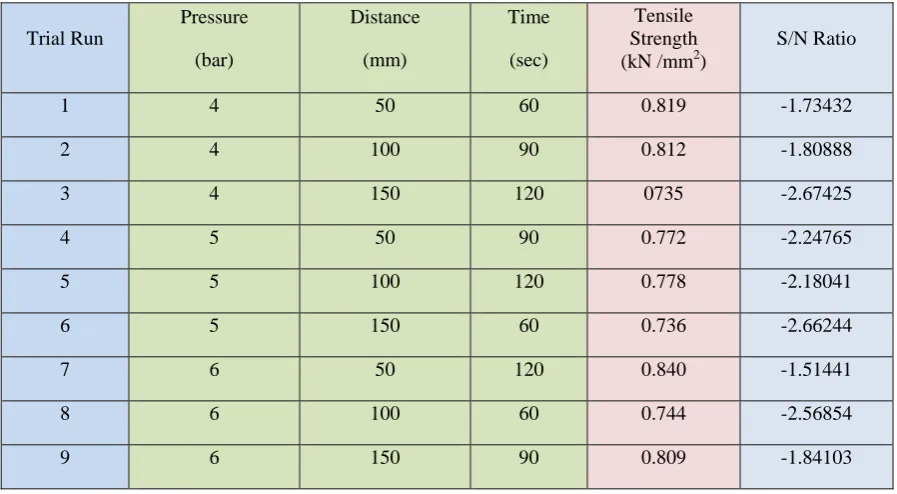
Taguchi’s parameter design has proved to be the most important stage for process optimization. Orthogonal arrays (OA) will determine the least and feasible number of experiments for a given set of factors. Based on number of factors and levels in each factor L9 Orthogonal Array has been selected to satisfy minimum number of experiments condition and levels and is presented in Table 2. This design has reduced number of experiments to be conducted to nine instead of 27 for three factors having three levels with out much compromise in accuracy. Experimental data for tensile strength and S/N ratios are given in Table 3.
Table 2 Standard L9 Orthogonal Array
Trial Run Pressure Distance Time
1 1 1 1
2 1 2 2
3 1 3 3
4 2 1 2
5 2 2 3
6 2 3 1
7 3 1 3
8 3 2 1
Table 3 Standard L9 Orthogonal Array with observations and S/N Ratio
Trial Run
Pressure
(bar)
Distance
(mm)
Time
(sec)
Tensile Strength (kN /mm2)
S/N Ratio
1 4 50 60 0.819 -1.73432
2 4 100 90 0.812 -1.80888
3 4 150 120 0735 -2.67425
4 5 50 90 0.772 -2.24765
5 5 100 120 0.778 -2.18041
6 5 150 60 0.736 -2.66244
7 6 50 120 0.840 -1.51441
8 6 100 60 0.744 -2.56854
9 6 150 90 0.809 -1.84103
6. Results and Discussion
6.1 Signal-to-noise Ratios (S/N Ratios)
Table 4 shows response table for S/N ratios for tensile strength. Signal refers to the change in quality characteristic of a product under investigation in response to a factor introduced in the experimental design. Noise refers to the effect of external factors (uncontrollable factors) on the outcome of quality characteristics.[12] S/N ratios for tensile strength are calculated considering Larger-the-better case using Minitab (Version 15) software. The higher S/N ratio will have more favorable effect of input factor on output. Delta measures the size of effect by taking the difference between the highest and the lowest value for each response characteristic. Rank orders the factors from the greatest effect to the least effect on delta values on response characteristic. Main effect plots show how each factor affects the response characteristic. Fig.1 shows the main effects plot for S/N ratios for tensile strength. Main effects plot for S/N ratios for tensile strength is presented in Fig.1.
Table 4 Response table for S/N ratios for tensile strength
Level Pressure Distance Time
1 -2.072 -1.832 -2.322
2 -2.364 -2.186
-1.966
3 -1.975 -2.393 -2.123
Delta 0.389 0.560 0.356
6 5
4 - 1 . 8
- 2 . 0 - 2 . 2 - 2 . 4
1 5 0 1 0 0
5 0
1 2 0 9 0
6 0 - 1 . 8
- 2 . 0 - 2 . 2 - 2 . 4
A M e a n o f S N r a ti o s B C
M a i n E f f e c t s P l o t f o r S N r a t i o s ( T e n s i l e S t r e n g t h ) D a t a M e a n s
S ig n a l- t o - n o is e : L a r g e r is b e t t e r
Fig.1 Main effects plot for S/N ratios for tensile strength
6.2 Optimum process parameters for tensile strength
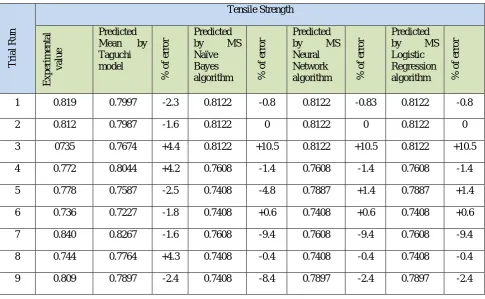
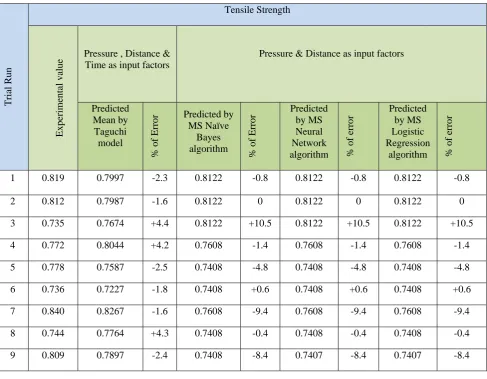
Main effects plot for S/N ratios as shown in Fig.1 depict the effect of factors on tensile strength. The optimum levels for the highest tensile strength are at a distance of 50 mm, pressure of six bar and time of 90 seconds. Distance and pressure were identified as principal factors for tensile strength as per the ranks based on delta values of S/N ratios given in Table 4. Predictive models have been created based on MS Naïve Bayes, Neural Network and Logistic Regression algorithms available in SQL Server 2008. These data mining models were used in predicting tensile strength of specimen by considering pressure, distance and time as input factors in the first instance. Later prediction has been made by taking principal factors i.e. pressure and distance into consideration in the second instance. Experimental values of tensile strength are compared against predicted values obtained by applying data mining algorithms and Taguchi model for each trial run for both the instances mentioned above. Percentage of error in predictions by these models for tensile strength in the first and second instance was presented in Table 5 and Table 6 respectively. The maximum error in prediction is 10.5% and taking into other values that have less error, experimental and predicted results are in good agreement for both the instances. This analysis assures that rank assigned for each factor by Taguchi model is appropriate.
Table 5 Prediction of tensile strength by Taguchi and data mining models considering pressure, distance and time
Trial Run Tensile Strength Ex peri me nt al val u e Predicted Mean by Taguchi model % of er ro
r Predicted by MS
Naïve Bayes
algorithm % of
er
ro
r Predicted by MS
Neural Network
algorithm % of
er
ro
r Predicted by MS
Logistic Regression algorithm % of
er
ro
r
1 0.819 0.7997 -2.3 0.8122 -0.8 0.8122 -0.83 0.8122 -0.8
2 0.812 0.7987 -1.6 0.8122 0 0.8122 0 0.8122 0
3 0735 0.7674 +4.4 0.8122 +10.5 0.8122 +10.5 0.8122 +10.5
4 0.772 0.8044 +4.2 0.7608 -1.4 0.7608 -1.4 0.7608 -1.4
5 0.778 0.7587 -2.5 0.7408 -4.8 0.7887 +1.4 0.7887 +1.4
6 0.736 0.7227 -1.8 0.7408 +0.6 0.7408 +0.6 0.7408 +0.6
7 0.840 0.8267 -1.6 0.7608 -9.4 0.7608 -9.4 0.7608 -9.4
8 0.744 0.7764 +4.3 0.7408 -0.4 0.7408 -0.4 0.7408 -0.4
Table 6 Prediction of tensile strength by Taguchi and data mining models considering pressure and distance
Trial Run
Tensile Strength
Ex
peri
me
nt
al
v
al
u
e Pressure , Distance & Time as input factors Pressure & Distance as input factors
Predicted Mean by Taguchi
model
% of
Er
ro
r Predicted by MS Naïve
Bayes algorithm
% of
Er
ro
r Predicted by MS
Neural Network algorithm % of
er
ro
r Predicted by MS
Logistic Regression
algorithm % of
er
ro
r
1 0.819 0.7997 -2.3 0.8122 -0.8 0.8122 -0.8 0.8122 -0.8
2 0.812 0.7987 -1.6 0.8122 0 0.8122 0 0.8122 0
3 0.735 0.7674 +4.4 0.8122 +10.5 0.8122 +10.5 0.8122 +10.5
4 0.772 0.8044 +4.2 0.7608 -1.4 0.7608 -1.4 0.7608 -1.4
5 0.778 0.7587 -2.5 0.7408 -4.8 0.7408 -4.8 0.7408 -4.8
6 0.736 0.7227 -1.8 0.7408 +0.6 0.7408 +0.6 0.7408 +0.6
7 0.840 0.8267 -1.6 0.7608 -9.4 0.7608 -9.4 0.7608 -9.4
8 0.744 0.7764 +4.3 0.7408 -0.4 0.7408 -0.4 0.7408 -0.4
9 0.809 0.7897 -2.4 0.7408 -8.4 0.7407 -8.4 0.7407 -8.4
7. Conclusions
The following conclusions are drawn based on experimental results and analysis:
(1) Distance was the most influencing factor for mild steel to achieve high tensile strength in shot peening process followed by pressure and time of shot peening. The optimum settings for tensile strength are Distance (50 mm), Pressure (6 bar) and time (90 sec).
(2) Taguchi approach shall be applied to identify principal parameters among large number parameters involved in any complex manufacturing process with less experimental cost and time. The process data can be collected related to these parameters for a considerable period of time. Data mining models built on this accumulated process data help to predict the desired quality characteristic, optimum setting of process parameters and to determine the influence of interactions among the factors.
References
[1] Shot Peening, Tool and Manufacturing Engineers Handbook (TMEH), Vol. 3, Society of Manufacturing Engineers, 1985 [2] Shot Peening Applications Guidebook, Metal Improvement Company, NJ, USA
[3] Lassihiotakis. D et al, Optimising shot peening parameters using DoE, Design unit, University of Newcastle, UK
[4] Howard S. Gitlow, Alan J Oppenheim, Rosa Oppenheim, David M Levine, Quality Management, McGraw-Hill, 2009, pp.427-429 [5] Phadke M.S, Quality Engineering Using Robust Design, Dorling Kindersley publishing, Inc., India, 2008, pp.250
[6] W.H. Yang, Y.S. Tang, Design optimization of cutting parameters for turning operations based on Taguchi method, Journal of Materials Processing Technology, 84, 1998, pp122-129
[7] Jaharah A. Ghani, et al., Philosophy of Taguchi Approach and method in Design of Experiment, Asian Journal of Scientific Research, 6(1), pp,27-37, 2013
[8] A.K.Pandey, M.I.Khan and K.M.Moeed, Optimization of Resistance Spot Welding Parameters using Taguchi method, International Journal of Engineering Science and Technology, Vol.5(2), Feb, 2013, pp.234-241
[9] B.S.Praveen Kumar, Dr.Y.Vijayakumar, Optimization of Shielded Metal Arc Welding Parameters for welding of Pipes by using Taguchi Approach, International Journal of Engineering Science and Technology, Vol.4(5), May, 2012, pp.2083-2088
[10] H.M.Somashekara, Dr.N.Lakshmana Swamy, Optimizing surface roughness in turning operation using Taguchi technique and ANOVA, International Journal of Engineering Science and Technology, Vol.4(5), May, 2012, pp.1967-1973
[11] Krishnant et.al, Application of Taguchi method for optimizing turning process by the effects of machining parameters, International Journal of Engineering and Advanced Technology, Vol.2(1), Oct, 2012, pp.263-274