Article
Sound Archaeology: A Study of the Acoustics of
Three World Heritage Sites, Spanish Prehistoric
Painted Caves, Stonehenge, and Paphos Theatre
Rupert Till
Department of Music and Drama, University of Huddersfield, Huddersfield HD1 3DH, UK; [email protected]
Received: 22 April 2019; Accepted: 23 July 2019; Published: 9 August 2019
Abstract:This paper explores the acoustics of three UNESCO World Heritage Sites: five caves in Spain that feature prehistoric paintings that are up to 40,000 years old; Stonehenge stone circle in England, which is over 4000 years old; and Paphos Theatre in Cyprus, which is 2000 years old. Issues with standard acoustic methods are discussed, and a range of different possible approaches are explored for sound archaeology studies, also known as archaeoacoustics. The context of the three sites are examined followed by an analysis of their acoustic properties. Firstly, early decay time is explored, including a comparison of these sites to contemporary concert halls. Subsequently, reverberation, clarity of speech, and bass response are examined. Results show that the caves have a wide range of different naturally occurring acoustics, including reverberation, and strong bass effects. Stonehenge has acoustics that change as the design of the site develops, with some similarities to the effects in the caves. Acoustic effects vary considerably as you move further into the centre of the stone circle, and as the stone circle develops through time; these effects would be noticeable, and are a by-product of the human building of ritual sites. At Paphos Theatre, acoustics vary from the best seats on the front rows, backwards; here, the architects have considered acoustics in the design of the building. The paper illustrates the changing acoustics of ritual sites in human cultures, showing how sound contributed to giving spaces an individual character, helping to afford a sense of contextualized ritual place.
Keywords: sound; archaeology; archaeoacoustics; acoustics; reverberation; clarity; Stonehenge; cave; theatre; EDT; music
1. Introduction
This paper asks how one best studies the acoustic ecologies of archaeological spaces? Are standard acoustics methods appropriate in such sound archaeology or archaeoacoustic research? It explores how acoustics in sites that feature ritual use change through different stages of human culture, from Palaeolithic painted caves in Northern Spain, with a context dated from 43,000 years in the past, through the monumental 5000-year-old architecture of Neolithic Stonehenge in Britain, to the public theatres of Roman culture, in Paphos on the Mediterranean island of Cyprus. All three are UNESCO World Heritage sites, and the paper explores what the changes in the acoustic effects present suggest about how human culture changes over time. It asks what problems are encountered when examining the acoustics of ancient sites. The three sites are contextualised—prehistoric caves in Spain, Stonehenge, and Paphos Theatre—followed by a metrical analysis of their acoustics, before finishing with conclusions.
To comprehensively explore changes in acoustics over time in antiquity would take a large-scale project with many more examples, which is beyond the scope of the present study. Instead, metrical results are generated through the author’s study of the acoustics of these three archaeological spaces, and are compared in order to illustrate both to what extent they differ, and the range of acoustics
present in different archaeological contexts and periods. This paper provides a number of novel perspectives. While previous studies of the acoustics of these and other archaeological sites have provided a range of results, this paper provides for the first time a comparison of different archaeological eras and contexts, and of acoustic metrics, such as early decay time (EDT), clarity, speech transmission, consonant intelligibility, and bass ratio. The key measure of perceived reverberation, early decay time, is discussed in some detail, and compared to results for modern concert halls, exploring results across a wide frequency range, rather than the restricted averages often referred to within industrial acoustics. The limitations imposed by approaches, such as this averaging, are discussed, and the effects are discussed of adopting an uncritical application to archaeological contexts of the standard acoustic state of the art as used in contemporary industrial research. The comparative study of three different sites illustrates the challenges for standard acoustics methods of working within this field, and provides examples of how and why one might construct a bespoke acoustics study method for these sites. Comparison is made between the caves explored, something a previous study did not consider. Acoustics of a digital model of Stonehenge at a number of receiver positions within three different phases of development of the monument are discussed. No previous study of Stonehenge has explored the acoustics of a range of receiver positions, or of the various arrangements of stones of this iconic site. Paphos Theatre has never been studied acoustically, and in general, there have been no studies comparing Greek or Roman ancient performance venues to modern concert halls. As well as adopting empirical quantitative approaches, this project includes a qualitative comparative assessment of the sites being studied, as is appropriate when studying the experience of sound within ritual sites, and working within an interdisciplinary field that addresses archaeology, sound, and music, as well as scientific acoustics.
2. Materials and Methods
2.1. Problems with Standard Acoustic Methodology
which archaeoacoustics and sound archaeology have emerged. It is proposed that discussion of the author’s experiences during fieldwork is appropriate content for this study.
Architectural acoustics has traditionally focused on issues related to industrial practice, such as concert hall design, traffic noise, and health and safety issues. It has as a result a range of standards, leading to a number of assumptions and set practices in standard acoustics methods. These can be problematic when using acoustics to study archaeological sites. For example, Long [10] suggests that “in a room whose dimensions are large enough that there is a sufficient density of modes, it is customary to describe the space in terms of a statistical model known as a diffuse field.” (p. 327). In a diffuse field it is expected that a similar acoustic result will occur, independent of the positioning of the source of sound, or receiver, as no matter where you make the sound or hear it, reverberation is considered as consistent across the space. Such simplification is appropriate for standard acoustics purposes, in modern buildings with regular shapes.
Archaeological sites often have a complex or irregular shape, and as in any space, an experience of acoustics can vary considerably depending on listening (receiver) position, and where sound is being made (source position). Although it is customary in acoustics to assume a diffuse field, this assumption overlooks the range of sonic experiences possible for an individual within such a field. Modal effects can mean that sound near a wall is different from that in the centre, and unusually shaped rooms can have odd and varied frequency and amplitude responses. In archaeological sites, a large number of measurements may have to be taken if one wishes to comprehensively understand the acoustics of the space, for example focusing on positions of particular interest, perhaps with important archaeological features, or that seem to be a particular focus of activity.
Standard acoustics approaches often act to remove measurement of variation, aiming in many cases for an averaged result. BS EN ISO 3382-1:2009 is the British Standard for Acoustics–Measurement of Room Acoustic Parameters Part 1: Performing Spaces [11]. This describes the state of the art of engineering standards for acoustic measurement practice, which is well-known and thus not described in detail in this study, other than where sound archaeology necessitates an alternative approach. It is a useful document for commercial purposes, to enable comparable standardised results, or to describe a contemporary performance space, but can be problematic for a forensic analysis of the acoustics of an archaeological site. A cave or temple is not a performance space per se, but this standard is referred to as such sites are closer in use than to the other available options for such standards, such as a room, office, or laboratory.
The standard raises the issue of “whether single spatial averages will adequately describe the room” (p. 5), and suggests that if “the room is likely to show areas with differing reverberation times, these shall be investigated and measured separately” (p. 6). The standard suggests this option for spaces that do not feature a diffuse field, but the averaging of results is the more common practice, and no definition is provided of how different reverberation results have to be, to require individual consideration of a range of source and receiver positions. The standard requires that “a minimum of two source positions shall be used” (p. 5). It suggests (p. 20) that 6 different microphone/receiver positions are needed for a venue with 500 seats, and 10 positions are required for a venue with 2000 seats. These suggestions are for a performance space, and an archaeological site with no seats requires different consideration. The multiple source and receiver results are usually averaged; “it is necessary to average over a number of measurements at each position in order to achieve an acceptable measurement uncertainty” (p. 7). In a sound archaeology project, this study suggests that both individual and averaged results should be considered, as uncertainty is often present in any case, and certainty is not the only focus. The intention of the standard is to establish a result that describes an overall impression of a space, whereas sound archaeology may be interested in a detailed identification of the variation and distribution of different acoustic effects present, and in results in individual positions of archaeological significance.
an acoustic measurement (p. 3). In a sound archaeology study, one might be additionally interested in results where the source and receiver are in the same place (to mimic a performer making sound and hearing it themselves), are far away from one another, or where one or the other are moving. Proximity to a wall or floor can significantly affect the frequency response recorded, as there might be more early reflections present as a result; near a curved wall, the sound may be different than next to a straight wall. In the standard, the “distance from any microphone position to the nearest reflecting surface, including the floor, shall be at least a quarter of a wavelength, i.e., normally around 1 m” (p. 5). If one is interested in the sound next to a cave painting, sound made by scraping a prehistoric engraving into the wall, the sound made by a drum placed on the floor, or by the strange effects created by singing next to a particular surface, one might need to change this standard practice. An assessment method based on sources and receivers at set distances assumes a standard separation between a performer and an audience, a contemporary Western paradigm that is not shared in all archaeological contexts, where participation may be the norm. Although it is acceptable in acoustics to deal with a venue as though it were empty, if one wants to understand people’s experience of acoustics, it may be more relevant to explore a venue’s acoustics with an audience present, something that is problematic due to audience noise.
Reverberation is described with a standard metric, such as T30 or early decay time (EDT), as a set value, an invariant amount that never changes. Consideration of early reflections allows EDT to provide a better indication of perceived reverberance than T30 [12] and may be more useful as a result in some sound archaeology contexts. Reverberation varies at different frequencies and may be longer or shorter at lower bass frequencies. Acoustic studies usually state the reverberation time at 1 kHz, or as an average of results at 500 Hz and 1 kHz [11] (p. 10). In a workplace, these frequencies are significant because mid-range frequencies are most likely to damage hearing, whereas low frequencies are less problematic. The standard recommends that the range from “at least 250 to 2000 Hz” is examined, and for “engineering and precision methods, the frequency range should cover at least 125 to 4000 Hz in octave bands or 100 to 5000 Hz in one-third octave bands”. At an archaeological site, one might be interested in, for example, whether reverberation at low frequencies is unusually long, or whether or not mid-range reverberation is significant; as we will see in a later section, at Stonehenge, there are frequencies of interest well below 100 Hz.
Digital acoustic modelling software is sometimes used within acoustical studies to predict acoustic effects. It can be used to analyse the original effects present where an archaeological site is no longer present or is damaged or altered. Murphy et al. [13] discusses auralisation, using digital tools to represent the acoustics of spaces using digital acoustic models. Weitze et al. [14] discusses acoustic modelling of Hagia Sofia in Istanbul. Details of a site are often simplified in such modelling to provide an approximation, but when exploring the acoustics of an archaeological site, one may be interested in the effect of the detail of the architecture. Such modelling programmes have certain deficiencies. For example, the Odeon acoustic modelling programme used in this project is excellent for high frequencies, but it is ineffective at some low frequencies and as a ray-tracing method becomes problematic when the length of the rays is close in magnitude to the wavelength of the source sound. Odeon’s digital acoustic modelling software competitor CATT Acoustic, uses the same modelling method, and exhibits similar issues.
such standards inevitably means compromises. Dodecahedron loudspeakers are designed to be omnidirectional, to radiate sound equally in all directions. This directionality is adequate for testing for compliance to standards, but because the speakers need to be small so that a number can be fitted into one housing, as the enclosure’s design is optimised for directionality and in terms of meeting the ISO standard, the frequency response is not flat across a wide frequency range, often dropping offat low and high frequencies. For example, the NTi Audio DS3 dodecahedron loudspeaker, though an excellent sound source in many ways, has a frequency response that drops offabove 10,000 Hz and below 100 Hz [16].
For measurement of archaeological acoustic spaces, Murphy [17] proposes the use as a source of a recording studio reference monitor loudspeaker that has a flat frequency response, accompanied by a sub-woofer speaker, in addition to a dodecahedron. This is intended to balance the accuracy of directional and frequency responses; however, this approach creates other difficulties. Murphy’s setup was designed to systematically capture the acoustic character of an individual site. This method uses a microphone placed on a revolving turntable to capture impulse responses from various directions. This generates a large amount of data about a single source and receiver position. Like any method, it has advantages and disadvantages. It only records a single pair of source and receiver positions, and results could be different in other positions. Murphy goes on to describe (p. 224–225) how his approach captured an accurate representation of the centre of Scottish prehistoric monument Maes Howe, identifying that in the 125 Hz octave band, reverberation is significantly higher. Though a very useful approach, the study did not address the acoustic behaviour in the side chambers of the monument or in the entrance passage. It identifies modal resonant frequencies but does not discuss a range of comparative levels, nor does it present a comprehensive frequency response of all of the space. Murphy’s method takes a considerable length of time to carry out one set of measurements, and such a large a complex set up is time consuming to move. At some archaeological sites, there may be very limited time available. In some cases, archaeologists restrict access in order to protect the site. In other cases, limited time is available where no other people (and resultant noise) are present, often due to the site being open to the public. Time may also be restricted due to the battery life of equipment where other power sources are not available, or because there is limited stafftime available. An acoustic study in Malta by the author [18], for example, presented many of these issues, in part because the study explored the acoustics present in different parts of the monument.
Murphy discusses the work of Jahn et al. [19], which examined a number of UK passage grave or chamber tomb monuments similar in type to Maes Howe, such as Wayland Smithy. This earlier study swept the frequency of a sound source to identify modal frequencies with a hand-held soundmeter. It also attempted to calculate resonant frequencies of the spaces theoretically, with some limited success; although results were sometimes within 10% of the frequencies measured, they were never the same. This older method illustrates the advantages of the use of modern portable digital equipment, and techniques from the ISO standard. Jahn et al. do not provide the frequency response of the loudspeaker, and one cannot thus assess whether it accurately stimulated all frequencies; in addition, subjective opinion is used to identify the most powerful resonances present. Although various receiver positions are used, only one source position is used, and in trying to calculate theoretically the various parameters, approximations are made of the size of the spaces, with curved three-dimensional surfaces theorised as cubes. On the other hand, the study does effectively report a sense of human perception of the acoustics of a number of spaces.
similarly challenging. In other studies by the author, the size of equipment and access have also been problematic: a generator used to power equipment was noisy in one situation and affected recordings and testing; in another study, the generator broke down, meaning no further measurements could be taken; power was not available in a number of archaeological sites; moving a bulky loudspeaker set-up between measurements has proven time-consuming in archaeological sites, where available time is often restricted; and setting up and moving large equipment has proven difficult where there are fragile archaeological remains present.
Any single archaeoacoustic approach does not always work for all situations, no matter how rigorously it is created. When trying to understand the individual behaviour of the acoustics of an archaeological site, an approach is needed that is designed around specific research questions, and the individual conditions of the site, with qualitative as well as quantitative analysis where necessary. This is especially the case where one is exploring sites from the ancient past, for example, in prehistoric sites, where much is unknown or uncertain. In such cases, we must move beyond the fixity of standard methods, and design a methodology that suits the particular context and captures a range of experiences of acoustics in the space, while maintaining scientific rigour and using as much of the state of the art as possible. Sound archaeology is a young field, and approaches to methods used in research studies continue to need further exploration in order to balance these issues successfully.
2.2. The Sites
This project focuses on three archaeological sites: Caves in northern Spain, Stonehenge, and Paphos Theatre in Cyprus. The caves are part of the Cave of Altamira and Paleolithic Cave Art of Northern Spain UNESCO World Heritage Site, a large group of caves that feature Palaeolithic paintings and engravings. The caves explored are El Castillo, Las Chimeneas, La Pasiega, and La Garma in Cantabria, and Tito Bustillo in Asturias. They were selected by Dr. Roberto Ontanon (Director of the History and Archaeology Museum, Santander) to represent a range of different contexts. Stonehenge is a well-known Neolithic stone circle in Southern England, and also a World Heritage Site. Various phases of this site’s development are examined. Paphos Theatre in Cyprus, or the Hellenistic-Roman theatre of Nea Paphos, was built around 300 BC, and was used until around 365 AD. It had seating for 8000 spectators and is again a World Heritage Site.
2.2.1. Caves
The caves studied feature paintings from as long as 43,000 years ago, a tradition of decoration with visual motifs that continues until the end of the Magdalenian period, 12,000 years ago. The five caves included have various features. La Garma was discovered comparatively recently in 1995, and is in pristine condition, as it was left when the entrance collapsed in prehistory. A point at the far end of the caves system from the original entrance featuring hand-shaped markings was selected for the present paper, next to a deep recess leading down to an underground river. Las Chimeneas features a small side chamber, with distinctive black paintings. La Pasiega was sampled in two positions, in a small turret-like feature filled with paintings, and at the end of a corridor that features many more paintings; overall, the cave features long narrow tunnels. These three caves are little changed and are closed to the public. El Castillo and Tito Bustillo are large publicly accessible show caves. El Castillo has a series of connected chambers and side sections, one of which was chosen for this study; this has the oldest dated cave painting, a red dot that is more than 40,000 years old [20]. Tito Bustillo has large chambers connected by corridors, and features small secluded side chambers; a position is featured here next to polychrome paintings of horses, again near a drop to an underground river. The Songs of the Caves multi-disciplinary project (SOTC) set out to explore relationships between the acoustics of the caves and positioning of paintings. Two existing publications [4,15] provide further contextual information about the caves as well as relevant archaeological references.
explored a number of caves in France and elsewhere, suggesting that paintings were placed in response to acoustic effects, including reverberation, echo, and low frequency resonance, which he stimulated with his low bass singing voice. His methodology was not published in detail; he did not include any kind of statistical study, providing indicative rather than conclusive or empirically evidenced results. While this is a somewhat speculative assertion, the evidence found by SOTC in Spain supports this hypothesis to some extent, establishing a statistical relationship between cave art and acoustics, and suggesting that in some of these examples, it is feasible that modal effects present at least contributed to the selection of these particular sites. In order to understand the relationship between acoustic effects and the placement of visual motifs, a wider scale comprehensive assessment of caves in Northern Spain and Southern France would be necessary, which would need to account for other notable features or causes that could have inspired decoration.
Diaz Andreu and Garcia Benito also explored the relationships between rock art and acoustics, and used a whistle and observation of what was heard in a range of source and receiver positions, to map acoustic effects present in an outdoor site featuring rock art. This approach lacked the ability to generate acoustic metrics, but identified evidence of a link between echoes and the presence of rock art in a Spanish valley [23]. More recently, Diaz Andreu led the Artsoundscapes project [24], and explored technical approaches to studying the relationships between rock art and sound [25]. In Scandinavia, Rainio et al. [26] have explored the relationships between rock art and acoustics.
SOTC captured more than 200 impulse responses in the caves, either next to Palaeolithic paintings or carvings, or in control positions with no visual motifs. Details of archaeological context were recorded in each position, and logistic regression analysis was used to examine whether there were statistical relationships between acoustical and archaeological features. The study found a statistical association: “between acoustic response and the positions of Palaeolithic visual motifs (. . . ) in these caves. Our primary conclusion is that there is statistical, although weak, evidence, for an association between acoustic responses measured within these caves and the placement of motifs. We found a statistical association between the position of motifs, particularly dots and lines, and places with low frequency resonances and moderate reverberation” [15]. SOTC indicated that acoustics were in some way linked to the caves better-known tradition of visual motif-making. The earliest known human musical instruments were also found in Palaeolithic caves [27], such as the Hohle Fels and Isturitz vulture bone flute-like pipes that date from c.40 to 30,000 BC, and a range of evidence suggests that sound played an important role in the ritual life evidenced by the cave art in this period.
A detailed account of the acoustic methodology used for collecting impulse responses has been published [4,15], and these collected responses were used for generating the acoustic metrics for caves discussed in this study. Sine sweep test signals were generated through a portable powered loudspeaker that had been characterised in an anechoic chamber, using WinMLS software on a laptop, results captured with a soundcard and small diaphragm condenser microphones. A dodecahedron was not used as it would have been too large, a smaller Bang and Olufsen Beolit speaker provided a source with an appropriate balance of portability, fidelity, and directionality. Two high quality DPA microphones captured two impulse responses at a time. These models are designed for recording studio rather than acoustics use and were used as they are more robust than traditional acoustics capsules, while being appropriately flat in frequency response. As the system was characterised in an acoustics lab before use, the measurement system could account for any irregularities. Further information is available on the project website [28]. In the present paper, one illustrative position that features interesting acoustics as well as significant cave paintings was selected from each cave. This is intended to provide a qualitative comparison between the acoustics in these caves and in other sites, in order to indicate some general trends, and illustrate the range of acoustical effects present at archaeological sites.
2.2.2. Stonehenge
number of significant burials. It was used in the past for ritual activities that are related to the winter solstice, and is to this day the site of solstice celebrations in summer and winter. Darvill [31] suggests that Stonehenge was related to healing; in many cultures, rituals relating to healing, astronomy, ancestor worship, or the dead are related, and many such rituals use sound and music as a key element [32]. Research on the acoustics of Stonehenge was inspired by a pilot study by Aaron Watson [33,34], which showed that there were acoustic effects present at the present-day monument. Further study by the author [35,36] analysed the acoustics present in the final arrangement of the original complete monument, pointing out low frequency resonances, echoes, and reverberation. Field studies by the author with the acoustics researcher Bruno Fazenda [37,38], analysed the Maryhill Monument, a full-size concrete Stonehenge model in the United States, which has an approximately similar design. That research identified higher reverberation than in the remaining monument, and a powerful low frequency resonance at 47-48 Hz; similar low frequency modal effects are discussed further below. The small amount of reverberation and echo present is something that was described long ago by Thomas Hardy in his novel Tess of the D’Urbervilles [39]. Fazenda confirmed the presence of weak echoes and a small amount of reverberation in a further study [37]. It focused on ISO standard approaches, and did not discuss in detail low frequency reverberation time (although this is reported in a table), nor did it discuss the differences between results from different source positions or phases of the monument. The present study focuses on Stonehenge itself, rather than the concrete part-replica in Washington, DC, USA.
Stonehenge was examined in three different arrangements, using constructed digital models that draw upon a range of archaeological sources, in particular those of Parker Pearson [29,30] and Darvill [31]. A joint article involving both these researchers [40] laid out the complex sequence of Stonehenge’s construction. The phases selected in the present study demonstrate the difference between an early version of the space with a large circle of bluestones, an arrangement of Sarsen stones, and a representation of the final state of the monument. Rather than following one of the various existing archaeological numberings of phases, in the present paper, the models presented are referred to simply as Stonehenge digital models A–C. The first phase modelled by the team, dated c.3000 BC, is not discussed. Only a single large stone, the Heel Stone, may have been present at this time, along with a ditch and bank. This phase has few acoustic effects, other than that the ditch and bank isolate the space acoustically to some extent from what is outside. Three subsequent phases of building were digitally modelled graphically and acoustically. The first is dated c.2900 BC (Stonehenge A), and sees the introduction of Bluestones, mostly spotted dolerite from Wales, which were erected in a large circle in what are now called the Aubrey holes, inside the Stonehenge circular ditch and bank (a reverse arrangement of a bank enclosing a ditch, which is what characterises a henge). This was a single wide circle of stones. Each stone reflects sound, and the combined result creates unusual effects in the centre, and varied acoustics across the space. A second digital model based on the arrangement of stones at around 2500 BC (Stonehenge B) sees the Bluestones removed, and replaced with large local Sarsen stones, including huge pairs of upright stones called Trilithons with lintels across the top, and an outer ring capped by a ring of lintels. A third and final phase is modelled, dated at 2200 BC (Stonehenge C), which sees the Bluestones returned in circular patterns amongst the Sarsen stones.
interactively modelled audio-visually within this app, allowing the user to see and hear what it might have been like to be in these sites in the past. The impulse responses were imported into Odeon software, which was used to generate a range of acoustic metrics describing the site quantitatively. These metrical results are discussed within this article.
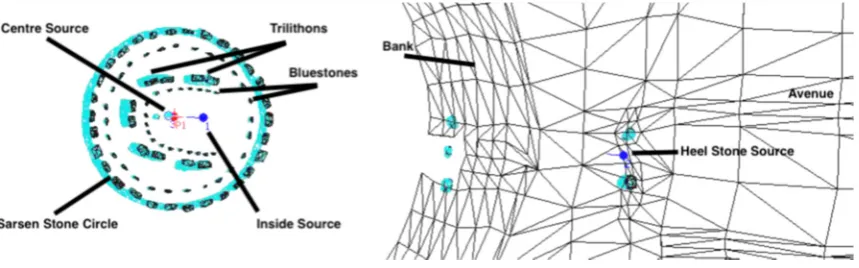
Impulse responses of a number of different receiver positions were generated to gain a basic understanding of the differing acoustics present. A source position in the centre of the circle was used for each Stonehenge model. In the Stonehenge A model, a number of receiver positions were chosen running in a line from just inside the stone circle to the centre, to understand how sound changed as one moved through the space. In the Stonehenge B and C models, a receiver position was chosen next to the Heel Stone outside the stone circle, because the author had observed echoes at this position onsite at the moment. Two further receiver positions were chosen, Centre Source at the centre of the circle, and Inside Source inside the monument, towards the Heelstone but still inside the stone circle (see Figure1).
Acoustics 2019, 2 FOR PEER REVIEW 9
running in a line from just inside the stone circle to the centre, to understand how sound changed as one moved through the space. In the Stonehenge B and C models, a receiver position was chosen next to the Heel Stone outside the stone circle, because the author had observed echoes at this position onsite at the moment. Two further receiver positions were chosen, Centre Source at the centre of the circle, and Inside Source inside the monument, towards the Heelstone but still inside the stone circle (see Figure 1).
Figure 1. Source and receiver positions in the model of Stonehenge C.
2.2.3. Paphos Theatre
A monochrome archaeological digital model reconstruction of the Paphos Theatre, based on archaeological field work, was provided by the Cyprus Institute [44], and features research carried out by them with the University of Sydney [45]. Paphos was the capital of Cyprus under the Ptolemaic and then Roman administrations, the theatre was used for performance and entertainment for over six and a half centuries (c. 300 BC to the late fourth century AD). At its maximum extent during the reign of the Antonine Emperors of the second century AD, the theatre could seat over 8500 spectators. The acoustics of Greek and Roman theatres have been explored as part of the Identification, Evaluation, and Revival of the Acoustical Heritage of Ancient Theatres and Odea (ERATO) project, and in a range of publications [46–49]. The author of the present paper worked with ERATO researcher Jian Kang as part of the Acoustics and Music of British Prehistory Research Network [50], and the work of ERATO, in particular the use of raytracing-based acoustic modelling software ODEON, informed the present study. Similar to the ERATO Project, the Conservation of the Acoustical Heritage y the Revival and Identification of the Sinan’s Mosques’ Acoustics (CAHRISMA) project focuses on the acoustics of mosques [51].
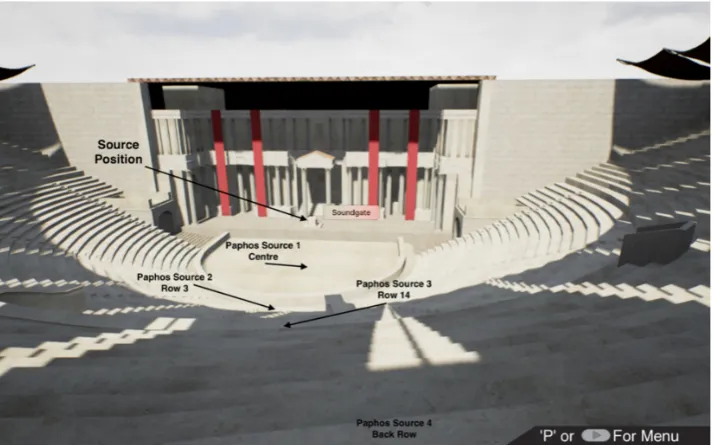
As was the case for Stonehenge, ODEON software was used to generate a number of impulse responses and acoustic results using the digital model of Paphos Theatre. A source position on the stage was used, along with four receiver positions. Four receiver positions were chosen, in the centre of the space in front of the stage, on the third row, on the fourteenth row, and on the back row (see Figure 2). Acoustic metrics were generated for each source and receiver pair in Stonehenge and Paphos models, and for each impulse response collected in each cave space.
By the Roman period, the writings of Vitruvius [52] and the development of theatres, Odea, and other venues show that there is in Roman culture by this period an understanding that architectural design can influence the acoustics of a space. Not only do Romans appreciate acoustics, but they attempt to intentionally control them. At Stonehenge, there is no evidence that architectural design of the site is selected with the intent of controlling acoustics, but acoustics in the space change as the monument develops. Acoustic effects are noticeably present and would impact upon ritual activities in the space. In Palaeolithic caves, there is some relationship between acoustics and the paintings that are present, which suggests an appreciation of acoustics and sound in the past [15]. The acoustic ecologies of human ritual culture developed over time, from an appreciation of the acoustics of natural spaces, such as caves, to human-generated acoustics in buildings, such as Stonehenge, that were created for ritual purposes, perhaps taking advantage or notice of the acoustics present. Eventually, ritual sites feature deliberate attempts to manipulate acoustics in order to support speech
Figure 1.Source and receiver positions in the model of Stonehenge C.
2.2.3. Paphos Theatre
A monochrome archaeological digital model reconstruction of the Paphos Theatre, based on archaeological field work, was provided by the Cyprus Institute [44], and features research carried out by them with the University of Sydney [45]. Paphos was the capital of Cyprus under the Ptolemaic and then Roman administrations, the theatre was used for performance and entertainment for over six and a half centuries (c. 300 BC to the late fourth century AD). At its maximum extent during the reign of the Antonine Emperors of the second century AD, the theatre could seat over 8500 spectators. The acoustics of Greek and Roman theatres have been explored as part of the Identification, Evaluation, and Revival of the Acoustical Heritage of Ancient Theatres and Odea (ERATO) project, and in a range of publications [46–49]. The author of the present paper worked with ERATO researcher Jian Kang as part of the Acoustics and Music of British Prehistory Research Network [50], and the work of ERATO, in particular the use of raytracing-based acoustic modelling software ODEON, informed the present study. Similar to the ERATO Project, the Conservation of the Acoustical Heritage y the Revival and Identification of the Sinan’s Mosques’ Acoustics (CAHRISMA) project focuses on the acoustics of mosques [51].
As was the case for Stonehenge, ODEON software was used to generate a number of impulse responses and acoustic results using the digital model of Paphos Theatre. A source position on the stage was used, along with four receiver positions. Four receiver positions were chosen, in the centre of the space in front of the stage, on the third row, on the fourteenth row, and on the back row (see Figure2). Acoustic metrics were generated for each source and receiver pair in Stonehenge and Paphos models, and for each impulse response collected in each cave space.
design can influence the acoustics of a space. Not only do Romans appreciate acoustics, but they attempt to intentionally control them. At Stonehenge, there is no evidence that architectural design of the site is selected with the intent of controlling acoustics, but acoustics in the space change as the monument develops. Acoustic effects are noticeably present and would impact upon ritual activities in the space. In Palaeolithic caves, there is some relationship between acoustics and the paintings that are present, which suggests an appreciation of acoustics and sound in the past [15]. The acoustic ecologies of human ritual culture developed over time, from an appreciation of the acoustics of natural spaces, such as caves, to human-generated acoustics in buildings, such as Stonehenge, that were created for ritual purposes, perhaps taking advantage or notice of the acoustics present. Eventually, ritual sites feature deliberate attempts to manipulate acoustics in order to support speech and music. These sites illustrate the change of human ritual acoustic ecologies over time, as well as their variety. How the acoustics of these sites change is discussed below.
Acoustics 2019, 2 FOR PEER REVIEW 10
and music. These sites illustrate the change of human ritual acoustic ecologies over time, as well as their variety. How the acoustics of these sites change is discussed below.
Figure 2. Source and receiver positions in the Paphos Theatre model.
2.3. Acoustic Metrics and Normal Values
Ahnert and Schmidt [53] provide a useful overview of acoustic metrics and normal values. They discuss overall parameters, including reverberation time (T30), early decay time (EDT), and bass ratio (BR); metrics related to speech, such as definition (D50), clarity (C50), articulation loss (ALcons), speech transmission index (STI or RASTI), and echo criterion for the perception of annoying reflections (EKspeech); and metrics related to music, such as the direct sound measure of the sensation of directness and nearness of the sound source (C (7)), and clarity of transparency of musical time and register (C (80)). Table 1 describes typical values of these metrics. For example, C (50) should be greater than or equal to −2 dB to avoid syllable intelligibility decreasing below 80%; this is the bottom admissible limit value for good speech intelligibility. Overall, long reverberation reduces articulation of consonants, and thus intelligibility.
In order to assess how the acoustics of ritual sites in human culture have changed over time, results for a number of these metrics in a number of sites are compared. Initially, early decay time (EDT) is discussed. Barron [54] (p. 330) compares EDT at a number of concert auditoria, and these results are used to provide contrast and a point of reference relevant to contemporary readers. As discussed above, EDT is representative of perceived reverberation [12] (p. 2), related to specific source and receiver positions. Reverb time (T30) in comparison represents the overall reverberation of the space. Comparing Barron’s EDT results to those from the archaeological sites being studied is illuminating, in order to illustrate in what ways ancient and modern sites are similar and different. These results are used as a benchmark against the caves, Stonehenge, and Paphos. EDT is compared at five octaves, from 125 to 2000 Hz, as well as in two averaged results that are used in standard acoustics approaches (125–1000 Hz and 500–1000 Hz). The two cave spaces that are the closest to the concert halls are selected for comparison. The percentage difference between EDT in a selection of concert halls and in each ancient site are compared with the just noticeable difference of EDT, to provide an objective standard acoustic comparison. The variety of EDT in concert halls and caves is also illustrated. This method provides an interesting reference point and satisfactory results.
Figure 2.Source and receiver positions in the Paphos Theatre model.
2.3. Acoustic Metrics and Normal Values
Ahnert and Schmidt [53] provide a useful overview of acoustic metrics and normal values. They discuss overall parameters, including reverberation time (T30), early decay time (EDT), and bass ratio (BR); metrics related to speech, such as definition (D50), clarity (C50), articulation loss (ALcons), speech transmission index (STI or RASTI), and echo criterion for the perception of annoying reflections (EKspeech); and metrics related to music, such as the direct sound measure of the sensation of directness and nearness of the sound source (C (7)), and clarity of transparency of musical time and register (C (80)). Table1describes typical values of these metrics. For example, C (50) should be greater than or equal to−2 dB to avoid syllable intelligibility decreasing below 80%; this is the bottom admissible limit value for good speech intelligibility. Overall, long reverberation reduces articulation of consonants, and thus intelligibility.
in order to illustrate in what ways ancient and modern sites are similar and different. These results are used as a benchmark against the caves, Stonehenge, and Paphos. EDT is compared at five octaves, from 125 to 2000 Hz, as well as in two averaged results that are used in standard acoustics approaches (125–1000 Hz and 500–1000 Hz). The two cave spaces that are the closest to the concert halls are selected for comparison. The percentage difference between EDT in a selection of concert halls and in each ancient site are compared with the just noticeable difference of EDT, to provide an objective standard acoustic comparison. The variety of EDT in concert halls and caves is also illustrated. This method provides an interesting reference point and satisfactory results.
Table 1.Typical ranges [53] p. 12.
Clarity Metric Type Typical Range
C (7) Directness/nearness of musical sources >−10 to−15 dB
C (50) Clarity (speech) >−2 dB (>3 dB is good)
C (80) Clarity (music)—classical music >−1.6 dB
C (80) Clarity (music)—romantic music >−4.6 dB
C (80) Clarity (music)—sacral music >5 dB
Metric JND Typical Range
G 1 dB −2 to+10 dB
EDT/T20/T30 5% 1 to 3 s
C80 1 dB −5 to+5 dB
D50 0.05 0.3 to 0.7
Articulation Loss of Consonants (ALcons)
ideal intelligibility ≤3%
very good intelligibility =3% to 8%
good intelligibility =8% to 11%
poor intelligibility >11% to 20%
worthless intelligibility (limit value 15%) >20%
Syllable Intelligibility RASTI Value
Poor 0 to 0.3
Satisfactory 0.3 to 0.45
Good 0.45 to 0.6
Very Good 0.6 to 0.75
Excellent 0.75 to 1
Subsequently, EDT results at Paphos are compared. Results at four receiver positions are examined, as well as averaged results from these positions. EDT is then analysed in some detail at Stonehenge, the results illustrating the difficulties of standard methodology in non-standard spaces. Barron examines frequency octaves at 125, 250, 500, 1000, and 2000 Hz, whereas results for the ancient spaces are presented here an octave lower at 63 Hz and two octaves higher at 4000 and 8000 Hz. Individual octave results are explored, as are individual receiver positions, rather than a more standard approach of averaging a number of results. Frequency responses, reflection geometries, and impulse response waveforms are also examined. Finally, results at all sites are presented together, in order to address differences between EDT in different sites and eras.
3. Results
3.1. Early Decay Time
Mostly, the caves have lower EDT times than modern concert halls, as can be seen in Table2, but in some cases, they are remarkably similar. La Pasiega Turret has EDT that is similar to that at Royal Festival Hall, Wigmore Hall, Assembly Hall, and Free Trade Hall, and that is larger than EDT at Wembley Conference Centre.
Table 2.Difference in EDT between a position in La Pasiega cave, and a number of British concert halls.
Space EDT
125
EDT 250
EDT 500
EDT 1000
EDT 2000
Average 125–1000 Hz
Average 500–1000 Hz
La Pasiega Turret 1.92 1.62 1.58 1.4 1.16 1.54 1.49
Royal Festival Hall, London 1.33 1.37 1.43 1.57 1.66 1.47 1.5
% difference −31 −15 −9 12 43 −4 1
Wigmore Hall, London 1.49 1.61 1.55 1.57 1.48 1.54 1.56
% difference −22 −1 −2 12 28 0 5
Assembly Hall Watford 1.53 1.74 1.58 1.47 1.25 1.51 1.525
% difference −20 7 0 5 8 −1 2
Free Trade Hall, Manchester 1.47 1.47 1.65 1.77 1.62 1.60 1.71
% difference −23 −9 4 26 40 4 15
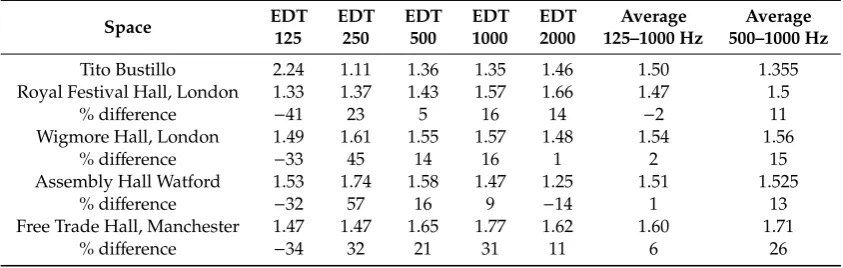
The just noticeable difference of EDT is 5% (see Table1), and the differences between EDT in the caves and concert halls are listed in Table2. EDT at a number of frequencies in a number of modern venues is less than 5% different to that measured in La Pasiega, and thus not noticeably different. The average of EDT between 125 and 2000 Hz in Royal Festival Hall and Free Trade Hall, two well-known UK concert venues, is only 4% different to that measured in the La Pasiega Turret. EDT in Assembly Hall is only 1% different, and in Wigmore Hall is even more similar, only 0.26% different. If one averages EDT at only 500 and 1000 Hz, which is a standard approach in acoustics, then Royal Festival Hall is only 1% different, whereas Free Trade Hall is, in this case, 15% different, which is noticeably different. With the latter approach, Wigmore Hall is 5% different, and Assembly Hall is 2% different (Table2). It is somewhat surprising that a cave made up of a corridor with a diameter and height of approximately 2 m, can produce reverberation which is not perceived as different to a number of modern concert halls.
Table 3.Difference in EDT between a position in Tito Bustillo cave, and a number of British concert halls.
Space EDT
125
EDT 250
EDT 500
EDT 1000
EDT 2000
Average 125–1000 Hz
Average 500–1000 Hz
Tito Bustillo 2.24 1.11 1.36 1.35 1.46 1.50 1.355
Royal Festival Hall, London 1.33 1.37 1.43 1.57 1.66 1.47 1.5
% difference −41 23 5 16 14 −2 11
Wigmore Hall, London 1.49 1.61 1.55 1.57 1.48 1.54 1.56
% difference −33 45 14 16 1 2 15
Assembly Hall Watford 1.53 1.74 1.58 1.47 1.25 1.51 1.525
% difference −32 57 16 9 −14 1 13
Free Trade Hall, Manchester 1.47 1.47 1.65 1.77 1.62 1.60 1.71
% difference −34 32 21 31 11 6 26
Acoustics2019,1 674 that of some of these concert halls; this time, the similarity is less surprising, as the cave is the largest
studied, a cavernous open stone area. The variety present in the caves was very noticeable in situ, ranging from very dry side chambers with very little reverberation (as low as 0.11 s EDT 1000 Hz), through to large open spaces with large cathedral-like acoustic sustain (above 2.5 s EDT 1000 Hz) [15]. In La Pasiega in particular, source–receiver separation made a significant difference to perceived reverberation, and the extremely low level of background noise present (caves are very quiet) meant that reverberation seemed longer, as it could be heard for longer before being masked by environmental noise, and quite subtle effects that would be unheard outside were audible.
0 0.5 1 1.5 2 2.5 3
EDT 125 EDT 250 EDT 500 EDT 1000 EDT 2000
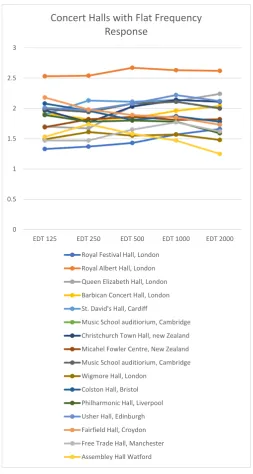
Concert Halls with Flat Frequency
Response
Royal Festival Hall, London Royal Albert Hall, London Queen Elizabeth Hall, London Barbican Concert Hall, London St. David's Hall, Cardiff
Music School auditiorium, Cambridge Christchurch Town Hall, new Zealand Micahel Fowler Centre, New Zealand Music School auditiorium, Cambridge Wigmore Hall, London
Colston Hall, Bristol Philharmonic Hall, Liverpool Usher Hall, Edinburgh Fairfield Hall, Croydon Free Trade Hall, Manchester Assembley Hall Watford
Acoustics 2019, 2 FOR PEER REVIEW 14
Figure 3. EDT at different frequencies in a number of British concert halls.
As can be seen in Figure 4, the caves have a range of frequency responses, but many show signs of modal resonance, evidenced by higher EDT at low frequencies. This is the case at Tito Bustillo, where EDT is noticeably different to the four concert halls discussed when one considers lower frequencies, rather than just 500 to 1000 Hz. Interestingly, the strong low frequency resonances in Tito Bustillo and La Pasiega would be missed if this study had drawn its method from the ISO standard, and only focused on 125 Hz and above. Further work is needed to explore the sound archaeology of the caves to understand the individual behaviours of the acoustics in these spaces in more detail. The existing paper by the SOTC team [15] principally studies their statistical relationships to motif positioning, further research is needed to examine the nature of the acoustic ecology of the various spaces qualitatively. The small chamber in Las Chimeneas was observed by the author when in the space to have had a noticeably powerful low frequency response. Indeed, this is the reason for its selection for use in the app discussed above [43]. Figure 4 shows high values for EDT in the 63 Hz octave, and that at higher frequencies, EDT values tail off. Las Chimeneas has some of the most dramatic images the author experienced in the caves studied (Figure 5). El Castillo has a very
0 0.5 1 1.5 2 2.5 3
EDT 125 EDT 250 EDT 500 EDT 1000 EDT 2000
Concert Halls with Varying
Frequency Responses
Butterworth Hall, Warwick University Wessex Hall, Poole
Royal Concert Hall, Nottingham Conference Centre, Wembley
Figure 3.EDT at different frequencies in a number of British concert halls.
Acoustics2019,1 676
similar value for EDT at a low frequency of 63 Hz. El Castillo is a large cave, and the impulse response discussed here was captured in a side chamber next to a panel featuring paintings. It is likely that it is the volume of this side chamber that produces its corresponding low frequency resonance. The panel features a red dot that is over 43,000 years old and is a good example of the statistical association found by SOTC between the position of dots and lines, and low frequency resonances in particular [15] (p. 1347).
Figure 4. EDT in caves at various octave frequencies.
0 0.5 1 1.5 2 2.5 3 3.5
EDT 63 EDT 125 EDT 250 EDT 500 EDT 1000 EDT 2000 EDT 4000 EDT 8000
EDT in Caves
Las Chimeneas El Castillo La Garma
La Pasiega End La Pasiega Turret Tito Bustillo
Figure 5. Painting of a stag from Las Chimeneas cave, image taken from the Soundgate app.
Paphos Theatre has values of EDT that are acceptably flat across a range of frequencies (Figure 6) to an extent that would make it acoustically acceptable for use as a modern concert hall. Indeed, a number of Roman amphitheatres are still in use as concert halls. Most concert halls are enclosed spaces, have a roof, but use wood or carpet for flooring. As an open roofed space, one might expect Paphos Theatre to have lower reverberation, but the stone construction and marble cladding increases reflection strength, extending reverberation time, and the stone seating contributes a stepped range of temporal reflections [47,48]. When compared across the 125 to 2000 Hz range (Figure 7), Paphos has slightly less high frequency EDT than three concert halls, but overall, it has very similar EDT values.
Figure 6. Early decay time (EDT) at Paphos Theatre in different source positions and at a range of frequencies.
0 0.5 1 1.5 2 2.5 3
EDT 63 EDT 125 EDT 250 EDT 500 EDT 1000 EDT 2000 EDT 4000 EDT 8000
Paphos EDT
Paphos 1 Paphos 2 Paphos 3 Paphos 4 Paphos Average
Figure 5.Painting of a stag from Las Chimeneas cave, image taken from the Soundgate app.
Paphos Theatre has values of EDT that are acceptably flat across a range of frequencies (Figure6) to an extent that would make it acoustically acceptable for use as a modern concert hall. Indeed, a number of Roman amphitheatres are still in use as concert halls. Most concert halls are enclosed spaces, have a roof, but use wood or carpet for flooring. As an open roofed space, one might expect Paphos Theatre to have lower reverberation, but the stone construction and marble cladding increases reflection strength, extending reverberation time, and the stone seating contributes a stepped range of temporal reflections [47,48]. When compared across the 125 to 2000 Hz range (Figure7), Paphos has slightly less high frequency EDT than three concert halls, but overall, it has very similar EDT values.
Acoustics 2019, 2 FOR PEER REVIEW 16
Figure 5. Painting of a stag from Las Chimeneas cave, image taken from the Soundgate app.
Paphos Theatre has values of EDT that are acceptably flat across a range of frequencies (Figure 6) to an extent that would make it acoustically acceptable for use as a modern concert hall. Indeed, a number of Roman amphitheatres are still in use as concert halls. Most concert halls are enclosed spaces, have a roof, but use wood or carpet for flooring. As an open roofed space, one might expect Paphos Theatre to have lower reverberation, but the stone construction and marble cladding increases reflection strength, extending reverberation time, and the stone seating contributes a stepped range of temporal reflections [47,48]. When compared across the 125 to 2000 Hz range (Figure 7), Paphos has slightly less high frequency EDT than three concert halls, but overall, it has very similar EDT values.
Figure 6. Early decay time (EDT) at Paphos Theatre in different source positions and at a range of frequencies.
0 0.5 1 1.5 2 2.5 3
EDT 63 EDT 125 EDT 250 EDT 500 EDT 1000 EDT 2000 EDT 4000 EDT 8000
Paphos EDT
Paphos 1 Paphos 2 Paphos 3 Paphos 4 Paphos Average
Figure 7. Comparison of EDT at Paphos Theatre with modern concert halls.
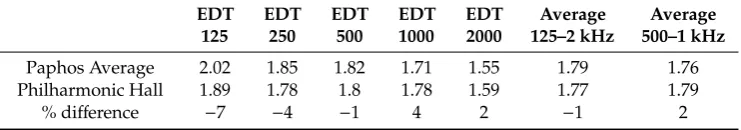
Philharmonic Hall in Liverpool is the closest match to Paphos (Table 4); the only noticeable difference between the two is in the 125 Hz octave band, Paphos has more lower frequency support, and perhaps slightly more modal behaviour. The average EDT across 125 to 2000 Hz, and the average for the standard 500–1000 Hz range is not noticeably different (2%, 1%). An audience would not notice the difference between the perceived reverberance in the two spaces according to these measures, but as we will see later, there are other differences between the acoustics of the spaces.
Table 4. Comparison of EDT at Paphos and at Philharmonic Hall in Liverpool.
EDT 125
EDT 250
EDT 500
EDT 1000
EDT 2000
Average 125–2 kHz
Average 500–1 kHz
Paphos Average 2.02 1.85 1.82 1.71 1.55 1.79 1.76
Philharmonic Hall 1.89 1.78 1.8 1.78 1.59 1.77 1.79
% difference −7 −4 −1 4 2 −1 2
EDT is quite different in Stonehenge (Figure 8). In Stonehenge A, a large circle of Bluestones from Wales dated to c.2900 BC [40] and with a diameter of c.87 m, there are low results for EDT both at the centre and inside the circle near the edge. The circular shape seems to cause a particular focusing of sound, with circular modes of resonance appearing. At the edge of the circle, there is a strong low frequency resonance, with an EDT of 1.31 s at 63 Hz and 1.36 s at 125 Hz, which drops off above this frequency to a very low result of 0.02 s at 2000 and 8000 Hz. This would result in a booming sound when stimulated by low frequency audio content, such as drums, thunder, or a strong wind.
0.00 0.50 1.00 1.50 2.00 2.50
EDT 125 EDT 250 EDT 500 EDT 1000 EDT 2000
EDT Compared between Paphos Theatre and
Concert Halls
Paphos Average Colston Hall, Bristol
Philharmonic Hall, Liverpool Fairfield Hall, Croydon
Figure 7.Comparison of EDT at Paphos Theatre with modern concert halls.
Philharmonic Hall in Liverpool is the closest match to Paphos (Table4); the only noticeable difference between the two is in the 125 Hz octave band, Paphos has more lower frequency support, and perhaps slightly more modal behaviour. The average EDT across 125 to 2000 Hz, and the average for the standard 500–1000 Hz range is not noticeably different (2%, 1%). An audience would not notice the difference between the perceived reverberance in the two spaces according to these measures, but as we will see later, there are other differences between the acoustics of the spaces.
Table 4.Comparison of EDT at Paphos and at Philharmonic Hall in Liverpool.
EDT 125
EDT 250
EDT 500
EDT 1000
EDT 2000
Average 125–2 kHz
Average 500–1 kHz
Paphos Average 2.02 1.85 1.82 1.71 1.55 1.79 1.76
Philharmonic Hall 1.89 1.78 1.8 1.78 1.59 1.77 1.79
% difference −7 −4 −1 4 2 −1 2
Figure 8. EDT in Stonehenge.
In the 4000 Hz octave band, there is a very high EDT result of 3.79 s. Digital modelling can cause strange results, and this figure is so extreme it seems possible this result could be a modelling error. Scattering and diffusion effects might reduce this resonance, but it seems from these results that there is a particular boost of frequencies in the 4000 Hz range. It is worth noting that 4000 Hz is where human hearing has a peak of sensitivity, and this frequency would particularly affect how one hears voices. Circular spaces can generate odd acoustic focuses and resultant modes, so this could be the result of a specific acoustic focusing. The space certainly has unusual acoustic effects that are present. This paper presents an outline of the acoustic features present, but a more in-depth investigation is warranted than is possible here to explore this and other features, and this is a suggestion for future research. Figure 9 shows the frequency response of Stonehenge A at the edge of the circle. Between 2 and 5 kHz, the space amplifies those frequencies by as much as 15 dB, whereas between 6 and 8 kHz, the level is 30 dB lower. Higher frequencies of 12 and 18 to 19 kHz are also boosted.
0 0.5 1 1.5 2 2.5 3 3.5 4
EDT 63 EDT 125 EDT 250 EDT 500 EDT 1000 EDT 2000 EDT 4000 EDT 8000
EDT in Stonehenge
Stonehenge A Edge of circle Stonehenge A Part way in
Stonehenge A Centre Stonehenge B Inside
Stonehenge B Heelstone Stonehenge B Centre
Stonehenge C Inside Stonehenge C Heelstone
Stonehenge C Centre
Figure 8.EDT in Stonehenge.
Figure 9. Stonehenge A frequency response at the edge of the circle.
Moving onwards in time to around 2500 BC, in the Stonehenge B model, the large circle of bluestones set in the Aubrey Holes is removed, and a smaller ring with a diameter of about 30 m made up of larger local Sarsen stones replaces them in the centre of the space. This arrangement is taller, with a number of stones also set inside an outer circle. It is a more complex monument, and it has less dramatic acoustic features. Low frequency resonances are present to a smaller extent, with a stronger low frequency response at the edge of the circle than at the centre (see Figure 8). The centre has very low results for EDT, and the edge of the space has EDT averaging only 0.3 to 0.4 s. This space has only subtle acoustic effects present.
The acoustics of the later (final) modelled arrangement of the site, Stonehenge C, dated c.2200 BC, has been examined in earlier publications by this author and Fazenda [35–38]. Those papers used various theoretical approaches to explore the acoustics of the site, as well as acoustic field tests at a full-size concrete replica that has a design based on Stonehenge, the Maryhill Monument in Washington State, USA. It found a T30 of 1.5 s and EDT of 1.8 s, as well as observing echoes. Two neighbouring circular/cylindrical modal resonances at approximately 47–48 Hz were identified at the Maryhill Monument by using a sine wave generator with variable frequency, as well as being calculated theoretically based on the shape of Stonehenge. In the corresponding modelled acoustics in this present study, a low level of EDT is found outside the circle, alongside little low frequency energy (see Table 5). At the centre of the circle, the EDT is over 1 s at 63 Hz, and then rises, with focused reflections from the surrounding circular stone walls generating reverberation. With an average EDT of 1.3 s (500–1000 Hz) or 1.4 s (500–2000 Hz), this suggests there would be clearly noticeable reverberation at the centre of the circle, similar results to those measured in Maryhill. A presentation of the octave band EDT does not, however, tell the whole story.
From the plotted frequency responses (Figures 10 and 11), one can see the specific resonant frequencies present. At the edge of the circle, individual low frequencies are strong, suggesting modal low frequency resonances below 200 Hz. This frequency response becomes flatter above this point, although with individual frequencies having strong resonance, for example, at around 400 Hz. A standard EDT reverberation measure based on average values at 500 and 1000 Hz would be 0.38 s, and an average of 500 to 2000 Hz is even lower at 0.26 s. EDT at 63 Hz has a value of 1.07 s when measured near the edge of the circle in the modelled acoustics, and the value would most likely be higher still at 47–48 Hz. The frequency response plot of the impulse response shows various frequencies having strong dips in EDT, perhaps caused by nodal points, which are as strong an indication of modal resonance as high values. Above 10 kHz, the EDT is very strong, another result missed by standard averages. This illustrates an issue with standard acoustic methods, in a space such as this that has odd acoustic behaviour. The space has unusual resonances at low and high frequencies, as well as less prominent but idiosyncratic mid-range responses.
Figure 9.Stonehenge A frequency response at the edge of the circle.
Moving onwards in time to around 2500 BC, in the Stonehenge B model, the large circle of bluestones set in the Aubrey Holes is removed, and a smaller ring with a diameter of about 30 m made up of larger local Sarsen stones replaces them in the centre of the space. This arrangement is taller, with a number of stones also set inside an outer circle. It is a more complex monument, and it has less dramatic acoustic features. Low frequency resonances are present to a smaller extent, with a stronger low frequency response at the edge of the circle than at the centre (see Figure8). The centre has very low results for EDT, and the edge of the space has EDT averaging only 0.3 to 0.4 s. This space has only subtle acoustic effects present.
The acoustics of the later (final) modelled arrangement of the site, Stonehenge C, dated c.2200 BC, has been examined in earlier publications by this author and Fazenda [35–38]. Those papers used various theoretical approaches to explore the acoustics of the site, as well as acoustic field tests at a full-size concrete replica that has a design based on Stonehenge, the Maryhill Monument in Washington State, USA. It found a T30 of 1.5 s and EDT of 1.8 s, as well as observing echoes. Two neighbouring circular/cylindrical modal resonances at approximately 47–48 Hz were identified at the Maryhill Monument by using a sine wave generator with variable frequency, as well as being calculated theoretically based on the shape of Stonehenge. In the corresponding modelled acoustics in this present study, a low level of EDT is found outside the circle, alongside little low frequency energy (see Table5). At the centre of the circle, the EDT is over 1 s at 63 Hz, and then rises, with focused reflections from the surrounding circular stone walls generating reverberation. With an average EDT of 1.3 s (500–1000 Hz) or 1.4 s (500–2000 Hz), this suggests there would be clearly noticeable reverberation at the centre of the circle, similar results to those measured in Maryhill. A presentation of the octave band EDT does not, however, tell the whole story.
Figure 10. Frequency response of Stonehenge C digital model at the edge of the stone circle.
Figure 11. Frequency response of Stonehenge C digital model at the centre of the stone circle.
In both Stonehenge itself and the Maryhill Monument, the author found that speech was subjectively particularly clear, and was remarkably so at specific source and receiver positions. When walking around the space, suddenly one would hear a voice from another part of the circle with great clarity, despite coming from some distance. It is suggested that this effect is due to circular focusing, which may take place in elliptic, circular, parabolic, or hyperbolic patterns (Figure 12) [55], depending on the source position.
Figure 13 overlays an image of Stonehenge model C over these focusing effects. Elliptic focusing would mean that the voice of someone standing just inside the circle, between the arms of the horseshoe shape of Bluestones, might find their voice focused between the stones of the largest stone trilithon, just past the altar stone. Archaeologists now suggest that the horseshoe shape illustrated here was actually an complete oval shape, and the source position illustrated would be just inside this oval, which conveniently marks out where one might stand in the space to achieve elliptic focusing effects. The central position in Stonehenge could produce a particularly strong focusing of sound for someone standing there. Making sound just in front of the largest trilithon would produce parabolic focusing, adding support to a voice or other sound source. The focusing could also work in reverse, and sound from far off may be easier to hear. A source just inside the Bluestone circle, the second circle inside the outer sarsen circle but outside the horseshoe shape of Sarsen trilithon pairs, may have created hyperbolic focusing, which could make a sound made just inside the stone circle, or when hidden behind the largest trilithon, appear to come from outside the stone circle. When one explores these focusing effects on the larger Stonehenge A model, this position of focus outside the circle is at the position of the Heel Stone. The two circles of stones would produce combined focusing effects, and with a number of people present in the circle, acoustic focusing effects could have been complex, unpredictable and confusing, subtle but certainly noticeable, and possibly considered by Neolithic people to be supernatural in a monument to ancestors within an animist culture.
Figure 10.Frequency response of Stonehenge C digital model at the edge of the stone circle.
Acoustics 2019, 2 FOR PEER REVIEW 20
Figure 10. Frequency response of Stonehenge C digital model at the edge of the stone circle.
Figure 11. Frequency response of Stonehenge C digital model at the centre of the stone circle.
In both Stonehenge itself and the Maryhill Monument, the author found that speech was subjectively particularly clear, and was remarkably so at specific source and receiver positions. When walking around the space, suddenly one would hear a voice from another part of the circle with great clarity, despite coming from some distance. It is suggested that this effect is due to circular focusing, which may take place in elliptic, circular, parabolic, or hyperbolic patterns (Figure 12) [55], depending on the source position.
Figure 13 overlays an image of Stonehenge model C over these focusing effects. Elliptic focusing would mean that the voice of someone standing just inside the circle, between the arms of the horseshoe shape of Bluestones, might find their voice focused between the stones of the largest stone trilithon, just past the altar stone. Archaeologists now suggest that the horseshoe shape illustrated here was actually an complete oval shape, and the source position illustrated would be just inside this oval, which conveniently marks out where one might stand in the space to achieve elliptic focusing effects. The central position in Stonehenge could produce a particularly strong focusing of sound for someone standing there. Making sound just in front of the largest trilithon would produce parabolic focusing, adding support to a voice or other sound source. The focusing could also work in reverse, and sound from far off may be easier to hear. A source just inside the Bluestone circle, the second circle inside the outer sarsen circle but outside the horseshoe shape of Sarsen trilithon pairs, may have created hyperbolic focusing, which could make a sound made just inside the stone circle, or when hidden behind the largest trilithon, appear to come from outside the stone circle. When one explores these focusing effects on the larger Stonehenge A model, this position of focus outside the circle is at the position of the Heel Stone. The two circles of stones would produce combined focusing effects, and with a number of people present in the circle, acoustic focusing effects could have been complex, unpredictable and confusing, subtle but certainly noticeable, and possibly considered by Neolithic people to be supernatural in a monument to ancestors within an animist culture.
Figure 11.Frequency response of Stonehenge C digital model at the centre of the stone circle.
In both Stonehenge itself and the Maryhill Monument, the author found that speech was subjectively particularly clear, and was remarkably so at specific source and receiver positions. When walking around the space, suddenly one would hear a voice from another part of the circle with great clarity, despite coming from some distance. It is suggested that this effect is due to circular focusing, which may take place in elliptic, circular, parabolic, or hyperbolic patterns (Figure12) [55], depending on the source position.
AcousticsAcoustics 2019,12019, 2 FOR PEER REVIEW 21 682
Figure 12. Focusing effects in a circle.
Figure 13. Possible circular acoustic focusing effects at Stonehenge.
Figure 12.Figure 12. Focusing eFocusing effects in a circle. ffects in a circle.
Figure 13. Possible circular acoustic focusing effects at Stonehenge.
![Table 1. Typical ranges [53] p. 12.](https://thumb-us.123doks.com/thumbv2/123dok_us/9689738.1497068/11.595.96.501.229.495/table-typical-ranges-p.webp)