Article
CO
2-Induced Changes in Wheat Grain Composition:
Meta-Analysis and Response Functions
Malin C. Broberg 1,*, Petra Högy 2 and Håkan Pleijel 1
1 Department of Biological and Environmental Sciences, University of Gothenburg, P.O. Box 461, SE-40530 Göteborg, Sweden; [email protected]
2 Institute for Landscape and Plant Ecology, University of Hohenheim, Ökologiezentrum 2, August-von-Hartmann Str. 3, D-70599 Stuttgart, Germany; [email protected]
* Correspondence: [email protected]; Tel.: +46-31-786-4805
Abstract: Elevated carbon dioxide (eCO2) stimulates wheat grain yield, but simultaneously reduces
protein (N) concentration. Also other essential nutrients are subject to change. This study is a comprehensive synthesis of wheat experiments with eCO2, estimating effects on N, minerals (B, Ca,
Cd, Fe, K, Mg, Mn, Na, P, S, Zn), and starch. Analysis was made by i) deriving response functions for the relative effect on element concentration in relation to CO2 concentration, ii) meta-analysis to
test the magnitude and significance of observed effects, and iii) relating CO2 effects on minerals to
effects on N and grain yield. Responses range from zero to strong negative effects of eCO2 on
mineral concentration, with largest reductions for the nutritionally important elements N, Fe, S, Zn and Mg. Together with the positive but small and non-significant effect on starch concentration, the large variation in effects suggests that CO2-induced responses cannot be explained by a simple
dilution model. To explain the observed pattern, uptake and transport mechanisms may have to be considered, along with the link of different elements to N uptake. Our study shows that eCO2 has a
significant effect on wheat grain stoichiometry, with implications for human nutrition in a world of rising CO2.
Keywords: Triticum aestivum; carbon dioxide; minerals; protein; starch; baking properties; crop quality; food security
1. Introduction
The atmospheric concentration of carbon dioxide (CO2) has steadily increased since the 19th
century, from the pre-industrial level of 280 ppm to current 400 ppm [1]. Latest projections by the Intergovernmental Panel on Climate Change [1] suggest that concentrations are likely to reach levels in the range of 420 ppm (RCP2.6) to 1300 ppm (RCP8.5) by the year 2100.
Effects of elevated CO2 (eCO2) on plants are well studied, in particular on food crops due to the
strong concern for future food security. Photosynthesis and growth in C3 plants are often enhanced by eCO2 resulting in a higher yield, which has been observed for many crops [2]. The magnitude of
yield response has been shown to vary between different crops [3] and crop varieties [4,5], but also to depend on differences in experimental systems [6]. It has been argued that yield stimulation is overestimated due to unrealistic growing conditions in enclosure systems, including open-top chambers (OTCs) [7,8]. In contrast, Ziska and Bunce [9] found that there were no significant differences in yield response for rice, soybean and wheat when comparing experiments using enclosure methodologies with Free-Air-CO2-Enrichment (FACE) technology in a single experiment.
According to Körner [10], carbon is rarely the limiting factor for plant growth but soil resources, e.g., nutrients and water, are more likely to determine plant performance and the observed positive effects of eCO2 are according to this argument consequently a result of improved water use efficiency.
Comparing the eCO2 effects on plants grown in different experimental systems could possibly reveal
Wheat is a major food crop globally, being the second most important energy source for the human population with an annual global production of approximately 700 million tons [11]. The main source of food energy within the wheat grain is starch, accounting for 50-70% of total grain mass. It has been proposed that eCO2 could enhance concentration of carbohydrates, starch being the
major component, and thus reduce the concentrations of other constituents, often referred to as the “dilution hypothesis” [12]. Photosynthetic nitrogen (N) use efficiency can potentially increase under eCO2 [13], and consequently more carbon can be assimilated with the same amount of N, resulting in
a relative decrease in N content in the leaf. Since most of the grain N is translocated from non-reproductive parts of the plant during grain filling [14], also grain N content could be affected under eCO2 by this mechanism.
Changes in crop quality, like nutritional aspects, have often been neglected in research synthesis and assessments of future food production. The average effect on protein (hereafter referred to as N) content, estimated in a meta-analysis by Taub et al. [15], showed a significant decrease for several crops, including wheat, barley, rice and soybean. Along with the “dilution hypothesis” a few more hypotheses have been proposed to explain the observed pattern of decreasing N concentration in plants exposed to eCO2, such as a reduction in transpiration driven mass flow [16] and impaired N
acquisition [17], processes that both can result in a reduced N uptake under eCO2 even without yield
stimulation. According to the mechanism put forward by Bloom [17], the decrease in photorespiration under eCO2 leads to a reduced malate export from the chloroplasts, and the
nicotinamide adenine dinucleotide hydride (NADH) generated from this malate in the cytoplasm powers the reduction of nitrate (NO3-) to nitrite (NO2-), which is the first step of plant NO
3-assimilation. In line with this, Pleijel and Uddling [18] found that the dilution hypothesis is likely to exist, but cannot fully explain the reduction in N concentration and yield in wheat under eCO2, since
N concentration is reduced also where grain yield is unaffected. This suggests a role for the mechanism proposed by Bloom [17]. Another important and related question is if there is a level of CO2 where the effect of eCO2 on grain N concentration saturates, analogous to the saturation seen in
the response of photosynthesis under eCO2 of C3 plants [19].
The effects on N content in wheat grains have been observed in a rather large number of studies with wheat grown under eCO2, while observations of effects on other elements are limited. Decrease
in concentrations of some essential mineral nutrients (Fe and Zn) have been documented [20,21], while it is still uncertain to what extent other elements are affected by eCO2 and the mechanism
behind observed changes. Reduction in concentrations of N and nutrient elements are of great concern for future food security and the issue of so called ̒hidden hunger̉, where the amount of calories might be sufficient but with undernourishment with respect to essential nutrients. A modelling study by Myers et al. [22] estimated that the CO2-induced reduction in Zn concentration
in staple crops could substantially increase the number of people at risk of Zn deficiency by 138 million until 2050. Cereals, including wheat, are also an important source of dietary Cadmium (Cd) exposure [23], which could cause injury to kidney and bones [24], hence the CO2 effect on Cd content
is also of importance.
Due to the fact that N is often considered to be one of the most limiting elements for crop growth, the uptake of other nutrients could be expected to match the available N, assuming that excess uptake of other minerals does not occur. With these assumptions the effect on plant nutrients would follow the same pattern as N when wheat is grown under eCO2, which could be tested by relating the eCO2
effects on minerals to the effect on N. If dilution is the main process that acts to reduce mineral concentration the eCO2 effect on grain yield would be closely related to effects on minerals, where a
negative effect on mineral concentration will only occur in association with yield stimulation. Since wheat is used for baking to a large extent, it is also relevant to study how different baking properties are affected by eCO2, where alteration in quality may affect market value and quality of
properties have been observed in individual experiments [26-30], but to our knowledge no meta-analysis has been made on this aspect.
This study intends to provide a comprehensive overview of observed effects of eCO2 on wheat
grain quality based on all available ecologically realistic experiments, presented as meta-analysis (to test the overall magnitude and statistical significance of the effects) and as response regressions (to assess effect size in relation to CO2 concentration [CO2]). Further, the effect of eCO2 on the
concentration of a range of minerals is related to the effect on N concentration and grain yield in order to understand to what extent eCO2 effects are consistent among different minerals and the
degree to which they are related to the effects on N concentration and yield stimulation. By these three approaches our study aims to examine the following hypotheses:
1. The negative effects of eCO2 on N concentration and yield are independent of experimental
setup, such as exposure system, rooting environment, and concentration level of CO2
treatment.
2. The negative effect of eCO2 on N concentration is saturating at high CO2.
3. Nutritional and baking quality of wheat grain is negatively affected by eCO2.
4. Concentrations of N and minerals are reduced due to starch dilution under eCO2.
5. Effects of eCO2 on minerals concentration are linked to the effect on N concentration and
2. Results
2.1. Nitrogen and starch
Grain N concentration was significantly reduced by eCO2 with an overall effect of -8.4% (CI -9.8
-7.4; Figure 1a). The magnitude of effect was shown to be dependent on experimental setup where significant differences were observed between exposure systems (FACE < OTC) and rooting environment (pots > field soil). There was, however, no significant difference between OTC and FACE when excluding eCO2 treatments >600 ppm (only OTC experiments). Comparing concentration
levels (above or below 600 ppm) in OTC experiments did not show any significant difference, but indicated a larger effect with higher [CO2]. Even though N concentration was reduced by eCO2 there
was a significant increase in N yield, with an overall effect of 12% (CI 7.93 15.90; Figure 1a), associated with a strong grain yield stimulation. Subgroup analysis revealed that experiments performed in field tunnels (FT) and pots did not show a significant CO2 effect on N yield; however, it should be
noted that those groups have few observations and thus larger CIs. There were no significant differences with regard to the effect on N yield when comparing OTC with FACE or different CO2
concentrations.
The response function for the relationship between N concentration and [CO2] (Figure 1b)
showed a strong non-linear relationship (r2=0.57), with an initial reduction in N concentration with
increasing [CO2], but reaching a minimum at ~600 ppm. N yield was positively affected by eCO2, but
showed a rather weak relationship with [CO2] (r2=0.19). Details of the regression models are presented
Figure 1. a) Meta-analysis of eCO2 effects on N concentration and N yield using ambient [CO2] as the reference, with subgroup-analysis of exposure systems, rooting environment, and concentration level for eCO2 treatment. Number of comparisons for concentration and yield, respectively, are given within brackets. b) Response function for N concentration with [CO2], grey markers show data points identified as outliers not included in the curve fitting.
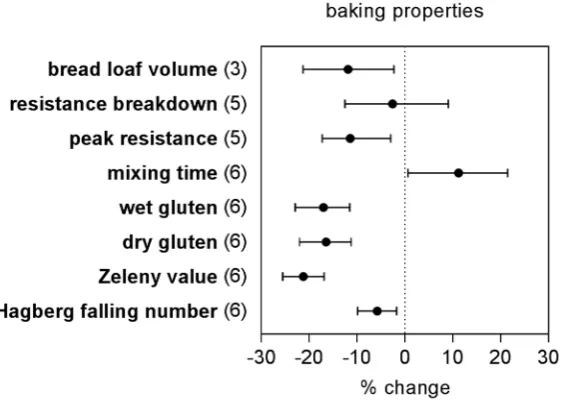
Figure 2 shows the eCO2 effect on various baking properties, where a significant negative effect
is observed for Hagberg falling number (-5.8%, CI -9.9 -1.7), Zeleny value (-21.2%, CI -25.5 -16.9), dry gluten content 16.5%, CI -22.0 -11.2), wet gluten content 17.0%, CI -23.0 -11.5), peak resistance (-11.4%, CI -17.3 -3.0), and bread loaf volume (-11.9%, CI -21.3 -2.3). Mixing time significantly increased (11.2%, CI 0.6 21.5) under eCO2, while resistance breakdown remained unaffected (-2.6%, CI -12.5
9.0).
Meta-analysis for eCO2 effect on grain starch concentration (Figure 3a) showed a non-significant
positive effect of 2.2% (CI -0.6 6.2). In line with this result the response function for starch concentration with [CO2] did not reveal any relationship (Figure 3b). Starch yield was significantly
positively affected by 20.8% (CI 12.4 30.9). Due to limited amount of data (19 observations) subgroup analysis was not performed for starch concentration and starch yield.
Table 1. Response functions for regression of concentration and yield of N, starch, and minerals with [CO2]. Model parameters are presented for both linear (y=B1x+B0) and quadratic (y=B2x2+B1x+B0) curve fit. The AICc comparison gives the probability of model (linear vs. quadratic) being correct. Data points identified as outliers were excluded from regressions.
Variable Observations
(outliers)
B0 B1 B2 R2 Probability1
(%)
Sign.
N concentration 132 (4) 1.10 -3.10E-04 0.43 <0.01 *
1.50 -1.98E-03 1.66E-06 0.57 100.0
yield 96 (11) 0.94 2.49E-04 0.12 11.8 *
0.48 2.16E-03 -1.85E-06 0.18 88.2
Starch concentration 30 (3) 1.00 6.79E-06 0.00 73.4 ns
1.10 -3.89E-04 3.71E-07 0.03 26.6
yield 30 (2) 0.86 5.18E-04 0.35 79.4 *
0.92 2.55E-04 2.47E-07 0.35 20.6
B concentration 68 (2) 1.01 -2.46E-05 0.00 ns
-
yield 32 (4) 0.34 1.96E-03 0.40 *
Ca concentration 83 (4) 1.13 -3.69E-04 0.32 *
-
yield 47 (7) 0.84 5.64E-04 0.16 *
-
Cd concentration 13 1.12 -3.95E-04 0.31 81.2 *
1.64 -2.53E-03 2.08E-06 0.39 18.8
yield 13 0.99 3.19E-05 0.00 89.5 ns
1.10 -4.51E-04 4.70E-07 0.01 10.5
Cu concentration 80 (2) 1.07 -2.03E-04 0.14 *
yield 44 (5) 0.67 1.04E-03 0.27 *
Fe concentration 86 (7) 1.14 -3.87E-04 0.51 *
-
yield 50 (4) 0.88 4.71E-04 0.07 19.4 ns
-1.12 9.11E-03 -9.00E-06 0.17 80.6
K concentration 87 (4) 1.02 -4.44E-05 0.01 ns
-
yield 51 (8) 0.58 1.27E-03 0.60 77.0 *
0.64 9.96E-04 2.80E-07 0.60 23.0
Mg concentration 83 (8) 1.12 -3.33E-04 0.61 *
-
yield 47 (7) 0.75 7.85E-04 0.42 *
-
Mn concentration 84 (3) 1.06 -1.91E-04 0.13 8.1 *
yield 48 (8) 0.80 6.74E-04 0.36 72.8 *
0.48 2.05E-03 -1.41E-06 0.36 27.2
P concentration 87 (3) 1.08 -2.22E-04 0.19 65.5 *
1.24 -9.25E-04 7.40E-07 0.20 34.6
yield 51 (7) 0.55 1.27E-03 0.56 0.5 *
2.01 -4.94E-03 6.31E-06 0.68 99.5
S concentration 83 (3) 1.10 -2.84E-04 0.32 *
-
yield 47 (7) 0.80 6.51E-04 0.20 *
-
Zn concentration 92 (5) 1.11 -3.10E-04 0.15 53.9 *
1.44 -1.76E-03 1.50E-06 0.17 46.1
yield 56 (5) 0.78 7.30E-04 0.29 0.6 *
-0.73 7.18E-03 -6.58E-06 0.44 99.4
1Probability of model being correct according to AICc.
2.2. Minerals
Meta-analysis (Figure 4) showed that eCO2 significantly reduced the concentration of various
Figure 4. Meta-analysis output for mineral concentration and yield using ambient [CO2] as the reference. Numbers within brackets gives the number of comparisons for concentration and yield, respectively.
Response functions in Figure 5 show that concentrations of several mineral nutrients had a strong linear relationship with increasing [CO2], with a significant negative slope for all elements (Fe,
Mg, P, S, and Zn) except K. Regression models for remaining elements are presented in Table 1. Ca, Cd, and Cu also showed a significant linear decrease with higher [CO2], however, a quadratic model
had a better fit for Mn, while B did not show any relationship with [CO2]. Na was excluded from this
analysis due to the small number of observations. The slope of the linear regression line suggests a reduction in mineral concentration of about 2-4% per 100 ppm for all minerals except for B and K, which had a non-significant slope close to zero. Mineral yield showed a positive relationship with [CO2] and a significant slope for all elements except for Cd and Fe (Table 1). The strongest
relationships were found for B, K, Mg, and P with an r2 between 0.40 and 0.68.
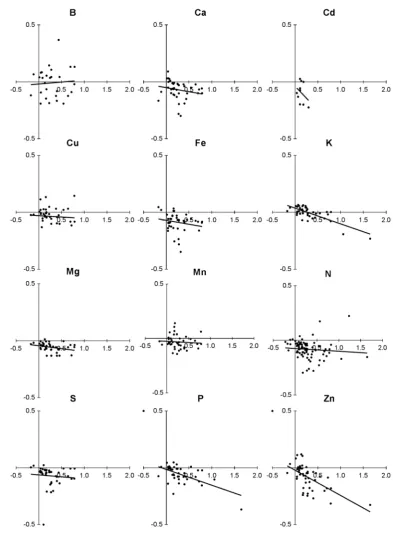
2.3. Effects on minerals in relation to effects on N concentration and grain yield
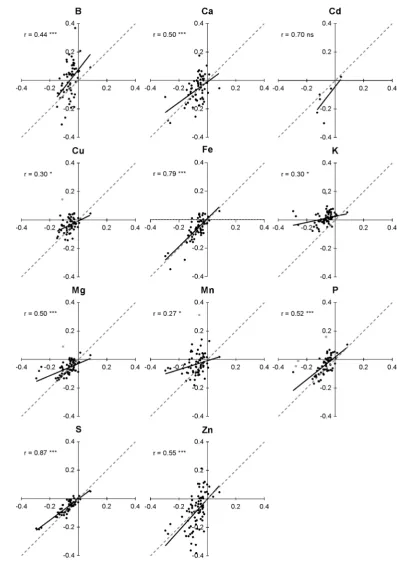
Figure 6 shows the relationship between eCO2 effects on concentration of various minerals and
eCO2 effect on N concentration. The correlation coefficient provides an estimate of the association of
effects, and a strong association (r>0.75) is found for S and Fe (r=0.87 and r=0.79, respectively). Ca, Cd, Mg, P, and Zn show a moderately association (0.5<r<0.75), while it was rather weak for remaining elements (B, Cu, K, and Mn).
Regression analysis of the eCO2 effect on mineral concentrations with the CO2 effect on N
concentration (Table 2) showed a strong relationship for S (R2=0.75) and Fe (R2=0.63), while the
relationships were rather weak for B, Cu, K, and Mn (R2<0.25). Remaining elements were found in
the intermediate range (0.25<R2<0.50). A deviation of the fitted curve from the 1:1 line indicates that
the element:N ratio was affected by eCO2, hence that the grain stoichiometry was altered. The
majority of minerals (Ca, Cu, K, Mg, Mn, P, and S) were less affected by eCO2 compared to N (slope
of line <1), whereas the regression lines for Zn and Fe were close to 1, and for B and Cd the slope was >1. Relating the eCO2 effect on minerals to the effect on grain yield showed a weak and non-significant
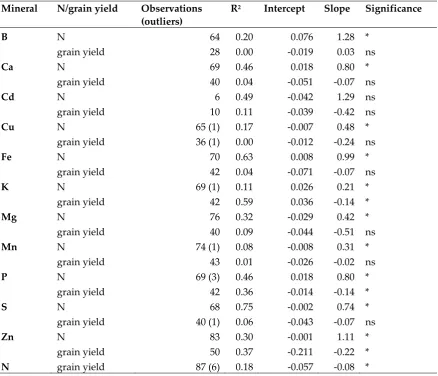
Table 2. Response functions for regression between the relative eCO2 effect on the concentration of various minerals with eCO2 effect on N concentration and grain yield. Data points identified as outliers were excluded from the regression analysis.
Mineral N/grain yield Observations (outliers)
R2 Intercept Slope Significance
B N 64 0.20 0.076 1.28 *
grain yield 28 0.00 -0.019 0.03 ns
Ca N 69 0.46 0.018 0.80 *
grain yield 40 0.04 -0.051 -0.07 ns
Cd N 6 0.49 -0.042 1.29 ns
grain yield 10 0.11 -0.039 -0.42 ns
Cu N 65 (1) 0.17 -0.007 0.48 *
grain yield 36 (1) 0.00 -0.012 -0.24 ns
Fe N 70 0.63 0.008 0.99 *
grain yield 42 0.04 -0.071 -0.07 ns
K N 69 (1) 0.11 0.026 0.21 *
grain yield 42 0.59 0.036 -0.14 *
Mg N 76 0.32 -0.029 0.42 *
grain yield 40 0.09 -0.044 -0.51 ns
Mn N 74 (1) 0.08 -0.008 0.31 *
grain yield 43 0.01 -0.026 -0.02 ns
P N 69 (3) 0.46 0.018 0.80 *
grain yield 42 0.36 -0.014 -0.14 *
S N 68 0.75 -0.002 0.74 *
grain yield 40 (1) 0.06 -0.043 -0.07 ns
Zn N 83 0.30 -0.001 1.11 *
grain yield 50 0.37 -0.211 -0.22 *
N grain yield 87 (6) 0.18 -0.057 -0.08 *
3. Discussion
The overall results from this study suggest that eCO2 can cause a significant shift in wheat grain
stoichiometry, with concentration reductions for N and several nutritionally important minerals together with a decreased baking quality and thus lower commodity value. This is the most comprehensive synthesis of eCO2 effects on mineral elements in wheat, with meta-analyses including
more than 60 pair of observations for most mineral elements and 105 for N.
Our results support the first hypothesis, where a significant negative effect on N concentration was observed regardless of experimental setup, although magnitudes of effects were significantly different as shown in the subgroup analysis comparing experimental methods. The negative effect of eCO2 on N concentration observed in some recent studies was estimated to be between 6.3% [21] and
9.8 % [15], which is in line with the overall results in this study (8.4%). The large amount of data gives robust results (small CIs) and allows for subgroup analysis to unravel sources of variation within the data.
The response function for the relationship between N concentration and [CO2] indicates that the
negative effect on N concentration saturates around 600 ppm, supporting the second hypothesis. The meta-analysis, however, points to a stronger response in experiments using an eCO2 level above 600
consequence of the different levels of eCO2 used, and not the exposure system itself, since the
difference was not found when comparing FACE with the subset of OTC experiment data with eCO2
concentrations below 600 ppm (average [CO2] 550 ppm and 528 ppm respectively).
The comparison of rooting environment showed that there was a much stronger negative effect on N concentration in potted plants compared to those grown in field soil. This is in line with the results from Taub et al. [15] where wheat grown in OTCs showed a similar difference in response between rooting environments. Assuming that experiments in field soil are more realistic, this suggests that potted experiments may strongly overestimate the negative effect of eCO2 on N
concentration. Potted plants are more likely to suffer from nutrient limitation due to their restricted rooting space, thus nutrient uptake cannot increase with the same rate as photosynthesis under eCO2.
It should, however, be noted that only 8 pairs of observations from potted plants were included in this study, compared to 97 observations for field soil, and the large CIs for potted plants indicate that conclusions about them are uncertain.
As a consequence of the decrease in N concentration, eCO2 had a significant negative effect on
most baking properties (Figure 2), even though the number of observations is rather small. A reduction in gluten proteins results in lower elasticity and resistance of the dough and smaller bread loaf volume, but also longer mixing time [31]. In addition, the falling number was reduced under eCO2 reflecting an increase in α-amylase activity, which is associated with poor baking properties,
such as sticky dough and poorly structured loaves [32], but also shortens the storage time of flour and grains [33].
No significant effect of eCO2 on starch concentration could be demonstrated and consequently
the negative effect on N could not be explained by starch dilution, thus the third hypothesis was not supported. On the other hand the number of observations is rather small, resulting in large CIs and low statistical power. Since starch is a major component of the wheat grain (50-70 %) even a small change in its concentration could alter the grain stoichiometry considerably. To detect an effect with small magnitude a large sample size is required and the non-significant results found here could be a consequence of power failure and a dilution effect by starch may be of importance for some elements. Further investigations would be needed to confirm this.
Meta-analysis for eCO2 effect on mineral concentrations (Figure 4) showed that there was a large
variation in magnitude of effects, ranging from effects close to zero to reductions of about 10%. Together with the non-significant effect on starch concentration, the large variation in effects on mineral elements indicates that CO2-induced responses cannot be explained by a simple growth
dilution model. In addition, almost all elements (except K) showed a weak relationship when comparing eCO2 effects on mineral concentration with grain yield stimulation. If dilution was the
only mechanism operating, the reduction in mineral concentration would closely follow the increase in biomass and would be the same for all elements.
The eCO2 effects on Fe and S were closely related to the effects on N (Figure 5) and those elements
were also among the ones most strongly negatively affected by eCO2 in the meta-analysis (Figure 4).
In contrast, the effect on minerals (B, Cu, K, and Mn) that showed a weak relationship with effects on N, were observed to be little (B, Cu, Mn) or not significantly (K) affected by eCO2. This suggests that
eCO2 effects on N may play a role also for other minerals such as Fe and S. The regression of effects
between B and N gives a slope >1, however, this should not be interpreted as a stronger effect on B than N since it is mainly a result of large response range in B (with both positive and negative effects) compared to N. As shown in the meta-analysis (Figure 4) the large variation of eCO2 effects on B
cancel each other out, resulting in a net zero effect.
to nucleic acids/proteins, the second group is related to structure/photosynthesis, and the third group is associated with enzymes. The significant relationship between K and grain yield stimulation (Figure 7) confirms that K concentration is associated with changes in biomass, while the corresponding relationships was rather weak (non-significant) for Ca and Mg. With the current data it is not possible to test if the elements most strongly affected by eCO2 in our study, Fe and Zn, are
reduced due to soil limitation or if they are functionally linked to N. It is also important to note that effects on element concentration in leaves do not necessarily translate to the same response in seeds. The mineral concentration in wheat grains is generally a result of total plant uptake, biomass accumulation, and the rate of translocation from vegetative tissues during grain filling. Waters et al. [35] showed that the translocation of Fe, Zn, and N from vegetative tissues to grain is partly regulated by the same proteins in wheat plants. eCO2 could possibly affect translocation rates indirectly
through higher leaf temperatures due to lower transpiration rates[36]. Increase in leaf temperature can lead to heat stress, which is known to promote senescence [37], and thus shorten the grain filling period [38]. This is, however, likely to increase concentrations of minerals since starch accumulation is often more strongly reduced than N and minerals [37]. If the rate and efficiency of translocation were strongly affected by eCO2, Fe, Zn, and N could be expected to follow the same response pattern.
Our results (Figure 6) show a strong correlation between eCO2 effects on Fe and N (r=0.79), while the
relationship is moderately strong for Zn and N (r=0.55), suggesting that additional mechanisms are of importance in terms of wheat grain concentrations for Zn.
In line with other minerals, Cd concentration was significantly reduced under eCO2, which could
be considered a positive effect due to the toxicity of Cd. A reduction in Cd concentration was also observed for wheat grown under CO2 enrichment [20] and ozone exposure [39]. Cd is a non-essential
element for the plant and the uptake is known to be dependent on transpiration driven mass-flow [40], therefore lower concentrations could be expected since transpiration rates are often reduced under both eCO2 and high ozone [41].
The yield of N (Figure 1) and all minerals, except for Cd (Figure 4), were significantly increased under eCO2, which indicates that there is an increase in total soil uptake of these elements. As a
potential mitigation strategy more fertilizers could be added to the agricultural system, however, with the risk of also increasing leaching of nutrients and enhanced emissions of N2O.
eCO2-induced reductions in the concentration of N and essential minerals can have significant
impacts on human nutrition. Fe and Zn deficiency is already an urgent issue in many parts of the world. An estimated two billion people suffer these deficiencies [42], especially in regions where people depend on C3 grains such as wheat as their primary dietary source of Zn and Fe. Consequently, these factors are also important to take into account when assessing the effects of CO2
and climate change on global food security.
4. Materials and Methods
4.1. Database
Web of Science, Scopus, and Google Scholar were used to survey all peer-reviewed literature published between 1980 and 2016 (May) related to the response of wheat grain quality to eCO2.
Experimental data were included in the database if at least one of the following variables were reported: grain protein concentration (or N concentration), grain starch concentration, grain mineral concentrations (B, Ca, Cd, Cu, Fe, K, Mg, Mn, Na, P, S, and Zn), grain yield (to calculate yield of N/protein and other minerals), and baking properties (Hagberg falling number, Zeleny value, gluten content, mixing time, peak resistance, resistance breakdown, bread loaf volume). In order to only include ecologically realistic data, experiments performed in greenhouse or closed growth chambers were excluded. For factorial design experiments with elevated ozone only treatments without ozone fumigation were included, since ozone is known to have significant effects on both yield and grain quality [39]. Data sources for the included experiments are presented in Supplementary (Table 1, Table 2).
for the year the study was conducted, with the Mauna Loa record used as reference (retrieved from National Oceanic & Atmospheric Administration, (NOAA), www.noaa.gov).
4.2. Meta-analysis
Meta-analysis was performed using a meta-analytical software package MetaWin [44]. The experimental treatment with ambient CO2 was used as control, and parameter values were
considered independent if they were made on different cultivars, different [CO2], or different years,
in line with previous meta-analysis [41,45]. The effect size used was the natural log of the response ratio (r, the ratio of the means of two groups, experimental and control) reported as percentage change from the control [41,44,46]. All variables were analyzed using an un-weighted approach due to lack of data for computation of sample variance (standard deviation or standard error with degree of replication). In line with previous meta-analysis [39,44] variance of the effect size was calculated using a resampling method with 9999 iterations, and confidence intervals (CI) were calculated using the bootstrap method. If the 95% CI did not overlap zero the average effect size for each variable was considered to be significant, and for subgroup analysis the different groups were considered significantly different if the 95% CI did not overlap [45].
Experiments with additional treatments were included, such as different application levels of N, water supply, temperature, and time of sowing. However, only the effect of eCO2 was tested in the
meta-analysis, and interactions of eCO2 and additional treatments were not further examined.
Subgroup analysis was performed for N concentration and yield, for which a substantial amount of data was available, where data was categorized by 1) exposure system, Free-Air-CO2-Enrichment
(FACE), Open-Top-Chamber (OTC), and Field Tunnel (FT), 2) rooting environment, pots or field soil, and 3) the concentration level of the eCO2 treatment, above or below 600 ppm (only applicable for
OTC experiments).
4.3. Response functions
Response functions were derived through regression between the relative effect of each variable and the corresponding [CO2] for the treatment. The response was related to the effect estimated at 350
ppm by linear regression for each individual experiment. At 350 ppm the variables were set to take the value of 1 on a relative scale. Both a linear (first order polynomial) and quadratic (second order polynomial) model was fitted to the data, and the model preferred by Akaike information criterion (AICc) comparison method [47] was chosen. All additional treatments, such as low N, drought, and high temperature, were excluded from the response functions since they were observed to cause large scatter not related to the effect of [CO2]. All response functions were derived using automatic outlier
removal [48].
4.4. Comparison of CO2 effects on different response variables
The eCO2 effect was related to the control treatment (ambient [CO2]) when relating the effects on
minerals to effects on N or grain yield. The correlation coefficient was calculated to estimate the association of effects, while regression was used to test if effects on minerals are dependent on effects on N or grain yield. Only linear regression was used to explore the relationship with N, since the slope of a linear trend line could be compared to a 1:1 line that represents the theoretical situation where the mineral and N concentrations are equally affected. For regression between effect on minerals and effect on grain yield both linear and quadratic curve fit was tested, and best fit chosen with AICc comparison method.
5. Conclusions
Our study, based on an extensive database, shows that eCO2 has significant negative effects on
and not the enclosure system itself. The pattern of effects by eCO2 on different minerals was complex,
showing that a single mechanism cannot account for the diversity of responses. Although the positive effect on starch concentration was not statistically significant, a dilution effect by starch may be of importance for some elements. However, for most of the minerals the eCO2 effect was not strongly
related to the effect on grain yield, suggesting that dilution was not of large importance. The association with N was strong for eCO2 effects on S and Fe, elements being important components of
proteins, and fairly strong also for P. The response functions and relationships between different elements and N presented in this study can be used in risk assessments of effects on nutrition in a future high CO2 world.
Supplementary Materials: The following are available online at www.mdpi.com/link, Table S1: Data sources, grain yield, N, starch, and minerals, Table S2: Data sources for baking properties.
Acknowledgments: The work by M.B. and H.P. was supported by the strategic research area Biodiversity and Ecosystem Services in a Changing Climate (BECC, http://www.becc.lu.se/).
Author Contributions: M.B. and H.P. conceived and designed the study; data collection was made by M.B. in close collaboration with P.H.; all authors participated in the analysis of the data; M.B. wrote the paper with substantial input from P.H. and H.P.
Conflicts of Interest: The authors declare no conflict of interest. The founding sponsors had no role in the design of the study, in the collection, analyses, or interpretation of data, in the writing of the manuscript, and in the decision to publish the results.
References
1. IPCC, Climate chang 2013: The physical science basis. 2013.
2. Long, S.P.; Ainsworth, E.A.; Rogers, A.; Ort, D.R., Rising atmospheric carbon dioxide: Plants face the future. Annu Rev Plant Biol 2004, 55, 591-628.
3. Parry, M.L.; Rosenzweig, C.; Iglesias, A.; Livermore, M.; Fischer, G., Effects of climate change on global food production under sres emissions and socio-economic scenarios. Global Environ Chang 2004, 14, 53-67.
4. Manderscheid, R.; Weigel, H.J., Photosynthetic and growth responses of old and modern spring wheat cultivars to atmospheric CO2 enrichment. Agr Ecosyst Environ 1997, 64, 65-73.
5. Schmid, I.; Franzaring, J.; Muller, M.; Brohon, N.; Calvo, O.C.; Hogy, P.; Fangmeier, A., Effects of CO2 enrichment and drought on photosynthesis, growth and yield of an old and a
modern barley cultivar. J Agron Crop Sci 2016, 202, 81-95.
6. Amthor, J.S., Effects of atmospheric CO2 concentration on wheat yield: Review of results from
experiments using various approaches to control co2 concentration. Field Crop Res 2001, 73,
1-34.
7. Long, S.P.; Ainsworth, E.A.; Leakey, A.D.B.; Morgan, P.B., Global food insecurity. Treatment of major food crops with elevated carbon dioxide or ozone under large-scale fully open-air conditions suggests recent models may have overestimated future yields. Philos T Roy Soc B 2005, 360, 2011-2020.
8. Schimel, D., Climate change and crop yields: Beyond cassandra. Science 2006, 312, 1889-1890. 9. Ziska, L.H.; Bunce, J.A., Predicting the impact of changing CO2 on crop yields: Some thoughts
on food. New Phytol 2007, 175, 607-617.
10. Korner, C., Plant co2 responses: An issue of definition, time and resource supply. New Phytol
2006, 172, 393-411.
12. Loladze, I., Hidden shift of the ionome of plants exposed to elevated CO2 depletes minerals
at the base of human nutrition. Elife 2014, 3.
13. Leakey, A.D.B.; Ainsworth, E.A.; Bernacchi, C.J.; Rogers, A.; Long, S.P.; Ort, D.R., Elevated CO2 effects on plant carbon, nitrogen, and water relations: Six important lessons from face. J
Exp Bot 2009, 60, 2859-2876.
14. Simpson, R.J.; Lambers, H.; Dalling, M.J., Nitrogen redistribution during grain-growth in wheat (triticum-aestivum l) .4. Development of a quantitative model of the translocation of nitrogen to the grain. Plant Physiol 1983, 71, 7-14.
15. Taub, D.R.; Miller, B.; Allen, H., Effects of elevated co2 on the protein concentration of food
crops: A meta-analysis. Glob Change Biol 2008, 14, 565-575.
16. McGrath, J.M.; Lobell, D.B., Reduction of transpiration and altered nutrient allocation contribute to nutrient decline of crops grown in elevated CO2 concentrations. Plant Cell
Environ 2013, 36, 697-705.
17. Bloom, A.J., Photorespiration and nitrate assimilation: A major intersection between plant carbon and nitrogen. Photosynth Res 2015, 123, 117-128.
18. Pleijel, H.; Uddling, J., Yield vs. Quality trade-offs for wheat in response to carbon dioxide and ozone. Glob Change Biol 2012, 18, 596-605.
19. Ainsworth, E.A.; Rogers, A., The response of photosynthesis and stomatal conductance to rising [CO2]: Mechanisms and environmental interactions. Plant Cell Environ 2007, 30,
258-270.
20. Högy, P.; Wieser, H.; Kohler, P.; Schwadorf, K.; Breuer, J.; Franzaring, J.; Muntifering, R.; Fangmeier, A., Effects of elevated CO2 on grain yield and quality of wheat: Results from a
3-year free-air CO2 enrichment experiment. Plant Biology 2009, 11, 60-69.
21. Myers, S.S.; Zanobetti, A.; Kloog, I.; Huybers, P.; Leakey, A.D.B.; Bloom, A.J.; Carlisle, E.; Dietterich, L.H.; Fitzgerald, G.; Hasegawa, T., et al., Increasing CO2 threatens human
nutrition. Nature 2014, 510, 139-+.
22. Myers, S.S.; Wessells, K.R.; Kloog, I.; Zanobetti, A.; Schwartz, J., Effect of increased concentrations of atmospheric carbon dioxide on the global threat of zinc deficiency: A modelling study. Lancet Glob Health 2015, 3, E639-E645.
23. EFSA Cadmium in food; The EFSA Journal 980, 2009; pp 1-139.
24. Satarug, S.; Garrett, S.H.; Sens, M.A.; Sens, D.A., Cadmium, environmental exposure, and health outcomes. Environ Health Persp 2010, 118, 182-190.
25. Högy, P.; Fangmeier, A., Effects of elevated atmospheric CO2 on grain quality of wheat. J
Cereal Sci 2008, 48, 580-591.
26. Blumenthal, C.; Rawson, H.M.; McKenzie, E.; Gras, P.W.; Barlow, E.W.R.; Wrigley, C.W., Changes in wheat grain quality due to doubling the level of atmospheric CO2. Cereal Chem
1996, 73, 762-766.
27. Högy, P.; Wieser, H.; Kohler, P.; Schwadorf, K.; Breuer, J.; Erbs, M.; Weber, S.; Fangmeier, A., Does elevated atmospheric CO2 allow for sufficient wheat grain quality in the future? J Appl
Bot Food Qual 2009, 82, 114-121.
28. Kimball, B.A.; Morris, C.F.; Pinter, P.J.; Wall, G.W.; Hunsaker, D.J.; Adamsen, F.J.; LaMorte, R.L.; Leavitt, S.W.; Thompson, T.L.; Matthias, A.D., et al., Elevated CO2, drought and soil
29. Piikki, K.; De Temmerman, L.; Ojanpera, K.; Danielsson, H.; Pleijel, H., The grain quality of spring wheat (triticum aestivum l.) in relation to elevated ozone uptake and carbon dioxide exposure. Eur J Agron 2008, 28, 245-254.
30. Fernando, N.; Panozzo, J.; Tausz, M.; Norton, R.M.; Neumann, N.; Fitzgerald, G.J.; Seneweera, S., Elevated co2 alters grain quality of two bread wheat cultivars grown under
different environmental conditions. Agr Ecosyst Environ 2014, 185, 24-33.
31. Wrigley, C.W.; Békés, F.; Bushuk, W., Chapter 1 gluten: A balance of gliadin and glutenin. In Gliadin and glutenin: The unique balance of wheat quality, AACC International, Inc.: 2006; pp 3-32.
32. Kindred, D.R.; Gooding, M.J.; Ellis, R.H., Nitrogen fertilizer and seed rate effects on hagberg failing number of hybrid wheats and their parents are associated with alpha-amylase activity, grain cavity size and dormancy. J Sci Food Agr 2005, 85, 727-742.
33. Hruskova, M.; Skodova, V.; Blazek, J., Wheat sedimentation values and falling number. Czech J Food Sci 2004, 22, 51-57.
34. Agren, G.I.; Weih, M., Plant stoichiometry at different scales: Element concentration patterns reflect environment more than genotype. New Phytol 2012, 194, 944-952.
35. Waters, B.M.; Uauy, C.; Dubcovsky, J.; Grusak, M.A., Wheat (triticum aestivum) nam proteins regulate the translocation of iron, zinc, and nitrogen compounds from vegetative tissues to grain. J Exp Bot 2009, 60, 4263-4274.
36. Ainsworth, E.A.; Long, S.P., What have we learned from 15 years of free-air CO2 enrichment
(face)? A meta-analytic review of the responses of photosynthesis, canopy. New Phytol 2005, 165, 351-371.
37. Wang, Y.X.; Frei, M., Stressed food - the impact of abiotic environmental stresses on crop quality. Agr Ecosyst Environ 2011, 141, 271-286.
38. Gelang, J.; Pleijel, H.; Sild, E.; Danielsson, H.; Younis, S.; Sellden, G., Rate and duration of grain filling in relation to flag leaf senescence and grain yield in spring wheat (triticum aestivum) exposed to different concentrations of ozone. Physiol Plantarum 2000, 110, 366-375. 39. Broberg, M.C.; Feng, Z.Z.; Xin, Y.; Pleijel, H., Ozone effects on wheat grain quality - a
summary. Environ Pollut 2015, 197, 203-213.
40. Salt, D.E.; Prince, R.C.; Pickering, I.J.; Raskin, I., Mechanisms of cadmium mobility and accumulation in indian mustard. Plant Physiol 1995, 109, 1427-1433.
41. Feng, Z.Z.; Kobayashi, K.; Ainsworth, E.A., Impact of elevated ozone concentration on growth, physiology, and yield of wheat (triticum aestivum l.): A meta-analysis. Glob Change Biol 2008, 14, 2696-2708.
42. Tulchinsky, T.H., Micronutrient deficiency conditions: Global health issues. Public Health Reviews 2010, 32, 243-255.
43. Federov, S. Getdata graph digitizer, 2.26.0.20; 2002.
44. Rosenberg, M.S.; Adams, D.C.; Gurevitch, J. Metawin: Statistical software for meta-analysis, Version 2.0; Sinauer Associates, Inc: Sunderland, MA, USA, 2000.
45. Curtis, P.S.; Wang, X.Z., A meta-analysis of elevated CO2 effects on woody plant mass, form,
and physiology. Oecologia 1998, 113, 299-313.
47. GraphPad Software Inc., Prism, 7; 2016.
48. Motulsky, H.J.; Brown, R.E., Detecting outliers when fitting data with nonlinear regression – a new method based on robust nonlinear regression and the false discovery rate. BMC Bioinformatics 2006, 7, 1-20.
![Figure 3. a) Meta-analysis of eCO2 effects on starch concentration using ambient [CO2] as reference](https://thumb-us.123doks.com/thumbv2/123dok_us/993029.1598997/6.595.95.470.175.569/figure-meta-analysis-effects-starch-concentration-ambient-reference.webp)
![Table 1. Response functions for regression of concentration and yield of N, starch, and minerals with [CO2]](https://thumb-us.123doks.com/thumbv2/123dok_us/993029.1598997/7.595.74.525.147.780/table-response-functions-regression-concentration-yield-starch-minerals.webp)
![Figure 5. Response-functions for mineral concentrations of P, Mg, Fe, K, Zn, and S with [CO2]](https://thumb-us.123doks.com/thumbv2/123dok_us/993029.1598997/10.595.92.493.81.627/figure-response-functions-mineral-concentrations-mg-fe-zn.webp)