Development And Validation Of Stability Indicating HPTLC Method For Determination Of Perindopril Erbumine
8
0
0
Full text
(2) Damle M C et al. IRJP 1 (1) 2010 428-435 A literature survey revealed that perindopril, an active pharmaceutical ingredient (API) is official in the British Pharmacopoeia 2. Upon detailed literature survey it was found that, Perindopril has been analyzed by many methods either individually or in combination with some drugs which include HPLC, microcalorimetry and RP-HPLC in combination with losartan and indapamide 3-6. However, only one stability indicating HPLC method has been reported for Perindopril in combination with Indapamide7. To the best of our knowledge, no stability indicating HPTLC (High Performance Thin Layer Chromatography) method has been described for Perindopril erbumine singly. The present work describes the simple, accurate, precise, sensitive stability indicating HPTLC method for the determination of Perindopril erbumine in presence of its degradation product. Stability testing of Perindopril erbumine was carried out according to the International Conference on Harmonization (ICH) guidelines 8-9. The proposed stability indicating HPTLC method was able to separate drug peak from its degradation product. The method was validated according to the ICH guidelines 10 MATERIALS AND METHODS Materials Perindopril erbumine was provided as a gift sample by Matrix Laboratories, Hyderabad. Drug was used as such, without any further purification. Methanol (AR grade), Dichloromethane (AR grade) and Glacial acetic acid (AR grade) were purchased from S. D. fine chemical Laboratories, Mumbai, India. Instruments and Chromatographic conditions Chromatographic separation of drug was performed on Aluminium plates precoated with silica gel 60 F254, purchased from E-Merck, Germany. Sample was applied on the plate as a band with 4 mm width using Camag 100 µl sample syringe (Hamilton, Switzerland) with a Linomat 5 applicator (Camag, Switzerland). Linear ascending development was carried out in a twin trough glass chamber (for 10 x 10 cm) and a densitometric scanning was performed using Camag TLC scanner 3, operated by winCATS software (Version 1.4.3, Camag). Chamber saturation time was 15 min, migration distance was 90 mm, and slit dimensions were 3.00 x 0.45 mm. Selection of detection wavelength After chromatographic development, bands were scanned in the range of 200-400 nm and the spectrum was obtained. Perindopril showed considerable absorbance at 215 nm (Figure 1). Method Development Method development for resolution of Perindopril erbumine from its degradation peaks was started with the development of densitogram with neat solvents in different ratios and combinations of Toluene, Ethyl acetate, Methanol, Dichloromethane, Triethylamine, and Glacial acetic acid. Finally, Dichloromethane: Methanol: Glacial Acetic acid (9:0.8:0.1 v/v/v) was selected as a mobile phase with good resolution from the degradation peaks at Rf 0.56 ± 0.02. Preparation of Stock and Standard Solutions Standard stock solution of Perindopril was prepared by dissolving 10 mg of drug in 10 ml of methanol to get concentration of 1000μg/ml. 5 ml of standard stock solution of Perindopril was then diluted to 10 ml with methanol to get working standard solution 500μg/ml. From the resultant solution, 2, 4, 6, 8, and 10 µl were applied on TLC plate, at a distance of 10 mm from both x-axis and y-axis. Stress Degradation studies Degradation under acid catalysed hydrolytic condition To 5 ml of 5000 µg/ml solution of Perindopril, 5 ml of 1M HCl was added. The volume was made up to 50 ml with methanol. The above solution was then refluxed for 1 hour at 800 C, cooled to room temperature and again made up the volume to 50 ml with methanol to get the final concentration of 500 µg/ml. 6 μl of resultant solution was then applied on TLC plate and densitogram was developed. The degradation peaks (if any) were then determined by spotting 10 times (60 μl) the initial concentration. Degradation under alkali catalysed hydrolytic condition To 5 ml of 5000 µg/ml solution of Perindopril, 5 ml of 0.5M NaOH was added. The volume was made up to 50 ml with methanol. The above solution was then refluxed for 30 minutes at 800 C, cooled to room. IRJP 1 (1) Dec 2010. Page 428-435.
(3) Damle M C et al. IRJP 1 (1) 2010 428-435 temperature and made up the volume to 50 ml with methanol to get the final concentration of 500 µg/ml. 6 μl of resultant solution was then applied on TLC plate and densitogram was developed. The degradation peaks (if any) were then determined by spotting 10 times (60 μl) the initial concentration. Degradation under neutral hydrolytic condition To 5 ml of 5000 µg/ml solution of Perindopril, 5 ml of Distilled Water was added. The volume was made up to 50 ml with methanol. The above solution was then refluxed for 1 hour at 800 C, cooled to room temperature and again made up the volume to 50 ml with methanol to get the final concentration of 500 µg/ml. 6 μl of resultant solution was then applied on TLC plate and densitogram was developed. The degradation peaks (if any) were then determined by spotting 10 times (60 μl) the initial concentration. Degradation under oxidative condition To 5 ml of 5000 µg/ml solution of Perindopril, 5 ml of H2O2 was added. The volume was made up to 50 ml with methanol. The above solution was then refluxed for 1 hour at 800 C, cooled to room temperature and again made up the volume to 50 ml with methanol to get the final concentration of 500 µg/ml. 6 μl of resultant solution was then applied on TLC plate and densitogram was developed. The degradation peaks (if any) were then determined by spotting 10 times (60 μl) the initial concentration. Degradation under dry heat Dry heat studies were performed by keeping drug sample in oven (800 C) for 24 hours. 10 mg of exposed drug was weighed accurately and transferred to a 10 ml volumetric flask and dissolved in methanol, the volume was then made with methanol to get concentration of 1000 µg/ml. 5 ml of the resultant solution was then diluted to 10 ml with methanol to get the concentration of 500 µg/ml. 6 μl of resultant solution was applied on TLC plate and densitogram was developed. The degradation peaks (if any) were then determined by spotting 10 times (60 μl) the initial concentration. Photo-degradation studies The photochemical stability of the drug was studied by exposing the drug to UV light providing illumination of NLT 200 watt hr/m2 followed by visible light providing illumination of NLT 1.2 million lux-hr. After exposure, accurately weighed 10 mg of drug was transferred to 10 ml of volumetric flask; the volume was made up with methanol (1000 µg/ml). 5 ml of the resultant solution was then diluted to 10 ml with methanol to get the concentration of 500 µg/ml. 6 μl of resultant solution was applied on TLC plate and densitogram was developed. The degradation peaks (if any) were then determined by spotting 10 times (60 μl) the initial concentration. Method Validation Linearity and Range The linearity of an analytical procedure is its ability to obtain test results which are directly proportional to the concentration of analyte in the sample. Linearity was studied by analyzing five concentrations of the drug, and process was repeated for five times. It was done in the concentration range of 1-5 μg/band. Precision Precision of the system was evaluated by analyzing six independent sample preparations obtained from homogenous sample and % RSD value obtained was calculated to determine any intra-day variation. These studies were also repeated on different days to determine inter-day variation. Accuracy To check accuracy of the method, recovery studies were carried out by addition of standard drug solution to pre-analyzed sample solution at three different levels of 80, 100 and 120 %. Mean % recovery for Perindopril was then determined. Limit of detection and limit of quantitation The detection limit of an individual analytical procedure is the lowest amount of analyte in a sample, which can be detected but not necessarily quantitated as an exact value. The quantitation limit of an individual analytical procedure is the lowest amount of analyte in a sample, which can be quantitatively determined with suitable precision and accuracy.. IRJP 1 (1) Dec 2010. Page 428-435.
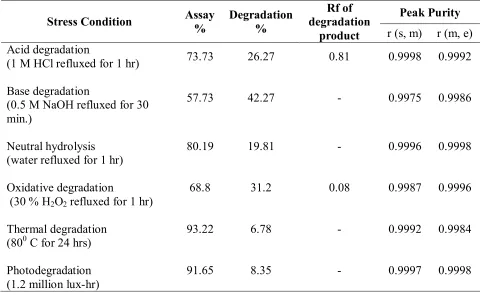
(4) Damle M C et al. IRJP 1 (1) 2010 428-435 Specificity The specificity of the method was ascertained by peak purity profiling studies. Purity of the drug peak was ascertained by analyzing the spectrum at peak start, middle and at peak end. Robustness Robustness of the method was determined by making slight deliberate changes like chamber saturation time and ± 2% variation in mobile phase compositions. RESULTS AND DISCUSSION Development of the optimum mobile phase TLC procedure was optimized with a view to develop a stability indicating method for determination of Perindopril. The drug reference standard was spotted on TLC plate and developed in different solvent systems. Best suited mobile phase was found to be Dichloromethane : Methanol : Glacial Acetic Acid (9:0.8:0.1 v/v/v) with Rf 0.56 ± 0.02 (Figure 2). Stress degradation studies The degradation study indicated that Perindopril is degraded in acid, base, oxidation and to some extent in neutral hydrolysis, thermal and photodegradation. Results of the stress degradation studies are presented in Table 1. An additional peak was observed for acid induced degradation at Rf 0.81 (Figure 3 and 4) and degradation under oxidative condition at Rf 0.08 (Figure 6). By comparison of the overlain spectra of the drug peak and an additional peak, it was confirmed that an additional peak observed is the product of degradation (Figure 5 and 7). Jogia H., et. al.7 reported 2.78 % degradation upon acid hydrolysis (1 M HCl for 30 min. at 1000 C), 10.55 % degradation upon base hydrolysis (0.1 M NaOH for 5 min. at room temp.), 78.86 % upon thermal degradation (800 C for 24 hrs) and 0.76 % upon photodegradation (1.2 million lux-hr). Whereas, Perindopril was found to be stable upon oxidative degradation (10 % H2O2 for 2 hrs at 400 C). However, variation in stress degradation pattern was found in the present study as compared to that observed by Jogia H., et. al. 26.27% degradation was found upon acid hydrolysis (1 M HCl refluxed for 1 hr), 42.27 % degradation upon base hydrolysis (0.5 M NaOH refluxed for 30 min.), 31.2% upon oxidative degradation (30 % H2O2 refluxed for 1 hr), 19.81 % upon neutral hydrolysis (water refluxed for 1 hr), 8.35 % upon photodegradation (1.2 million lux-hr), whereas it was found to be relatively stable, 6.78 % upon thermal degradation (800 C for 24 hrs). Validation of the developed stability indicating method HPTLC method was validated as per the ICH guidelines. The developed method was found to be linear within the range of 1-5 µg/band with r2 value of 0.998. The accuracy of method was determined at 80, 100 and 120 % level. The % recovery was found to be within the limits of 98 % to 102 % for Perindopril erbumine. Precision was calculated as interday and intraday variations. For Intraday precision, % RSD (Relative Standard Deviation) was found to be not more than 1 % and for Interday precision it was found to be not more than 1.5 %. For robustness studies, there were no significant changes in Rf and peak areas, which demonstrated that the developed HPTLC method is robust. Limit of detection and limit of quantification was found to be 250 ng/band and 825 ng/band respectively. Peak purity was found to be more than 0.995, which demonstrated that the method is specific. ACKNOWLEDGMENT Authors are thankful to Matrix Laboratories, Hyderabad for providing working standard of Perindopril erbumine. Authors are also thankful to the Principal, Dr. (Mrs.) A. R. Madgulkar, AISSMS College of Pharmacy, Pune for providing required facilities for research work. REFERENCES 1. Erk N. Comparision of spectrophotometric and LC method for the determination of Perindopril and Indapamide in pharmaceutical formulations. Journal of Pharmaceutical and Biomedical Analysis. 2001; 26:43-52.. IRJP 1 (1) Dec 2010. Page 428-435.
(5) Damle M C et al. IRJP 1 (1) 2010 428-435 2. British Pharmacopoeia. Vol 2. London, UK: British Pharmacopoeial Commission Office; 2007: 1609–1611. 3. Medenica M, Ivanovic D, Maskovic M, Jancic B, Malenovic A. Evaluation of impurity level of perindopril tert-butylamine in tablets. Journal of Pharmaceutical and Biomedical Analysis. 2007; 44:1087–1094. 4. Simoncic Z, Roskar R, Gartner A, Kogej K, Kmetec V. The use of microcalorimetry and HPLC for the determination of degradation kinetics and thermodynamic parameters of Perindopril Erbumine in aqueous solutions. International Journal of Pharmaceutics. 2008; 356: 200–205. 5. Lakshmi KS, Sivasubramanian L, Pandey AK. A validated RP-HPLC method for simultaneous determination of losartan and perindopril in solid dosage form. The Pharma Review. 2010; 131-133. 6. Bharadwaj V, Gulecha B, Madgulkar A, Damle M. RP-HPLC method for simultaneous estimation of perindopril and indapamide in tablet formulation. Indian Drugs. 2007; 44(7): 504–508. 7. Jogha H, Khandelwal U, Gandhi T, Singh S. Development and validation of stability-indicating assay method for simultaneous determination of perindopril and indapamide in combined dosage form by reversed-phase high-performance liquid chromatography. J. AOAC Int. 2010; 93(1): 108-115. 8. ICH, Q1A (R2) (2003) Stability Testing of New Drug Substances and Products, International Conference on Harmonization, IFPMA, Geneva, Switzerland. 9. ICH, Q1B (1996) Stability Testing: Photostability Testing of New Drug Substances and Products, International Conference on Harmonization, IFPMA, Geneva, Switzerland. 10. ICH, Q2 (R1) (2005) Validation of Analytical Procedure: Text and Methodology, International Conference on Harmonization, IFPMA, Geneva, Switzerland. Table 1: Summary of Stress Degradation Study Assay %. Degradation %. Rf of degradation product. r (s, m). r (m, e). 73.73. 26.27. 0.81. 0.9998. 0.9992. 57.73. 42.27. -. 0.9975. 0.9986. Neutral hydrolysis (water refluxed for 1 hr). 80.19. 19.81. -. 0.9996. 0.9998. Oxidative degradation (30 % H2O2 refluxed for 1 hr). 68.8. 31.2. 0.08. 0.9987. 0.9996. Thermal degradation (800 C for 24 hrs). 93.22. 6.78. -. 0.9992. 0.9984. Photodegradation (1.2 million lux-hr). 91.65. 8.35. -. 0.9997. 0.9998. Stress Condition Acid degradation (1 M HCl refluxed for 1 hr) Base degradation (0.5 M NaOH refluxed for 30 min.). IRJP 1 (1) Dec 2010. Peak Purity. Page 428-435.
(6) Damle M C et al. IRJP 1 (1) 2010 428-435. Figure 1: UV spectrum of Perindopril erbumine. Figure 2: Representative densitogram of Blank i.e; methanol (A) and of Perindopril erbumine 2 µg/band, Rf - 0.56 ± 0.02 (B).. Figure 3: Representative densitogram of HCl Blank (A) and acid induced degradation of Perindopril erbumine, 3 µg/band (B).. IRJP 1 (1) Dec 2010. Page 428-435.
(7) Damle M C et al. IRJP 1 (1) 2010 428-435. Figure 4: Representative densitogram of acid induced degradation of Perinopril erbumine (30 µg/band, Rf – 0.56 ± 0.02) and of the degradation product (Rf – 0.81).. Figure5: Overlain spectra of Perindopril erbumine and the product of degradation (Rf 0.81) obtained after acid induced degradation.. Figure 6: Representative densitogram of H2O2 Blank (A) and oxidative degradation of Perindopril, 30 µg/band, Rf – 0.56 ± 0.02 with product of degradation at Rf – 0.08 (B).. IRJP 1 (1) Dec 2010. Page 428-435.
(8) Damle M C et al. IRJP 1 (1) 2010 428-435. Figure 7: Overlain spectra of Perindopril erbumine and the product of degradation (Rf 0.08) obtained after oxidative degradation.. Source of support: Nil, Conflict of interest: None Declared. IRJP 1 (1) Dec 2010. Page 428-435.
(9)
Figure


Related documents
Effect of fertilizer factory and distillery effluent on seed germination, seedling growth, pigment content and biomass of Phaseolus radiatus L. and
Across England and Wales, the Long Drought period (1890–1910) was the longest event with the largest accumulated deficits events but the most severe event according to mean deficit
In the case of volcanic forcing it appears that the amplitude of the temperature response to volcanic eruptions over tropical South America is larger than the rather weak and
The 3 food category expenditures for vegetables, fruits and grains and total food expenditure were modeled simultaneously with the assumption that total food spending was fixed,
Department; PORALG: President ’ s Office - Regional Administration and Local Government; PPP: Public-Private Partnership; PPRA: Public Procurement Regulatory Authority; PV:
The objective of this study was therefore to investigate what the added value of LDCT was among healthy smokers and patients with stable COPD when examined with V/P
Ghana has had a Ministry of Works and Housing for several decades now, overseeing the development of the industry (not only concerned with public projects as
Objectives: The identification of the problems and characteristics of geriatric patients at the beginning of post-acute rehabilitation therapy which predict the worsening of
