Prediction of Tourist Quantity Based on RBF
Neural Network
HuaiQiang Zhang
College of Information Science and Technology, Hainan University, Haikou, China [email protected]
JingBing Li*
College of Information Science and Technology, Hainan University, Haikou, China [email protected]
Abstract—Tourist quantity is an important factor deciding economic benefits and sustainable development of tourism. Thus tourist quantity prediction becomes the important content of tourism development planning. Based on the tourist quantity of Hainan province for more than twenty years, this paper establishes tourist quantity prediction model according to RBF neural network [1], in which the principle and algorithm of RBF neural network is used. And this paper also predicts the future tourist quantity of Hainan province. The Matlab emulation result of RBF neural network model shows based on RBF neural network tourist quantity prediction model can exactly predict the future tourist quantity of Hainan province, thus providing a new idea and mean for tourist quantity prediction.
Index Terms—RBF neural network, International Tourism Island, Tourist quantity, Predict
I. INTRODUCTION
Hainan Province, called Joan, in the southernmost tip of China and Guangdong Qiongzhou Strait across the North Sea, the vast South China Sea in the south. Hainan is the only tropical island province in China, has beautiful scenery and pleasant climate, is one of the famous tropical resort. Due to the geographical and natural features, tourism services become a pillar industry in Hainan. On April 25,2008, in Haikou, the Hainan provincial government held the press conference which is about building the Hainan International tourism island, beginning the construction of Hainan international tourist island. On January 4, 2010, the State Council issued "The State Council on Promoting the Construction of Hainan Island International Tourism Development of views". So far, Hainan international tourism island construction is on track [2]. With the development of Hainan international tourism island strategy, Hainan Province travel services will have a new period of development. During this period, the tourist quantity will continue to increase in Hainan which will cause some damages to the Hainan Provincial Tourism landscape resources and the environment. Therefore, in the Hainan international tourism island development planning and feasibility study process, Hainan tourism scale is the scientific basis for forecasting tourism development, establishing tourism management decisions, reasonable controlling visitors scale, realizing the sustainable development of Hainan tourism.
Now the forecasting methods which are universally adopted have the following kinds: simple regression analysis method (SRA), exponential smoothing method (ES), comprehensive autoregressive mobile analysis method (CAMA), etc. These methods are very good applied in some predictions, but they still exist many defects [3]:These methods have good effect of linear prediction, but are not very precise of nonlinear prediction; These methods don’t apply to multi-factor forecast; The establishment of prediction model is heavily dependent on knowledge level of the predict people.
Artificial neural network (ANN) modeling method is an effective analysis method for forecasting, which can well reveal the correlation of nonlinear time series in delay state space. So ANN can achieve the purpose of prediction. The Kolmogorov continuation theorem in neural network theory ensures the prediction feasibility of the neural network which is used for time series from the view of mathematics. The tourist quantity is decided by many objective factors. The forecast of tourist quantity has not good ways now. As the tourist quantity has a good nonlinear characteristic and the RBF neural network is better used to handle nonlinear problems, the RBF neural network can apply to forecast the tourist quantity. The article establishes prediction model and predicts the tourist quantity. The result of experiment proves that the prediction model has good prediction effect.
II. THE PRINCIPLE, STRUCTURE AND ALGORITHM OF RBF NEURAL NETWORK
A The principle of RBF neural network
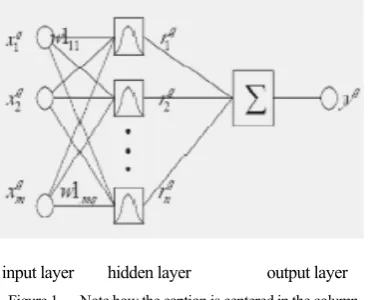
RBF neural network is the abbreviation of radial basis function neural network, which is a kind of feed-forward neural network. Its construction is based on the function approximation theory. The distance ||dist|| between weight vector and threshold vector is used to independent variable of the transfer function of the network “adbas”. The ||dist|| is got through the product of input vector and weighted matrix’s row vector. Each hidden layer neurons transfer function of RBF neural network makes up a base function of a fitting plane, so RBF neural network gets the name.
B The structure of RBF network
input layer hidden layer output layer
Figure 1. Note how the caption is centered in the column.
Figure 2. The input and output of RBF neural network hidden layer neurons
with radial basis function neurons and an output layer with linear neurons. As shown in Figure 1 [4].
Hidden layer is usually using radial basis function as excitation function and the radial basis excitation function is
commonly gaussian function, which is usually expressed as:
(
)
(
)
2exp
1
1
q q
i i i
R
x c
−
=
⎡
⎢
−
w
−
X
×
b
⎤
⎥
⎣
⎦
(1)Where
1
qi
w
−
X
is the Euclidean distance,c
is thecenter of gaussian function.
1 2
( , ,..., ,..., )
q q q q qj m
X
=
x x
x
x
is theqth
input data.The distance between the weight vector
W
1
i, connectedto the inputting layer and in the every neuron in the hidden layer, and the input vector q
X
is multiplied by thethreshold
b
1
i ,which is considered as its own input . AsFigure2 shows:
Thus we get the
ith
input of hidden layer neuron whichcan be expressed as q i
k
:(
)
21
1
q q
i ji j i j
k
=
∑
w
−
x
×
b
(2) Theith
output of hidden layer neuron can be expressed asq i
r
:(
)
2exp
1
q1
q
i ji j i
j
w
x
b
r
=
⎛
⎜
⎜
⎝
∑
−
×
⎞
⎟
⎟
⎠
(3)The output of RBF neural network is the weighted summation of each hidden layer neurons's output and the excitation function is using pure linear function, so the
qth
output layer neurons's output which is corresponding to the
qth
input can be expressed asy
q:1
2
n q q
i i i
y
r
w h
=
=
∑
×
(4)C The learning algorithm of RBF neural network
RBF neural network learning process can be divided into two stages [5]: first stage, self-organizing learning phase, this phase is the unsupervised learning process, solving the center and variance of the hidden layer base functions; second stage, tutor learning phase, this phase is solving weights which is between the hidden layer and output layer. Concrete steps are as follows:
a Solving basis function center
1) Initialization of the network: randomly selecting some
training samples as the cluster centers
c
(i
=1,2,3,…h
) 。2) Putting the input samples into groups by nearest
neighbor rule: the input samples are assigned to each cluster set of input samples according to the Euclidean distance between input samples and center of the basis function.
3)Re-adjusting the center of cluster set: calculating
average of each training sample in the center of cluster set, getting new cluster set center, If the new cluster center no longer changer, then the resulting
c
is final RBF neuralnetwork basis function center. Otherwise back to 2), entering
the next round of solution.
b Solving variance
The basis function of RBF neural network is Gaussian function, therefore variance can be given by next type:
max
2
i
h
c
σ
=
i
=
1,2,3. . . . .
h
(5)max
c
is maximum distance among the selected centers.c Calculating weights between the hidden layer and output layer
The weights connecting the hidden layer to output layer of neurons can be directly obtained by the least square method. Its calculation formula is as follows:
2 2
max
exp
h
q iw
x c
c
⎛
⎞
⎜
⎟
=
⎜
−
⎟
⎝
⎠
(6)Figure 3. RBF neural network trainning result
A RBF neural network input variables and output variables
Input variable selection is an important task before the RBF neural network modeling, whether to choose a set of input variables which can best reflect the reason for desired output changes is directly related to the performance of neural network prediction. The number of tourist is restricted by many factors, for example, geography, environment, culture, government policy, etc. If all these factors are considered, it will bring a lot of inconvenience to predict. Tourist quantity every five years as the neural network input variables is the innovation of the article, so input samples can be determined by the input variable. We can select the sixth year number of tourists after every five years as the neural network output variable.
B Input samples pretreatment
Since the implicit function of RBF neural network is Gaussian function, which general requires for input value between 0 and 1, do normalize on the number of Hainan province tourists from 1988 to 2008. Normalization is basically the same way to statistical data normalization, generally using the following form:
__
min
max min
X
X
X
X
X
−
=
−
(7) Where X is the actual value of sample;X
max takes alarge value, ensuring forecast year is less than the value;
min
X
takes a sample of data is less than the minimumvalue to ensure normalized value is not close to 0. After the pretreatment of data completes the training, do process data (inverse transform) to get the actual value.
C Determining training samples and test samples
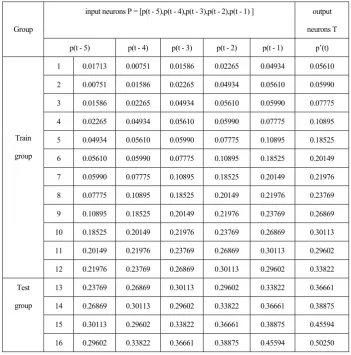
The number of input layer neurons corresponding to the dimension of input vectors, the number of input layer nodes is too much, causing the network to learn the number of relatively large; input nodes is too little, follow-up values can not reflect the value of the correlation between the precursor.From the above we can determine the number of input neuron of RBF neural network is 5, and the number of output neurons is 1. Treating the samples as follows [6]: Input neuron P=[p(t-5),p(t-4),p(t-3),p(t-2),p(t-1)]; Output neurons T=[p’(t)]. Where, t = 1993, 1994 ... ... 2008, P (t) denote the normalized number of tourism at t year. In this method, we can obtain the training samples and test samples, as shown in table Ⅱ. To test the accuracy and efficiency of
the network, select group 1 to 12 group data as the study samples, the group13 to group 16 as the test samples and using the trained RBF neural networks to predict.
Creating a precise neural network by Newbe function, this function creates RBF network, automatically select the number of hidden layer and make the error to 0. MATLAB codes are as follows [7]:
tt=t_data(:,6);x=t_data(:,1:5);tt=tt'; c=x;
delta=cov(x'); delta=sum(delta); for i=1:1:12
for j=1:1:12
R(i,j)=((x(i,:)-c(j,:)))*((x(i,:)-c(j,:))'); R(i,j)=exp(-R(i,j)./delta(j));
end end p=R;
err_goal=0.00001; SPREAD =1;
net=newrbe(p,tt,err_goal, SPREAD,200,1); Training sample, shown in Figure 3. TABLE I.
THE ACTUAL TOURIST QUANTITY OF HAINAN PROVINCE IN 1988 TO 2008
Year 1988 1989 1990 1991 1992 1993 1994
Tourists quantity(million) 118.54 88.05 113.46 140.61 247.37 274.41 289.60
Year 1995 1996 1997 1998 1999 2000 2001
Tourists quantity(million) 361.01 485.82 791.00 855.97 929.07 1000.76 1124.76
Year 2002 2003 2004 2005 2006 2007 2008
Tourists quantity(million) 1254.54 1234.11 1402.88 1516.47 1605.02 1873.78 2060.00
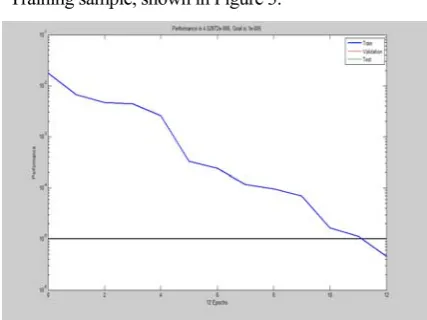
Figure 4. RBF neural network learning and training curve Where, p is the input vector, tt is the target vector.
SPREAD is the density of basis functions, SPREAD is larger the function is smoother, where selecting SPREAD = 1.
Then we can get the RBF neural network learning and training curve, shown in Figure 4. MATLAB codes are as follows:
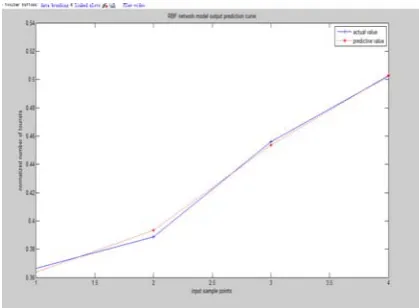
ty=sim(net,p); tE=tt-ty; tSSE=sse(tE); tMSE=mse(tE); figure;
plot(tt,'-+'); hold on; plot(ty,'r:*');
legend('actual value','predictive value');
title('RBF network model output prediction curve');
xlabel('input sample points');
ylabel('normalized number of tourists');
Then testing the neural network and verifying the prediction performance, shown in Figure 5. MATLAB codes are as follows:
y=sim(net,P_test)
Where, P_test is the network test samples. The results are as follows:
y= 0.3639 0.3932 0.4536 0.5030
After training and testing the network, the network output values obtained through inverse transform are compared with the actual values to check whether it meet the requirements of their error, as shown in TABLE III.
We can see form TABLE III, RBF neural network can reach 99.0% accuracy, it meets the prediction requirements. TABLE II.
THE ACTUAL TOURIST QUANTITY OF HAINAN PROVINCE IN 1988 TO 2008
Group
input neurons P = [p(t - 5),p(t - 4),p(t - 3),p(t - 2),p(t - 1) ] output
neurons T
p(t - 5) p(t - 4) p(t - 3) p(t - 2) p(t - 1) p’(t)
Train
group
1 0.01713 0.00751 0.01586 0.02265 0.04934 0.05610
2 0.00751 0.01586 0.02265 0.04934 0.05610 0.05990
3 0.01586 0.02265 0.04934 0.05610 0.05990 0.07775
4 0.02265 0.04934 0.05610 0.05990 0.07775 0.10895
5 0.04934 0.05610 0.05990 0.07775 0.10895 0.18525
6 0.05610 0.05990 0.07775 0.10895 0.18525 0.20149
7 0.05990 0.07775 0.10895 0.18525 0.20149 0.21976
8 0.07775 0.10895 0.18525 0.20149 0.21976 0.23769
9 0.10895 0.18525 0.20149 0.21976 0.23769 0.26869
10 0.18525 0.20149 0.21976 0.23769 0.26869 0.30113
11 0.20149 0.21976 0.23769 0.26869 0.30113 0.29602
12 0.21976 0.23769 0.26869 0.30113 0.29602 0.33822
Test
group
13 0.23769 0.26869 0.30113 0.29602 0.33822 0.36661
14 0.26869 0.30113 0.29602 0.33822 0.36661 0.38875
15 0.30113 0.29602 0.33822 0.36661 0.38875 0.45594
Figure 5. RBF network model output prediction curve This provides an accurate basis for predicting tourists
quantity in the future.
Enter the actual value from 2004 to 2008, we can obtain the normalized predicted value in 2009.Similarly, after a multi-step iterative, we can get the normalized predicted value from 2010 to 2018, as shown in TABLE IV.
Then after inverse transform, the predicted value can be obtained from 2010 to 2019, as shown in TABLE V.
As can be seen from TABLE V, after a slow growth phase from 2009 to 2015, tourist quantity in Hainan Province will be gradually stabilized, in between 34 million to 35 million.
Ⅳ.CONCLUSION
This paper has presented a tourists prediction method based on RBF neural network. Through RBF neural network adaptive, self-organization and self-learning function, making tourists quantity every 5 years as the RBF neural network’s input, we can predict tourists quantity in the sixth year. After MATLAB training, forecasting, simulation, this method achieves a good prediction effect. The use of this method provides a new way of thinking for simulating and predicting tourists quantity in Hainan province, provides a reference for the construction of Hainan International Tourism Island.
ACKNOWLEDGEMENTS
This work is partly supported by Hainan University Graduate Education Reform Project (yjg0117), and by Natural Science Foundation of Hainan Province (60894), and by Education Department of Hainan Province project (Hjkj2009-03).
REFERENCES:
[1] WEI Hai-kun. Neural network structure design theory and method [M]. Beijing: National Defence Industry Press, 2005.2 [2] InternationalTravelHainanIsland.Http://baike.baidu.com/view/
3139516.htm?fr=ala0_1_1
TABLE III.
RBF NEURAL NETWORK ANALYSIS TABLE ACCURACY
Year Actual value(million) Fitted value(million) Absolute error
2005 1516.47 1505.60 10.87
2006 1605.02 1622.80 -17.78
2007 1873.78 1864.40 9.38
2008 2060.00 2062.00 -2.00
TABLE IV.
THE NORMALIZED PREDICTED VALUE OF TOURIST QUANTITY FROM 2009 TO 2018
year 2009 2010 2011 2012 2013
Predictive value 0.58336 0.63658 0.67832 0.72896 0.76542
year 2014 2015 2016 2017 2018
Predictive value 0.81986 0.83942 0.84738 0.85106 0.86256
TABLE V.
PREDICTIVE VALUE OF TOURIST QUANTITY FROM2010 TO 2019
Year 2010 2011 2012 2013 2014
Predictive value(million) 2373.44 2586.32 2753.28 2955.84 3101.28
Year 2015 2016 2017 2018 2019
[3] Sun Yang-ping, Zhang Lin, Lv Ren-yi. Tourist quantity forecast by using neural network [J].Human Geography, 2002,17(6):pp.50-52
[4] Liu Xiu-qing, Wang Xiao-yuan, Yu Ren-de. Study on traffic accidents prediction model based On RBF neural network [J]. Computer Engineering and Applications 2009,45(17),pp. 188– 190
[5] Zhang De-feng. MATLAB Neural Network Application Design [M]. Beijing: Mechanical Industry Press, 2009.1 [6] Li Jing-bing,Zhang Huai-qiang. Application of BP neural
network model on forecasting the number of tourists in Hainan province[C]. International Conference on Computer and Communication Technologies in Agriculture Engineering (CCTAE),2010,pp.502-507
[7] Zhang De-feng. MATLAB Neural Network Simulation and Application [M].Beijing: Electronic Industry Press, 2009.6
HuaiQiang Zhang, was born in
Shandong, in March 1986, received B.S. degree in communication engineering fromm Hainan University, China in 2009. He is a student for the M.S degree in communication and information system at Hainan University. His current research interests include digital watermarking, artificial neural networks.
JingBing Li was born in Beijing, in
1966, received B.S. degree in industrial automation from Wuhan University of Technology, China in 1989 and M.S. degree in industrial automation from Beijing Institute of Technology, China in 1996 and Ph.D. degree in Automatic Control from Chongqing University, China in 2007.
He joined the college of the Information Science & Technology, Hainan University, in 2001, where he is currently a Professor. From 2005 to 2006, he was a Visiting Scholar with the Artificial Intelligence Laboratory, University of Zurich, Zurich, Switzerland. From December 2010 to March 2011 he was a Visiting Scholar with the Intelligent Image Processing Lab, College of Information Science and Engineering, Ritsumeikan University, Japan. He has published over 20 technical papers and holds four national invention patents. His published book titled Digital Watermarking Algorithms Robust to Geometrical Attacks (Beijing: Intellectual Property Publishing House, 2007). His research interests include artificial neural network, image processing, and information hiding.