Abstract—Monitoring and preserving air quality has become one of the most essential activities in many industrial and urban areas today. The quality of air is adversely affected due to various forms of pollution caused by transportation, electricity, fuel uses etc. The deposition of harmful gases is creating a serious threat for the quality of life in smart cities. With increasing air pollution, we need to implement efficient air quality monitoring models which collect information about the concentration of air pollutants and provide assessment of air pollution in each area. Hence, air quality evaluation and prediction has become an important research area. The quality of air is affected by multi-dimensional factors including location, time, and uncertain variables. Recently, many researchers began to use the big data analytics approach due to advancements in big data applications and availability of environmental sensing networks and sensor data. The aim of this research paper is to investigate various big-data and machine learning based techniques for air quality forecasting. This paper reviews the published research results relating to air quality evaluation using methods of artificial intelligence, decision trees, deep learning etc. Furthermore, it throws light on some of the challenges and future research needs.
Index Terms—Air quality evaluation, big data analytics, data-driven air quality evaluation, and air quality prediction.
I. INTRODUCTION
Air is one of the most essential natural resources for the existence and survival of the entire life on this planet. All forms of life including plants and animals depend on air for their basic survival. Thus, all living organisms need good quality of air which is free of harmful gases to continue their life. According to the world's worst polluted places by Blacksmith Institute in 2008 [1], two of the worst pollution problems in the world are urban air quality and indoor air pollution. The increasing population, its automobiles and industries are polluting all the air at an alarming rate. Air pollution can cause long-term and short-term health effects. It's found that the elderly and young children are more affected by air pollution. Short-term health effects include eye, nose, and throat irritation, headaches, allergic reactions, and upper respiratory infections. Some long-term health effects are lung cancer, brain damage, liver damage, kidney
Manuscript received August 30, 2017; revised December 12, 2017. Gaganjot Kaur Kang is with the Department of Computer Engineering, San Jose State University, USA (e-mail: [email protected]).
Jerry Zeyu Gao is with San Jose State University, USA (e-mail: [email protected]).
Sen Chiao is with University of Taiyuan University of Technology, China.
Shengqiang Lu is with the Taiyuan University of Technology, China. Gang Xie is with the Taiyuan University of Science and Technology, China.
damage, heart disease, and respiratory disease. It also contributes to the depletion of the ozone layer, which protects the Earth from sun's UV rays. Another negative effect of air pollution is the formation of acid rain, which harms trees, soils, rivers, and wildlife. Some of the other environmental effects of air pollution are haze, eutrophication, and global climate change. Hence, air pollution is one of the most alarming concerns for us today. Addressing this concern, in the past decades, many researchers have spent lots of time on studying and developing different models and methods in air quality analysis and evaluation.
Air quality evaluation has been conducted using conventional approaches in all these years. These approaches involve manual collection and assessment of raw data. According to Niharika et al., [2], the traditional approaches for air quality prediction use mathematical and statistical techniques. In these techniques, initially a physical model is designed and data is coded with mathematical equations. But such methods suffer from disadvantages like:
1) they provide limited accuracy as they are unable to predict the extreme points i.e. the pollution maximum and minimum
2) cut-offs cannot be determined using such approach 3) They use inefficient approach for better output prediction 4) the existence of complex mathematical calculations 5) equal treatment to the old data and new data
But with the advancement in technology and research, alternatives to traditional methods have been proposed which use big-data and machine learning approaches. In recent times, many researchers have developed or used big data analytics models and machine learning based models to conduct air quality evaluation to achieve better accuracy in evaluation and perdition. This paper is written based on our recent literature survey and study on the existing publications which focused on air quality evaluation and prediction using these approaches. The major objective is to provide a snapshot of the vast research work and useful review on the current state-of-the-art on applicable big data approaches and machine learning techniques for air quality evaluation and predication.
As a survey paper on air quality evaluation, it begins with a general introduction to the concerns with air quality, causes and effects of air pollution. In Section II, it presents an understanding on air quality evaluation standards and their need. Section III reviews and compares big data analytics models and research work on air quality evaluation. Section IV covers and compares the machine learning models and research work for air quality evaluation. Section V discusses the future research needs and directions in big data and machine learning based air quality evaluation and prediction, and conclusion remarks.
Air Quality Prediction: Big Data and Machine Learning
Approaches
II. AIR QUALITY EVALUTION
Air quality evaluation is an important way to monitor and control air pollution. The characteristics of air supply affect its suitability for a specific use. A few air pollutants, called criteria air pollutants, are common throughout the United States. These pollutants can injure health, harm the environment and cause property damage. The current criteria pollutants are:
1) Carbon Monoxide (CO) 2) Lead (Pb)
3) Nitrogen Dioxide (NO2) 4) Ozone (O3)
5) Particulate matter (PM) 6) Sulfur Dioxide (SO2).
The Air Quality System (AQS) contains ambient air pollution data collected by EPA, state, local, and tribal air pollution control agencies from over thousands of monitors. AQS also contains meteorological data, descriptive information about each monitoring station (including its geographic location and its operator), and data quality assurance/quality control information. AQS data is used to assess air quality, assist in Attainment/Non-Attainment designations, evaluate State Implementation Plans for Non-Attainment Areas, perform modeling for permit review analysis, and other air quality management functions. AQS information is also used to prepare reports for Congress as mandated by the Clean Air Act
A. Air Quality Shtandards
Office of air quality planning and standards (OAQPS) manages EPA programs to improve air quality in areas where the current quality is unacceptable and to prevent deterioration in areas where the air is relatively free of contamination. To accomplish this task, OAQPS establishes the National Ambient Air Quality Standard (NAAQS) for each of the criteria pollutants. There are two types of standards - primary and secondary.
1) Primary standards: They protect against adverse health
effects;
2) Secondary standards: They protect against welfare
effects, such as damage to farm crops and vegetation and damage to buildings.
Because different pollutants have different effects, the NAAQS standards are also different. Some pollutants have standards for both long-term and short-term averaging times. The short-term standards are designed to protect against acute or short-term health effects, while the long-term standards were established to protect against chronic health effects. Because different pollutants have different effects, the NAAQS [3] standards are also different and some of them are shown in Table I. Some pollutants have standards for both long-term and short-term averaging times. The short-term standards are designed to protect against acute, or short-term, health effects, while the long-term standards were established to protect against chronic health effects.
According to the researchers E. Kalapanidas and N. Avouris [4], modeling of atmospheric pollution phenomena till now has been based mainly on dispersion models that provide approximation of the complex physicochemical processes involved. While the sophistication and complexity
of these models have increased over the years, use of these techniques in the frame of real-time atmospheric pollution monitoring seems not totally suitable in terms of performance, input data requirements and compliance with the time constraints of the problem. Instead, human experts’ knowledge has been primarily applied in Air Quality Operational Centers for the real-time decisions required, while mathematical models have been used mostly for off-line studies of the phenomena involved. As per them, air pollution phenomena have been measured by using physical reality as the start point. And then, for example, these data traditionally have been coded into differential equations. However, these kinds of techniques have limited accuracy due to their inability to predict extreme events.
TABLEI:NAAQSTABLE LISTS ALL CRITERIA POLLUTANTS AND STANDARDS [3]
Pollutant Primary/ Secondary
Averaging Time
Level Form
Carbon Monoxide
(CO)
Primary 8 hours 9 ppm Not to be
exceeded more than once per
year 1 hour 35 ppm
Lead (Pb) Primary and secondary
Rolling 3 month average
0.15 g/m3
Not to be exceeded
Nitrogen Dioxide (NO2)
Primary 1 hour 100ppb 98th percentile of
1-hour daily maximum concentrations, averaged over 3
years 1 year 53 ppb Annual Mean Ozone
(O3)
Primary and secondary
8 hours 0.07 ppm
Annual fourth-highest daily maximum
8-hour concentration, averaged over 3
years
TABLEII:AQICLASSIFICATION [3]
AQI Air Pollution Level
0-50 Excellent
51-100 Good
101-150 Lightly Polluted
151-200 Moderately Polluted
201-300 Heavily Polluted
300+ Severely Polluted
We have one important parameter called air quality index (AQI) which quantifies air quality in a region as shown in Table II. It is a number used by government agencies to communicate to the public how polluted the air is currently or how polluted it is forecasted to become. As the AQI increases, an increasingly large percentage of the population is likely to be exposed, and people might experience increasingly severe health effects. Different countries have their own air quality indices, corresponding to different national air quality standards.
III. BIG-DATA AIR QUALITY ANALYSIS
from variety of sources like sensors, satellites, public agencies etc. Advances in satellite sensors have provided new datasets for monitoring air quality at urban and regional scales. As per an article published by the Chicago policy Review [5], in contrast to traditional datasets that rely on samples or are aggregated to a coarse scale, “big data” is huge in volume, high in velocity, and diverse in variety. Since the early 2000s, there has been explosive growth in data volume due to the rapid development and implementation of technology infrastructure, including networks, information management, and data storage. Big data can be generated from directed, automated, and volunteered sources. Sometimes there are mismatches between data needs and availability, such as discrepancies between the available and the desired levels of resolution. Key to making big data actionable is harnessing, standardizing, and integrating the enormous amount of data. For instance, a modeling study carried out by D. J. Nowak et al. [6] using hourly meteorological and pollution concentration data from across the United States demonstrates that urban trees remove large amounts of air pollution that consequently improve urban air quality. Pollution removal (O3, PM10, NO2, SO2, CO) varied among cities with total annual air pollution removal by US urban trees estimated at 711,000 metric tons ($3.8 billion value). We are discussing some important researches carried out by researches across the world using data driven approach to predict air quality in the following paragraphs.
Fig. 1. Big data based decision support for air quality [7].
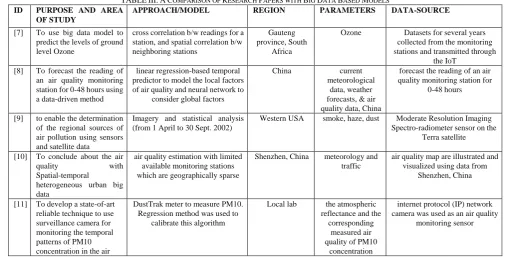
In one of the papers by J. Ditsela and T. Chiwewe in [7], they used big data model to predict the levels of ground level Ozone at locations based on the cross-correlation and spatial-correlation of different air pollutants whose readings are obtained from several different air quality monitoring stations in Gauteng province, South Africa, including the City of Johannesburg. Datasets spanning several years collected from the monitoring stations and transmitted through the Internet-of-Things were used. Big data analytics and cognitive computing is used to get insights on the data and create models that can estimate levels of Ozone without requiring massive computational power or intense numerical analysis. Two approaches to parameter estimation were considered, the cross correlation between readings for a station, and the spatial correlation between neighboring stations. The different approaches would provide a model portfolio that could be fed into conceptual framework for decision support as shown in Fig. 1.
In one of the researches carried out by Y. Zheng et al. [8],
they forecast the reading of an air quality monitoring station over the next 48 hours using a data-driven method. This method considers current meteorological data, weather forecasts, and air quality data of the station and that of other stations within a few hundred kilometers in China. The predictive model is comprised of four major components: 1) linear regression-based temporal predictor to model the
local factors of air quality,
2) a neural network-based spatial predictor to model global factors,
3) a dynamic aggregator combining the predictions of the spatial and temporal predictors as per meteorological data, and
4) an inflection predictor to capture sudden changes in air quality.
Fig. 2. Data map [8].
They evaluate the model with data from 43 cities in China, surpassing the results of multiple baseline methods. They have deployed a system with the Chinese Ministry of Environmental Protection, providing 48-hour fine-grained air quality forecasts for four major Chinese cities every hour. The forecast function is also enabled on Microsoft Bing Map and MS cloud platform Azure as shown in Fig. 2. The prime advantage of this method is that their technology is general and can be applied globally for other cities.
J. A. Engel-Cox et al. in [9] compared qualitative true color images and quantitative aerosol optical depth data from the Moderate Resolution Imaging Spectro-radiometer (MODIS) sensor on the Terra satellite with ground-based particulate matter data from US Environmental Protection Agency (EPA) monitoring networks. They covered the period from 1 April to 30 September 2002. Following were some of the interesting facts about this approach:
1) Using both imagery and statistical analysis, satellite data enabled the determination of the regional sources of air pollution events, the general type of pollutant (smoke, haze, dust), the intensity of the events, and their motion. 2) Very high and very low aerosol optical depths were found to be eliminated by the algorithm used to calculate the MODIS aerosol optical depth data.
3) Correlations of MODIS aerosol optical depth with ground-based particulate matter were better in the eastern and Midwest portion of the United States (east of 100°W).
analysis would be required to verify the effect of the model on correlations.
TABLEIII:ACOMPARISON OF RESEARCH PAPERS WITH BIG DATA BASED MODELS
ID PURPOSE AND AREA
OF STUDY
APPROACH/MODEL REGION PARAMETERS DATA-SOURCE
[7] To use big data model to predict the levels of ground level Ozone
cross correlation b/w readings for a station, and spatial correlation b/w neighboring stations
Gauteng province, South
Africa
Ozone Datasets for several years collected from the monitoring stations and transmitted through
the IoT [8] To forecast the reading of
an air quality monitoring station for 0-48 hours using a data-driven method
linear regression-based temporal predictor to model the local factors of air quality and neural network to
consider global factors
China current
meteorological data, weather forecasts, & air quality data, China
forecast the reading of an air quality monitoring station for
0-48 hours
[9] to enable the determination of the regional sources of air pollution using sensors and satellite data
Imagery and statistical analysis (from 1 April to 30 Sept. 2002)
Western USA smoke, haze, dust Moderate Resolution Imaging Spectro-radiometer sensor on the
Terra satellite
[10] To conclude about the air
quality with
Spatial-temporal
heterogeneous urban big data
air quality estimation with limited available monitoring stations which are geographically sparse
Shenzhen, China meteorology and traffic
air quality map are illustrated and visualized using data from
Shenzhen, China
[11] To develop a state-of-art reliable technique to use surveillance camera for monitoring the temporal patterns of PM10 concentration in the air
DustTrak meter to measure PM10. Regression method was used to
calibrate this algorithm
Local lab the atmospheric reflectance and the
corresponding measured air quality of PM10
concentration
internet protocol (IP) network camera was used as an air quality
monitoring sensor
In one of the researches carried out by J. Zhu et al. [10], they consider city-wide air quality estimation with limited available monitoring stations which are geographically sparse. The causality model observation and the city-wide air quality map are illustrated and visualized using data from Shenzhen, China. Air pollution is highly spatial-temporal (S-T) dependent and considerably influenced by urban dynamics (e.g., meteorology and traffic) as shown in Fig. 3. This paper concludes about the air quality which is not covered by monitoring stations with S-T heterogeneous urban big data. However, estimating air quality using S-T heterogeneous big data poses two challenges.
1) The first challenge is due to the data diversity, i.e., there are different categories of urban dynamics and some may be useless and even detrimental for the estimation. To overcome this, they first propose an S-T Extended Granger causality model to analyze all the causalities among urban dynamics in a consistent manner. Then by implementing non-causality test, they rule out the urban dynamics that do not cause air pollution.
2) The second challenge is due to the time complexity when processing the massive volume of data. this research proposes to discover the region of influence (ROI) by selecting data with the highest causality levels spatially and temporally.
Fig. 3. The influence of S-T urban dynamic on air quality [10].
Results show that the research achieved higher accuracy
using “part” of the data than “all” of the data. This may be explained by the most influential data eliminating errors induced by redundant or noisy data.
Fig. 4. The schematic set-up of IP camera as remote sensor to monitor air quality [11].
In one of the studies carried out by C.J. Wong et al. [11], the aim is to develop a state-of-art reliable technique to use surveillance camera for monitoring the temporal patterns of PM10 concentration in the air. Once the air quality reaches the alert thresholds, it provides warning alarm to alert people to prevent from long exposure to these fine particles. This is important for people to avoid adverse health effects like asthma, heart problems etc. In this study, an internet protocol (IP) network camera was used as an air quality monitoring sensor. It is a 0.3 mega pixel charge-couple-device (CCD) camera integrates with the associate electronics for digitization and compression of images. The approach is as below:
1) The network camera was installed on the rooftop of the school of physics. The camera observed a nearby hill, which was used as a reference target.
standard computer networks (Ethernet networks), internet, or even wireless technology.
3) Then images were stored in a server, which could be accessed locally or remotely for computing the air quality information with a newly developed algorithm. The results were compared with the alert thresholds. If the air quality reaches the alert threshold, alarm will be triggered to inform us this situation.
The newly developed algorithm was based on the relationship between the atmospheric reflectance and the corresponding measured air quality of PM10 concentration as shown in Fig. 4. In situ PM10 air quality values were measured with DustTrak meter and the sun radiation was measured simultaneously with a Spectro-radiometer. Regression method was used to calibrate this algorithm. Still images captured by this camera were separated into three bands namely red, green and blue (RGB), and then digital numbers (DN) were determined. The results of this study showed that the proposed algorithm produced a high correlation coefficient (R2) of 0.7567 and low root-mean-square error (RMS) of plusmn 5 mu g/m3 between the measured and estimated PM10 concentration.
We present comparison of the approach, model etc. in all the papers discussed so far in Table III.
IV. MACHINE-LEARNING PREDICTION MODELS Machine learning (ML) is the branch of computer science which makes computers capable of performing a task without being explicitly programmed. There are many research papers that focus on classification of air quality evaluation using machine learning algorithms. Most of these articles use different scientific methods, approaches and ML models to predict air quality. S. Y. Muhammed et al. in [12] points out that machine learning algorithms are best suited for air quality prediction. Some of them are discussed below.
A. Artificial Neural Network Model (ANN)
Artificial neural Network model tries to simulate the structures and networks within human brain. The architecture of neural networks consists of nodes which generate a signal or remain silent as per a sigmoid activation function in most cases. A. Sarkar et al. in [13] points out that the ANNs are trained with a training set of inputs and known output data. For training, the edge weights are manipulated to reduce the training error. E. Kalapanidas et al. in [14] use a feed forward multi-perceptron network consisting of 10 input nodes, 2 hidden layers of 6 and 4 nodes respectively, and 1 output node as shown in Fig. 5.
1) The step functions at the nodes of the hidden layers are all Gaussian. The training process is the error back propagation, where there has been 5-6 working hours until the network performed well against the training set. 2) Many less successful trials have been made, trying
networks with different architectures.
3) The architecture of the ANN used for experimentation along with the previous techniques, an inductive top down decision tree was used, in particular the Oblique Classifier (OC1) which has been reported to have an improved performance over the standard decision tree
algorithms like ID3, C4.5 and their inherits.
4) The whole idea of OC1 is that the tree might split at each node according to the algebraic sum of several attributes, not just one as is the case with the standard C4.5 programs.
Fig. 5. ANN model for air quality [14].
B. Genetic Algorithm — ANN Model
H. Zhao et al. in [15] used an improved ANN model called GA-ANN in which GA (genetic algorithm) is used to select a subset of factors from the original set and the GA-selected factors are fed into ANN for modeling and testing as shown in Fig. 6. In the experiments, air quality monitoring data and meteorological data (9 candidate factors) of Tianjin, China from 2003 to 2006 are utilized for modeling, and the data in 2007 is utilized for performance evaluation. Three models, including GA-ANN, normal ANN and PCA-ANN, are compared. The correlation coefficients of GA-ANN, which are calculated between monitoring and predicting values are both higher than the other two models for S02 (sulfur dioxide) and N02 (nitrogen dioxide) predicting. The results indicate that GA-ANN model performs better than another two models on air quality predicting.
Fig. 6. Flow of genetic algorithm based ANN [15].
C. Random Forest Model
urban sensing systems. The data generated by urban sensing includes meteorology data road information, real-time traffic status and point of interest (POI) distribution. The random forest algorithm is exploited for data training and prediction. Compared with three other algorithms, this approach achieves better prediction precision. They used the standard of China, where the AQI is based on the levels of six atmospheric gases, namely sulfur dioxide (SO2), nitrogen dioxide (NO2), suspended particulates smaller than 10 µm in aerodynamic diameter (PM10), suspended particulates smaller than 2.5 µm in aerodynamic diameter (PM2.5), carbon monoxide (CO), and ozone(O3), measured at the monitoring stations throughout each city. The AQI value is calculated per hour according to a formula published by China’s Ministry of Environmental Protection. The approach is explained below:
1) In the RAQ algorithm, all data are collected from the urban sensing system including air monitoring station data, meteorology data, traffic data, road information and POI data and necessary features are extracted from heterogene. In the experiments, one-month data from 4 May 2015 to 5 June 2015 is collected.
2) In their testing period, they used a total of 2701 data to test this algorithm and Shenyang is divided into 1258 grids corresponding to 34 rows and 37 columns. In Shenyang, this algorithm finally results in an overall precision of 81% for AQI prediction. This experimental result outperforms that of Naïve Bayes, Logistic Regression, single decision tree and ANN. These data are directly or indirectly available on the Internet. This shows that the algorithm could be easily applied for other cities.
Fig. 7. Random Forest Simplified [16].
D. DecisionTreeModel
Decision tree model is a tree model in which each branch node represents a choice between several alternatives, and each leaf node represents a decision as per [18] as shown in Fig. 8. It is a supervised learning technique which uses a predictive model to map observations about an item (represented in the branches) to conclusions about the item's target value (represented in the leaves). In [19] S. Deleawe et al., create mapping from features to classification with a decision tree model which uses entropy to select an ordering of feature values to consider in the concept rule description to predict CO2 levels in air. Since a decision tree generates decision rules as its model, the researchers have used it to understand the attributes that were most influential in predicting the air quality class. The decision tree they employed has a confidence factor of 0.25. They used the
Weka implementation of the learning algorithms.
Fig. 8. Decision tree algorithm [18].
E. Least Squares Support Vector Machine Model
W. F. Ip et al., in [20] use Least Squares Support Vector Machines (LS-SVM) as shown in Fig. 9. It is a novel type of machine learning technique based on statistical learning theory used for regression and time series prediction which overcomes most of the drawbacks of MLP and has been reported to show promising results. In this paper, researchers report a forecasting model based on LS-SVM for the meteorological and pollution data that shows promising results.
Fig. 9. AP-LSSVM modeling for air quality prediction using LS-SVM [20].
Fig. 10. AP-LSSVM modeling for air quality prediction [21].
F. Deep Belief Network
the proposed method of performing air quality predictions has a superior performance.
TABLEIV:ACOMPARISON TABLE OF RESEARCH PAPERS WITH MACHINE LEARNING BASED MODELS TO PREDICT WATER QUALITY
ID PURPOSE AND AREA OF STUDY ML MODEL REGION PARAMETERS DATA-SOURCE
[14]
applicability of machine learning algorithms in operational conditions of air quality monitoring for predicting the daily peak concentration of a major
photochemical pollutant - NO2-
Artificial neural network (ANN)
Athens, Greece
NO2
Air Quality Operational Centres
of Athens, Greece
[16]
GA-ANN, is proposed, in which GA (genetic algorithm) is used to select a subset of factors from the original set to predict air quality
Genetic Algorithm- ANN Model
Tianjin, China
SO2, NO2
air quality monitoring data and meteorological data from 2003 to 2006
[17]
a random forest approach for predicting air quality (RAQ) is proposed for urban sensing systems.
Random forest model
Shenyang city, China
concentration of PM2.5
meteorology data, road information, real-time traffic status and point of interest (POI) distribution
[19]
use of machine learning technologies to predict CO2 levels as an indicator of air
quality in smart environments.
Decision tree model
WSU Tokyo smart workplace testbed, WSU Kyoto smart apartment testbed
CO2
sensor data in several physical smart environment testbeds
[20]
meteorological and pollutions data are collected daily at monitoring stations. This pollutant-related information can be used to build an early warning system, which provides forecast and alarms health advice to local inhabitants
Least squares Support Vector Machine Model
Macau Peninsula, China
Relationship between the temperature and NO2, Pearson correlation coefficients between the various climatic and pollutant parameters
Data in the period between 2003 and 2006 from monitoring stations
[21]
a novel spatiotemporal deep learning (STDL)-based air quality prediction method that inherently considers spatial and temporal correlations is proposed
Deep belief
network Beijing, China
The hourly PM2.5 concentration data
2014/1/1 to 2016/5/28 at 12 air quality monitoring stations
TABLEV:COMPARISON OF FEATURES OF VARIOUS MLBASED MODELS
MODEL /ALGORITHM
ARTIFICIAL NEURAL NETWORK
GENETIC ALGORITHM – ANN
MODEL
DEEP BELIEF NETWORK
DECISION TREE
RANDOM FOREST MODEL
SUPPORT VECTOR MACHINE
Big-data based Y Y Y N N N
Air quality factors NO2 SO2
NO2
PM2.5 CO2 PM2.5 NO2
Structured data-sets Y Y Y N Y Y
Training data 60% 82% 76% 55% 70% 60%
Real-Time Prediction
Y N Y N N N
Simplicity Y Y N Y N Y
Accuracy 55% MAPE value: 18.60% Err: 1.6% 89.46% AQI: 81% RMSE: 15.07%
Regression based Y Y Y Y N N
Sensors used Y Y Y N N N
Robustness Y Y Y N N Y
Flexibility Y N Y N N N
We present a comparison table in Table IV which dives a tabular comparison of the research papers studied in this section. It talks about the purpose of study, model proposed, parameters considered and data-source referred. Finally, we present a Table V which gives a comparison of various pros and cons of all these model.
V. ISSUES,CHALLENGES, AND NEEDS
Since last year, we have begun to conduct air quality evaluation for San Francisco Bay using selected big data analysis approaches and machine learning models. Based on
literature and experience, we highlight some research issues, challenges, and future needs.
Issues #1: Data quality and validation issue - There are
lots of sensor data quality issues which affect the accuracy of air quality evaluation and assessments due to device faults, battery issues, and sensor network communication problems. This brings the first need below.
Need #1: Research demand in big data quality assurance –
As pointed out in [22] by Jerry Gao et al., there is a strong need in big data quality assurance research in data quality modeling, automatic real-time validation methods, and tools to increase the accuracy of air quality evaluation.
air resources - As the advance of smart sensing and IoT, more and more environmental sensors (including air sensors and networks) have been installed and deployed for many air resources. However, there is a lack of integrated real-time big data based air quality evaluation and monitor environments for smart cities to support dynamic air quality evaluation, monitor, and supervision management. Air in a city could be considered as a multi-level air system which is impacted by multiple factors like pollutant emission levels, location, time, wind speed etc. The air quality on all levels usually affect each other.
Need #2: Research and development of real-time air quality monitor and evaluation systems supporting air quality evaluation and analysis on multiple levels. This demand is caused by the lack of the existing research work addressing the air quality impacts on different levels due to air pollution from a special air source. This suggest the demand on an integrated real-time air quality monitor and evaluation system based on sensor networks and IoT infrastructures at the different levels.
Issue #3: Big data modeling issues for dynamic air quality monitor and analysis at the different levels for smart cities -
Most published research work applied big data analytics approaches and used one specific machine learning technique for air resource at specific level in a limited location (or a region) during an interested time. The air system for a future smart city must support real-time air quality monitor, evaluation, and prediction.
Need #3: This implies that we need to develop integrated and dynamic air quality models using hybrid machine learning models to address these factors: a) the nature of dynamic wind flow, b) both single-input time series and multiple input time series, c) dynamic quality impacts on different atmospheric levels.
VI. CONCLUSIONS
With the advancement of IoT infrastructures, big data technologies, and machine learning techniques, real-time air quality monitor and evaluation is desirable for future smart cities. This paper reports our recent literature study, reviews and compares current research work on air quality evaluation based on big data analytics, machine learning models and techniques. Finally, it highlights some observations on future research issues, challenges, and needs.
ACKNOWLEDGEMENT
This paper is supported by Futurewei’s support that is extended to the Center of Smart Technology, Computing, and Complex Systems at San Jose State University (Reference link: http://smartcenter.sjsu.edu/index.html). We would like to sincerely thank Futurewei for the continuous support and guidance that led to the successful completion of our research and survey on existing techniques for analysis of air quality.
REFERENCES
[1] 'Blacksmith Institute Press Release'. (October 21, 2008). [Online]. Available:
http://www.blacksmithinstitute.org/the-2008-top-ten-list-of-world-s-w orst-pollution-problems.html
[2] V. M. Niharika and P. S. Rao, “A survey on air quality forecasting techniques,” International Journal of Computer Science and Information Technologies, vol. 5, no. 1, pp.103-107, 2014.
[3] NAAQS Table. (2015). [Online]. Available:
https://www.epa.gov/criteria-air-pollutants/naaqs-table
[4] E. Kalapanidas and N. Avouris, “Applying machine learning techniques in air quality prediction,” in Proc. ACAI, vol. 99, September 1999.
[5] Questioning smart urbanism: Is data-driven governance a panacea? (November 2, 2015). [Online]. Available: http://chicagopolicyreview.org/2015/11/02/questioning-smart-urbanis m-is-data-driven-governance-a-panacea/
[6] D. J. Nowak, D. E. Crane, and J. C. Stevens, “Air pollution removal by urban trees and shrubs in the United States,” Urban Forestry & Urban Greening, vol. 4, no. 3, pp. 115-123, 2006.
[7] T. Chiwewe and J. Ditsela, “Machine learning based estimation of Ozone using spatio-temporal data from air quality monitoring stations,” presented at 2016 IEEE 14th International Conference on Industrial Informatics (INDIN), IEEE, 2016.
[8] Y. Zheng, X. Yi, M. Li, R. Li, Z. Shan, E. Chang, and T. Li, “Forecasting fine-grained air quality based on big data,” in Proc. the 21th ACM SIGKDD International Conference on Knowledge Discovery and Data Mining, pp. 2267-2276, August 10, 2015. [9] J. A. Engel-Coxa, C. H. Hollomanb, B. W. Coutantb, and R. M. Hoffc,
“Qualitative and quantitative evaluation of MODIS satellite sensor data for regional and urban scale air quality,” Atmospheric Environment, vol. 38, issue 16, pp. 2495–2509, May 2004.
[10] J. Y. Zhu, C. Sun, and V. Li, “Granger-Causality-based air quality estimation with spatio-temporal (ST) heterogeneous big data,” presented at 2015 IEEE Conference on Computer Communications Workshops (INFOCOM WKSHPS), IEEE, 2015.
[11] C. J. Wong, M. Z. MatJafri, K. Abdullah, H.S. Lim, and K. L. Low, “Temporal air quality monitoring using surveillance camera,” presented at IEEE International Geoscience and Remote Sensing Symposium, IEEE, 2007.
[12] S. Y. Muhammad, M. Makhtar, A. Rozaimee, A. Abdul, and A. A. Jamal, “Classification model for air quality using machine learning techniques,” International Journal of Software Engineering and Its Applications, pp. 45-52, 2015.
[13] A. Sarkar and P. Pandey, “River water quality modelling using artificial neural network technique,” Aquatic Procedia, vol. 4, pp. 1070-1077, 2015.
[14] E. Kalapanidas and N. Avouris, “Applying machine learning techniques in air quality prediction,” Sept. 1999.
[15] H. Zhao, J. Zhang, K. Wang, et al., “A GA-ANN model for air quality predicting,” IEEE, Taiwan, 10 Jan. 2011.
[16] V. Jagannath. [Online]. Available:
https://community.tibco.com/wiki/random-forest-template-tibco-spotfi rer-wiki-page
[17] R. Yu, Y. Yang, L. Yang, G. Han, and, O. A. Move, “RAQ–A random forest approach for predicting air quality in urban sensing systems,” Sensors, vol. 16, no. 1, p. 86, 2016.
[18] Machine learning with decision trees. [Online]. Available:
https://blog.knoldus.com/2017/08/14/machine-learning-with-decision-trees/
[19] S. Deleawe, J. Kusznir, B. Lamb, and D. J. Cook, “Predicting air quality in smart environments,” J Ambient Intell Smart Environ., pp. 145-152, 2010.
[20] W. F. Ip, C. M. Vong, J. Y. Yang, and P. K. Wong, “Least squares support vector prediction for daily atmospheric pollutant level,” in Proc. 2010 IEEE/ACIS 9th International Conference on Computer and Information Science (ICIS), pp. 23-28, IEEE., August 2010. [21] L. Xiang, L. Peng, Y. Hu, J. Shao, and T. Chi, “Deep learning
architecture for air quality predictions,” Environmental Science and Pollution Research, vol. 23, no. 22, pp. 22408-22417, 2016. [22] J. Gao, C.-L. Xie, and C.-Q. Tao, “Big data validation and quality
assurance - issues, challenges, and needs,” IEEE Symposium on Service-Oriented System and Engineering, IEEE Computer Society, Oxford, UK, April, 2016.
Jerry Z. Gao is a full-time professor of Computer Engineering Department at San Jose State University. He holds the Ph.D. and MS degree in computer science engineering from University of Texas at Arlington, Texas USA (1992-1995).
He is currently teaching various courses in the Software Engineering
Departmentof San Jose State University, California USA.
![TABLE AQI II: AQI CLASSIFICATION [3] Air Pollution Level](https://thumb-us.123doks.com/thumbv2/123dok_us/1373023.1647369/2.595.302.552.247.572/table-aqi-ii-aqi-classification-air-pollution-level.webp)
![Fig. 1. Big data based decision support for air quality [7].](https://thumb-us.123doks.com/thumbv2/123dok_us/1373023.1647369/3.595.306.542.161.381/fig-big-data-based-decision-support-air-quality.webp)
![Fig. 5. ANN model for air quality [14].](https://thumb-us.123doks.com/thumbv2/123dok_us/1373023.1647369/5.595.322.532.515.683/fig-ann-model-air-quality.webp)
![Fig. 9. AP-LSSVM modeling for air quality prediction using LS-SVM [20].](https://thumb-us.123doks.com/thumbv2/123dok_us/1373023.1647369/6.595.342.511.355.457/fig-ap-lssvm-modeling-quality-prediction-using-svm.webp)
