MODELING AND PERFORMANCE ANALYSIS OF RENEWABLE ENERGY SYSTEM BASED
ON SOLID OXIDE FUEL CELL (SOFC)
Surendra Kumar Tripathi
Department of Electrical and Electronics Engineering, KIET Group of Institutions,
A R T I C L E I N F O
INTRODUCTION
A Cell that continuously transforms chemical energy into electric energy (also some heat) till fuel and oxidant are provided is called fuel cell. It is an electrochemical device. In the paper, the simulation model is presented which consists Solid Oxide Fuel Cell (SOFC) as a means of renewable resource of energy generation in place of the non
energy resource. The byproduct of SOFC is water, which is clean and does not result in the emission of greenhouse gases like carbon dioxide, methane, etc. These gases results
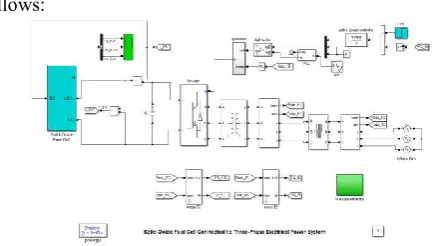
layer depletion and the rising water levels in oceans and seas across the globe. The Output Voltage of SOFC is given by Nernst’s Equation. The Block Diagram of the modeling system can be explained as follows. The Output Voltage is given to the Dc-Dc boost converter, followed by Three Phase Voltage Source Inverter. The Output of the Inverter contains harmonic components which are suppressed by using the Filter as shown in figure 1. The Harmonics free output is the
system which can be fed into the grid which can be utilized for further applications.
The Output of the Inverter is simulated under the technique of Hysteresis Band Current Controller. The Technique can be finally be regarded under the Pulse Width Modulation (PWM). The α-β parameters are transformed into d
transformation is done to control the error current.
International Journal of Current
ISSN: O: 2319-6475, ISSN: P: 2319-6505,
Available Online at www.journalijcar.org
Volume 7; Issue 5(D); May 2018; Page No.
DOI: http://dx.doi.org/10.24327/ijcar.2018
Copyright©2018 Surendra Kumar Tripathi., Narendra Patel and Tushar Jain
Commons Attribution License, which permits unrestricted use, distribution, and reproduction in any medium, provided the origi cited.
*Corresponding author: Surendra Kumar Tripathi
Department of Electrical and Electronics Engineering, KIET Group of Institutions, Ghaziabad, India
Article History:
Received 6th February, 2018
Received in revised form 20th March, 2018 Accepted 8th April, 2018 Published online 28th May, 2018
Key words:
Modeling of Renewable Energy System, Solid Oxide Fuel Cell, Global Warming, Ozone Layer Depletion, Hysteresis Band Current Controller, Decoupling of parameters from α-β in to d-q.
MODELING AND PERFORMANCE ANALYSIS OF RENEWABLE ENERGY SYSTEM BASED
ON SOLID OXIDE FUEL CELL (SOFC)
Surendra Kumar Tripathi., Narendra Patel and Tushar Jain
Department of Electrical and Electronics Engineering, KIET Group of Institutions,
A B S T R A C T
Today due to the depletion of the renewable energy resources, the use of environment f resources are looked forward. Besides this, the non- renewable resources are limited in quantity and cannot provide us the means for energy generation for a longer period of time. So, the paper presents the Modeling of Renewable Energy System that can be used efficiently for meeting the demands in the near future. The Paper also focuses on analyzing the performance of the renewable energy system. The System consists of a Solid Oxide Fuel Cell (SOFC) as a means of electricity generation and since the byproduct of this system is only water, it does not result in the production of gases like carbon dioxide which results in the increase of the earth’s temperature known as global warming which finally results in ozone layer depletion and the rising water levels in oceans and seas across the globe. The System uses the Hysteresis Band Current Controller to limit the error current. The decoupling of frames in d from α-β is also done to control the error current within the permissible range.
A Cell that continuously transforms chemical energy into electric energy (also some heat) till fuel and oxidant are provided is called fuel cell. It is an electrochemical device. In the paper, the simulation model is presented which consists of Solid Oxide Fuel Cell (SOFC) as a means of renewable resource of energy generation in place of the non- renewable energy resource. The byproduct of SOFC is water, which is clean and does not result in the emission of greenhouse gases , methane, etc. These gases results in ozone layer depletion and the rising water levels in oceans and seas across the globe. The Output Voltage of SOFC is given by Nernst’s Equation. The Block Diagram of the modeling system e Output Voltage is given to Dc boost converter, followed by Three Phase Voltage Source Inverter. The Output of the Inverter contains harmonic components which are suppressed by using the Filter as shown final output of the system which can be fed into the grid which can be utilized for
The Output of the Inverter is simulated under the technique of Hysteresis Band Current Controller. The Technique can be finally be regarded under the Pulse Width Modulation (PWM). β parameters are transformed into d-q axis. This
to control the error current.
The decoupling of stationary frames (abc) into the rotating frames (d-q) is done so that the Active Power (P) and Reactive Power (Q) can be independently controlled. It is also done to eliminate the steady state error at
basic considerations in the Grid connected system. Firstly, the THD value of Grid Current. Secondly, the Power Factor of the generated power. The THD value of the Grid Current should be less than 5%. The three phase currents to
the three phase voltages. In order to match the power quality standards, the inverter control and modulation technique is required.
The Three Phase Inverter output can be controlled in Synchronous rotating frame (d
(α-β) and Natural frame (abc). In d
voltages and currents are transformed by Park Transformation into d-q reference frame that rotates synchronously with the grid voltage. The three voltages become DC quantities whi can be controlled using different filtering methods. The PI Controller achieves good control in this reference frame control. Whereas in the α-β frame, the variables become sinusoidal. Therefore, PI Controller cannot regulate the current well which results in the formation of steady state current. In the Natural frame (abc) uses three phase grid voltages and currents individually i.e. each phase is individually controlled. In the d-q frame, d represents the maximum value of grid current whereas q represents the reactive power flow. The decoupling is done in d-q axis because of the three main reasons. Firstly, it provides low harmonic current, secondly it provides better switching pattern. Thirdly, it provides better stability.
International Journal of Current Advanced Research
6505, Impact Factor: 6.614
www.journalijcar.org
; Page No. 12479-12484
//dx.doi.org/10.24327/ijcar.2018.12484.2195
Surendra Kumar Tripathi., Narendra Patel and Tushar Jain. This is an open access article distributed under the Creative Commons Attribution License, which permits unrestricted use, distribution, and reproduction in any medium, provided the origi
Surendra Kumar Tripathi
Department of Electrical and Electronics Engineering, KIET
MODELING AND PERFORMANCE ANALYSIS OF RENEWABLE ENERGY SYSTEM BASED
Tushar Jain
Department of Electrical and Electronics Engineering, KIET Group of Institutions, Ghaziabad, India
Today due to the depletion of the renewable energy resources, the use of environment friendly renewable resources are limited in quantity and cannot provide us the means for energy generation for a longer period of time. So, the paper presents can be used efficiently for meeting the demands in the near future. The Paper also focuses on analyzing the performance of the renewable energy system. The System consists of a Solid Oxide Fuel Cell (SOFC) as a means of electricity generation and since the byproduct of this system is only water, it does not result in the production of gases like carbon dioxide which results in the increase of the earth’s temperature known as global warming which finally results levels in oceans and seas across the globe. The System uses the Hysteresis Band Current Controller to limit the error current. The decoupling of frames in d-q
β is also done to control the error current within the permissible range.
The decoupling of stationary frames (abc) into the rotating q) is done so that the Active Power (P) and Reactive Power (Q) can be independently controlled. It is also done to eliminate the steady state error at a faster rate. There are two basic considerations in the Grid connected system. Firstly, the THD value of Grid Current. Secondly, the Power Factor of the generated power. The THD value of the Grid Current should be less than 5%. The three phase currents to be satisfied with the three phase voltages. In order to match the power quality standards, the inverter control and modulation technique is
The Three Phase Inverter output can be controlled in Synchronous rotating frame (d-q), Stationary reference frame β) and Natural frame (abc). In d-q frame, the three phase voltages and currents are transformed by Park Transformation q reference frame that rotates synchronously with the grid voltage. The three voltages become DC quantities which can be controlled using different filtering methods. The PI Controller achieves good control in this reference frame β frame, the variables become sinusoidal. Therefore, PI Controller cannot regulate the current lts in the formation of steady state current. In the Natural frame (abc) uses three phase grid voltages and currents individually i.e. each phase is individually controlled. q frame, d represents the maximum value of grid nts the reactive power flow. The q axis because of the three main reasons. Firstly, it provides low harmonic current, secondly it provides better switching pattern. Thirdly, it provides better
Research Article
In the model, the fuel cell operating temperature is assumed to be constant. The Pressure between the gas compartments of Anode and Cathode should be below 4 KPa while it should be below 8 KPa under transient conditions. This pressure is maintained constant by controlling the value o
1.145. The value of r can be controlled by controlling the oxygen flow rate. Thus, the Basic Principle of this SOFC is such that the hydrogen and oxygen recombine to produce electricity.
Fig 1 Block diagram of the Fuel cell distributed gene
The Oxidation occurs at the anode and the Reduction occurs at the cathode. The Electrolyte in SOFC is Zirconia and mobile ion is O2-.The Efficiency of SOFC is approximately around 85 90 %. However, the Overall Plant Efficiency is approximate around 50-60% due to the compressor and other auxiliary units in the system. The SOFC can have the temperature variation from 650-1000 degree Celsius. The SOFC can be utilized for various applications namely in Hybrid Vehicles, as a substitute of non-renewable energy resource for power generation.
Proposed Methodology
In the paper, the proposed model of Renewable Energy System is shown. The simulation model is presented which consists of Solid Oxide Fuel Cell (SOFC) as a means of renewable resource of energy generation in place of the non
energy resource. The Performance of Solid Oxide Fuel Cell is also analyzed. The Aim is to examine the Solid Oxide Fuel Cell so that we can harness renewable energy in a more efficient way and can reduce the burden on the non
resources so that we can make our environment sustainable for the future generations.
A fuel cell transforms chemical energy directly to electrical energy through an electrochemical process. As opposite to a conventional storage cell, it can work till the fuel is supplied to it. There are many benefits in developing this method of energy generation and it needs further development to have a realistic system analysis combining various subsystems and components. SOFC systems have been proposed for electric utility power generation in both large central station power plants and distributed generation stations [1][2].
SOFC modeling for these applications has focused on steady state electric power generation. Understanding the
behavior of SOFC’s is important for control of stationary utility generators during power system faults, surges, and switching. More recently, SOFC’s have been proposed as power sources in electric drive systems for transportation applications [9][10]. In transportation applications, transient and partial load operations predominate. In order to continue the development of SOFC’s for transportation applications, the transient operation of SOFC’s in electrical systems must also be understood. Solid oxide fuel cells produce dc electric power operating temperature is assumed to be constant. The Pressure between the gas compartments of Anode and Cathode should be below 4 KPa while it should be below 8 KPa under transient conditions. This pressure is maintained constant by controlling the value of r equal to 1.145. The value of r can be controlled by controlling the oxygen flow rate. Thus, the Basic Principle of this SOFC is such that the hydrogen and oxygen recombine to produce
Block diagram of the Fuel cell distributed generation system
The Oxidation occurs at the anode and the Reduction occurs at the cathode. The Electrolyte in SOFC is Zirconia and mobile .The Efficiency of SOFC is approximately around 85-90 %. However, the Overall Plant Efficiency is approximately
60% due to the compressor and other auxiliary units in the system. The SOFC can have the temperature variation 1000 degree Celsius. The SOFC can be utilized for various applications namely in Hybrid Vehicles, as a substitute
newable energy resource for power generation.
In the paper, the proposed model of Renewable Energy System is shown. The simulation model is presented which consists of Solid Oxide Fuel Cell (SOFC) as a means of renewable energy generation in place of the non- renewable energy resource. The Performance of Solid Oxide Fuel Cell is to examine the Solid Oxide Fuel Cell so that we can harness renewable energy in a more burden on the non-renewable resources so that we can make our environment sustainable for
A fuel cell transforms chemical energy directly to electrical energy through an electrochemical process. As opposite to a e cell, it can work till the fuel is supplied to it. There are many benefits in developing this method of energy generation and it needs further development to have a realistic system analysis combining various subsystems and been proposed for electric utility power generation in both large central station power plants and distributed generation stations [1][2]. Tubular SOFC modeling for these applications has focused on steady state electric power generation. Understanding the transient behavior of SOFC’s is important for control of stationary utility generators during power system faults, surges, and switching. More recently, SOFC’s have been proposed as power sources in electric drive systems for transportation [9][10]. In transportation applications, transient and partial load operations predominate. In order to continue the development of SOFC’s for transportation applications, the systems must also id oxide fuel cells produce dc electric power
from fuel and oxidant via an electrochemical process. The cell dc voltage and current depend on conditions that include fuel flow, oxidant flow, pressure, temperature, and the demands of the load circuit.
Proposed Mathematical Model of SOFC
The Proposed Model of Renewable Energy System is as follows:
Fig 2 The Proposed Model of Renewable Energy System
The following are the assumptions that are made in analyzing the mathematical model of fuel cell stack:
Fuel cell is fed with hydrogen and oxygen. The gases considered are ideal, that is, their chemical and physical properties are not co-related to the pressure. Nernst equation is applicable.
Fuel cell temperature is stable at all times.
The electrode channels are small enough that pressure drop across them is negligible.
The ratio of pressures between the inside and outside of the electrode channels is sufficient to consider choked flow. Ohmic, activation, and concentration losses are considered.
The Block Diagram of the modeling system can be explained as follows. The Output Voltage is given to the Dc
converter, followed by Three Phase Voltage Source Inverter. The Output of the Inverter contains harmonic components which are suppressed by using the Filter as shown in figure 2. The Harmonics free output is the final output of the system which can be fed into the grid which can be utilized for further applications.
Proposed Algorithm
The control block diagram of the system is shown in Fig. 3. The grid voltages are measured, and grid angle is determined with PLL method. The grid angle is used to transform the grid currents and voltages from a
reference frame by Park transformation as given in (1). The error is calculated from the reference and measured d currents, and the errors in d-q frame are given to PI regulators. The Reference d-component of the current de
maximum value of the grid current. The q controls the reactive power flow. It is
active power injection. PI outputs are summed with feed forward grid voltage components and decoupling components to produce reference inverter output voltages. The final outputs from the PI regulators are transformed into α
(2). The inverter reference voltages in the alpha beta (α reference frame and voltage (DC Link
SVPWM and the required switching signals are produced. The performance of Fuel Cell is affected by various operating parameters, as discussed below. On decreasing the current from fuel and oxidant via an electrochemical process. The cell dc voltage and current depend on conditions that include fuel flow, oxidant flow, pressure, temperature, and the demands of
Model of SOFC
The Proposed Model of Renewable Energy System is as
The Proposed Model of Renewable Energy System
The following are the assumptions that are made in analyzing the mathematical model of fuel cell stack:
Fuel cell is fed with hydrogen and oxygen. The gases considered are ideal, that is, their chemical and physical related to the pressure. Nernst equation is
Fuel cell temperature is stable at all times.
channels are small enough that pressure drop
The ratio of pressures between the inside and outside of the electrode channels is sufficient to consider choked flow. Ohmic, activation, and concentration losses are considered.
Block Diagram of the modeling system can be explained as follows. The Output Voltage is given to the Dc-Dc boost converter, followed by Three Phase Voltage Source Inverter. The Output of the Inverter contains harmonic components ing the Filter as shown in figure 2. The Harmonics free output is the final output of the system which can be fed into the grid which can be utilized for further
density, it increases the cell voltage, thereby increasing the efficiency of the fuel cell. One of the most essential operating parameters is the reactant utilization, UF, referring to the fraction of the total fuel (which is the oxidant itself) introduced into a Fuel Cell that reacts electrochemically:
= − = (1)
Where, H2is the hydrogen molar flow.
Therefore Equation 1 represents the fuel utilization factor. High utilizations (especially in smaller systems) are considered desirable as they limit the required fuel and oxidant flow, for the optimum fuel cost and compressor size and as well as for the load. However, utilizations that are pushed too high result in significant voltage drops. The SOFC consists of hundreds of cells which are connected in series as well as in parallel. Fuel and air are passed through these cells. By monitoring the level, the amount of fuel that is fed into the fuel cell stacks is regulated and the output real power of the fuel cell system is both monitored and controlled. The Nernst equation and Ohm’s law determine the magnitude of average voltage of the fuel cell stack [18]. The following equations help to model the voltage of the fuel cell stack:
+
2 ln
.
− (2)
where:
No is the number of cells connected in series
Eo is the voltage associated with the reaction free energy
R is the universal gas constant. T is the temperature
Ifo is the current of the fuel cell stack
F is the Faraday's constant
So, Equation 2 shows the voltage of the Fuel Cell Stack
Hysterisis Band Current Controller Inverter
Hysteresis inverters are utilized in many ways namely in the medium voltage utility applications and also in various small voltage applications whenever the inverter line current is used to track a sinusoidal reference within a specified error margin which is the tolerance band. Line harmonic generation from those inverters depends principally on the particular switching pattern applied to the valves. The pattern of switching is realized with the help of line current feedback in these hysteresis inverters. The Hysteresis Band Current Controller Inverter limits the error current within the permissible tolerance range. This is done under the modulation technique of Pulse Width Modulation (PWM).
Single-phase half-bridge inverter using fixed or variable band hysteresis current control can be utilized. The harmonic output of the fixed-band hysteresis current control is derived by similar derivations of the harmonic output of the variable-band hysteresis controller. The developed models are validated in the paper through performing different simulations studies and comparing results obtained from the models to those computed from MATLAB/Simulink.
Fixed-band hysteresis control
System description
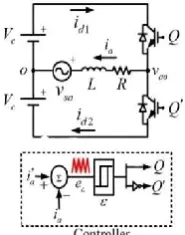
Fig.3 shows a single-phase neutral-point inverter. For simplicity, it has been assumed that the dc voltage supplied by the DG source is divided into two constant and balanced dc sources, as in the figure, each of value Vc. The RL element on the ac side indicates the total line and transformer inductance and losses. The ac source Vac represents the system voltage
seen at the inverter terminals. The inverter line current namely Ia tracks a sinusoidal reference current ∗= √2 ∗(sin +
∅) with the action of the relay band and the specified error current ( ) = ∗− . In Fig.2, the fundamental frequency
voltage at the inverter ac terminals when the line current equals reference current is the reference voltage, ∗= √2 ∗(sin + ∅). Fig.3 compares the reference voltage to the instantaneous inverter voltage resulting from the action of the hysteresis loop. The Difference between the Reference and Actual Voltage is given by Equation 3, which is as follows.
. + ( ) = ∗−
(3)
The harmonic model derived in the previous section describes the exact spectral characteristics of the error current by including the duty cycle (DT) to facilitate the effect of the reference voltage V* on the error current amplitude and tilting.
Single-phase half-bridge inverter with fixed-band hysteresis control as shown in figure 3:
Fig 3 Single-phase half-bridge inverter with fixed-band hysteresis control
When valve Q is turned on, the inverter voltage is = >
∗; as shown in figure 2, this forces the line current i
a to slope
upward until the lower limit of the relay band is reached at
( ) = − . At thismoment, the relay switches on Q’ and the
inverter voltage becomes = − < ∗, forcing the line
current to decay downward until the upper limit of the relay band is reached at ( ) = .
DC Current Harmonics
Fig. 4 Reference voltage calculation and the instantaneous outputs
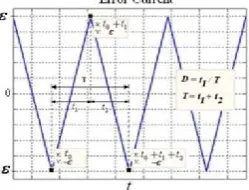
Error current mathematical description
The method described in the section analyses approximately the error current occurred due to the fixed
action, by a frequency-modulated triangular signal whose time varying characteristics are computed from the system and controller parameters. Consequently, the harmonic spectrum of the error current is derived by calculating the Fourier transform of the complex envelope of frequency modulated signal.
The total rise time of the error current is given by Equation 4, which is as follows.
1 = 2
(1 + sin + )
The total fall time of the error current is given by Equation 5, which is as follows.
2 = 2
(1 + sin − )
Therefore, the total time period of the Error Current is given by Equation 6, which is as follows.
( ) =1 = +
8 . cos(2 + 2 )
The Average Switching Frequency is given by Equation 7, which is as follows.
= . 1 −
Where, is the average switching (carrier) frequency . and M is the amplitude modulation index of the inverter expressed in terms of the peak reference voltage and the dc voltage is given by Equation 8, which is as follows.
=√2
∗
The Error Current of Three Phase Inverter Output Voltage of Solid Oxide Fuel Cell System is given as shown in figure 5:
Fig 5 Error Current
Reference voltage calculation and the instantaneous outputs
The method described in the section analyses approximately the error current occurred due to the fixed-band hysteresis modulated triangular signal whose time varying characteristics are computed from the system and controller parameters. Consequently, the harmonic spectrum of the error current is derived by calculating the Fourier mplex envelope of frequency modulated
The total rise time of the error current is given by Equation 4,
(4)
urrent is given by Equation 5,
(5)
Therefore, the total time period of the Error Current is given
) (6)
The Average Switching Frequency is given by Equation 7,
(7)
is the average switching (carrier) frequency . and M is the amplitude modulation index of the inverter expressed in terms of the peak reference voltage and the dc voltage is given
(8)
The Error Current of Three Phase Inverter Output Voltage of Solid Oxide Fuel Cell System is given as shown in figure 5:
In few of the applications, an additional DC/DC converter can be used to boost the DC voltage. In the last stage, an inverter converts the DC energy to AC energy in order to transfer the energy from DC-link to the grid [1
systems, two basic considerations are THD value of grid current and the power factor of the generated power. The THD value of grid current is required to be less than 5% [6]. Three phase currents must be synchronized with related three voltages. In order to satisfy the power
inverter control and modulation technique have an important role.
Three-phase in vectors can be controlled in synchronous rotating frame (d-q), stationary reference frame (α
natural frame (a-b-c). In the
d-phase voltages and currents are transformed by Park transformation in to the d-q reference frame that rotates synchronously with the grid voltage, which helps to minimize the error current by following the instantaneous values. Thus, three-phase variables become DC quantities [7]. As the control variables are DC, different filtering methods can be used, and PI controller achieves good performance in this reference frame control. In the stationary reference frame, three quantities are transformed into alpha beta (α
Clarke transformation. Thus the variables become sinusoidal. PI controller cannot regulate the current well, there for the current develops a steady state error.
PR controller is the most common controller in stationary reference frame. As PR controller is used with α
Park transformation can be avoided [8]. The natural reference frame control uses the three-phase grid voltages and currents. Hence, each phase value can be controlled individually. Hysteresis current control (HCC) and linear current control techniques are widely used in stationary reference frame control [9].
Thus, Decoupling of frames into d minimize the error current.
Simulation Results
A dynamic model of Solid Oxide Fuel Cell based DG system has been developed in MATLAB /SIMULINK environment to supply power to far away places like the rural areas and the remote areas which has the characteristics of an isolated load. Various power electronic interface topologies that convert the power generated by the FCs into a usable form have been discussed. A DC-DC PWM boost converter model is developed, interfaced and studied to fuel cell to boost SOFC voltage to a regulated dc voltage required for D
inverter to serve for an isolated load. A
designed for dc/dc converter that minimizes the steady state error to zero. A control techniqueunder voltage control mode utilizing PI controller has been developed for three phase PWM inverter that interfaces the SOFCs to a three phase isolated load.
Simulink Model of SOFC
The reference power for the fuel cell is considered to be the AC real power injection into the utility grid. The stack voltage as well as the reference power; bo
the reference current which in turn is used to determine the fuel cell stack current. The fuel flow is proportional to the stack current. The partial pressure of hydrogen, oxygen and water are determined using the flow rates of
applications, an additional DC/DC converter can be used to boost the DC voltage. In the last stage, an inverter converts the DC energy to AC energy in order to transfer the link to the grid [1-5]. In grid connected rations are THD value of grid current and the power factor of the generated power. The THD value of grid current is required to be less than 5% [6]. Three-phase currents must be synchronized with related three-Three-phase voltages. In order to satisfy the power quality standards, inverter control and modulation technique have an important
phase in vectors can be controlled in synchronous q), stationary reference frame (α-β) and -q frame control method, three-phase voltages and currents are transformed by Park
q reference frame that rotates synchronously with the grid voltage, which helps to minimize the error current by following the instantaneous values. Thus, iables become DC quantities [7]. As the control filtering methods can be used, and PI controller achieves good performance in this reference frame control. In the stationary reference frame, three-phase into alpha beta (α-β) frame by Clarke transformation. Thus the variables become sinusoidal. PI controller cannot regulate the current well, there for the current develops a steady state error.
PR controller is the most common controller in stationary ference frame. As PR controller is used with α-β quantities, Park transformation can be avoided [8]. The natural reference phase grid voltages and currents. Hence, each phase value can be controlled individually. rent control (HCC) and linear current control techniques are widely used in stationary reference frame
Thus, Decoupling of frames into d-q frames is done to
A dynamic model of Solid Oxide Fuel Cell based DG system has been developed in MATLAB /SIMULINK environment to supply power to far away places like the rural areas and the remote areas which has the characteristics of an isolated load. onic interface topologies that convert the power generated by the FCs into a usable form have been DC PWM boost converter model is developed, interfaced and studied to fuel cell to boost SOFC voltage to a regulated dc voltage required for DC/AC PWM inverter to serve for an isolated load. A PI controller has been designed for dc/dc converter that minimizes the steady state error to zero. A control techniqueunder voltage control mode utilizing PI controller has been developed for three phase WM inverter that interfaces the SOFCs to a three phase
oxygen. The stack voltage is based on the Nernst Equation which depends on the stack current and the partial pressures of the gas. The following are the assumptions that are followed while modeling of the fuel cell: the fuel cell temperature is made to be constant; the fuel cell gasses are ideal and the Nernst’s equation applicable to the cell. The output fuel cell dc voltage Vfc across stack of the fuel cell at current I is given by
the Simulink Models of Fuel Cell System and analyzed by the Nernst’s equation which is given by Equation 2.
Fig 6 SOFC Inner Block
The Output Voltage Wafeform of Solid Oxide Fuel Cell
The Output Voltage of Solid Oxide Fuel Cell is given as shown in figure 6:
Fig. 6 Output Voltage of SOFC
The Output Voltage of SOFC and Inverter Output Voltage isgiven as shown in figure 7:
Fig 7 Output Vdc, Inverter Load output Vab,
The fuel system designed in this work for distributed generated grid connected applications includes the solid oxide fuel cell, boost converter, three phase inverter and the load. The three phase inverter is selected as most of the loads are three phases in general.
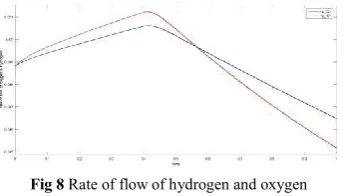
The Rate of flow of hydrogen and oxygen is given as shown in figure 8:
Fig 8 Rate of flow of hydrogen and oxygen
The Three Phase Inverter Output Current of Solid Oxide Fuel Cell System is given as shown in figure 9:
Fig 9 Three phase inverter output current
The three phase inverter output current contains ripples that can be controlled with the help of the different filtering techniques. This is done so that the Total Harmonic Distortion (THD) is below 5%. Besides this, the power factor of the generated output is also considered while using the filter techniques. Then the generated voltage can be fed into the grid from where it can be utilized for further applications.
CONCLUSION
A dynamic model of Solid Oxide Fuel Cell based DG system has been developed in MATLAB /SIMULINK environment to supply power to farther away places like the rural areas and the remote areas which has the characteristics of an isolated load. Various power electronic interface topologies that convert the power generated by the FCs into a usable form have been discussed. A DC-DC PWM boost converter model is developed, interfaced and studied to fuel cell to boost SOFC voltage to a regulated dc voltage required for DC/AC PWM inverter to serve for an isolated load. A PI controller has been designed for dc/dc converter that minimizes the steady state error to zero. A control technique under voltage control mode utilizing PI controller has been developed for three phase PWM inverter that interfaces the SOFCs to a three phase isolated load. Thus the developed model of SOFC based DG system can be used as a tool suitable for studying and for performing accurate analysis of most electrical phenomena that occur when it is interfaced to the isolated load. A numerically efficient approximation for the analysis of the error current harmonic spectrum of single-phase two-level inverters employing fixed band hysteresis current control is derived. The error is calculated from the reference and measured d-q currents, and the errors in d-q frame are given to PI regulators. The reference d-component of the current defines the maximum value of the grid current. The q-component current controls the reactive power flow. It is set to zero for only active power injection. The outputs from PI Controller are summed with feed-forward grid voltage components and decoupling components to generate reference inverter output voltages. The proposed control strategy for this kind of distribution system helps in delivering the maximum power of fuel cell power source and makes the proper operation of each power source under power quality disturbances. Also the proposed control strategy is insensitive to the parameter variation in the distribution system network. The effectiveness of the proposed system has been verified by using the MATLAB/SIMULINK environment.
References
International Power System Conference (PSC2006), 13-15 Nov. 2006, Tehran-Iran.
3. P.R. Khatri, Member, V.S. Jape, N.M. Lokhande, B.S. Motling, “Improving Power Quality by Distributed Generation”, The 7th International Power Engineering Conference (IPEC), DEC. 2005.
4. Custom Power Technology Development, 1999. IEEE P1409 Distribution Custom Power Task Force 2. 5. Kwang Y. Lee, “The Effect of DG Using Fuel Cell
under Deregulated Electricity Energy Markets”, IEEE 2006.
6. Rahman S.: Fuel cell as a distributed generation technology. In Proceedings of IEEE power engineering society summer meeting, 2001. p. 551-2.
7. Z. Miao, M. A. Choudhry, R. L. Klein, and L. Fan, “Study of a fuel cell power plant in power distribution system-Part I: Dynamic model,” in Proc. IEEE PES General Meeting, Denver, CO, Jun. 2004.
8. C. J. Hatziadoniu, A. A. Lobo, F. Pourboghrat, M. Daneshdoost, “A Simplified Dynamic Model of Grid- Connected Fuel-Cell Generators”, IEEE Transaction on Power Delivery, Vol. 17, No. 2, AprilL 2002.
9. KouroshSedghisigarchi, Ali Feliachi,” Dynamic and Transient Analysis of Power Distribution Systems with Fuel Cells-Part II: Control and Stability Enhancement”, IEEE Transactions on Energy Conversion, Vol. 19, No. 2, JUNE 2004.
10. Valery Knyazkin, Lennart S¨oder Claudio Canizares, “Control Challenges of Fuel Cell-Driven Distributed Generation”, Paper accepted for presentation at 2003 IEEE Bologna PowerTech Conference, June 23-26, Bologna, Italy.
11. B. Delfino, F. Fornari, “Modeling and Control of an Integrated Fuel Cell-Wind Turbine System”, Paper accepted for presentation at 2003 IEEE Bologna PowerTech Conference, June 23-26, Bologna, Italy 12. KouroshSedghisigarchi, AliFeliachi, “Impact of Fuel
Cells on Load-Frequency Control in Power Distribution Systems”, IEEE Transactions on Energy Conversion 2006.
13. Rekha T. Jagaduri, GhadirRadman, “Modeling and control of distributed generation systems including PEM fuel cell and gas turbine”, Electric Power Systems
Research 77 (2007) 83-92.
14. A. Hajizadeh, M.A. Golkar, A. Feliachi, “Power Management Strategy of a Hybrid Distributed Generation System”, International Journal of
Distributed Energy Resources, Vol. 3, No. 2, April-June
2007.
15. M.A. Golkar, A. Hajizadeh, “Fuzzy-Based Mitigation of Voltage Sag and Active Power Control in Distribution System Using Fuel Cell Distributed Generation”, International Power System Conference (PSC2006), 13-15 Nov. 2006, Tehran-Iran.
16. Yoon-Ho Kim, Sang-Sun Kim, “An Electrical Modeling and Fuzzy Logic Control of a Fuel Cell Generation System”, IEEE Transactions on Energy Conversion, Vol. 14, No. 2, June 1999.
17. Wand G. Fuel cells history Part 1. Fuel Cell Today
2006:14.
18. Grimes PG. Historical pathways for fuel cells. IEEE Aerosp Electron Syst Mag 2000; 15:1e10.
19. Grove WR. On voltaic series and the combination of gases by platinum. Philosophical Mag J Sci 1839; 14:127.
20. Grove WR. On a small voltaic battery of great energy; some observations on voltaic combinations and forms of arrangement; and on the inactivity of a copper positive electrode in nitro-sulphuric acid. Philos Mag 1839;15: 287e93.
21. Blum L, Peters Ro, David P, Au S, Deja R, Tiedemann W. Integrated stack module development for a 20 kW system. In: Proceedings of the 6th European SOFC Forum; 2004. p. 173e82.
22. Singhal CS, Kendal K, editors. High temperature and solid oxide fuel cells fundamentals, design and applications. New York: Elsevier Inc;; 2006.
23. Stolten D, Emonts B, editors. Fuel cell science and engineering materials, processes, systems and technology. 1st ed., vol. 1. WILEY-VCH; 2011. 24. Kundu A, Jang JH. Encyclopedia of electrochemical
power sources. 2009. p. 39e45.
25. Cottrell CA, Grasman SE, Thomas M, Martin KB, Sheffield JW. Strategies for stationary and portable fuel cell markets. Int J Hydrogen Energy 2011; 36(13):7969e75.
26. Winkler W, Lorenz H. Design studies of mobile applications with SOFCeheat engine modules. J Power
Sources 2002; 106(1e2):338e43.
27. Blum L, Riensche E. FUEL cells e solid oxide fuel cells systems. Encyclopedia of electrochemical power sources. 2009. p. 99e119.
How to cite this article:
Surendra Kumar Tripathi., Narendra Patel and Tushar Jain (2018) 'Modeling And Performance Analysis of Renewable Energy System Based on Solid Oxide Fuel Cell (Sofc)', International Journal of Current Advanced Research, 07(5),
pp. 12479-12484. DOI: http://dx.doi.org/10.24327/ijcar.2018.12484.2195