237
Road Handling Priority In Ogan Komering Ilir
Regency Using AHP, TOPSIS And MOORA
Methods
Deddy Ardiansyah, Joni Arliansyah, Edi kadarsa
Abstract: The limited budget on road handling is a problem that often occurs among cities and regencies in developing countries like Indonesia. The strategy to overcome available limited budgets is by determining road handling priority which is right on the target. Therefore it is required a decision support system as tool for the decision makers in order to decide the evaluation. Decision support systems in this study was using Analytical Hierarchy Process (AHP), Technique for Order Preference by Similarity to Ideal Solution (TOPSIS) method, and Multi Objective Optimization on the Basis of Ratio Analysis (MOORA) method in order to determine priority handling towards 21 regency roads located in Ogan Komering Ilir. The evaluation decision used were costs and financial, road network conditions, road conditions, socio-economy and area development aspects. The scale analysis of priority in AHP was using data processing from questioner results and scale priority analysis was using TOPSIS methods combined with the data taken from questioner results and physical conditions in the field, however on MOORA method as scale priority analysis was only using the data taken from physical condition from the field. Wilconox Signed Rank Test was conducted to analyze significance difference road priority rank results taken from combinations of research method used. Wilcoxon Signed Rank Test showed the results of the priority that there wasn’t any significant difference rank priority of road handling which obtained from all research methods respectively due to the difference of data source used. AHP method is so much depended on the perception of decision takers. So, decision takers will be able to choose method based on the physical data availability in the field or based on their perceptions.
Index Terms: Decision Support Systems, Road Handling, AHP, TOPSIS, MOORA
—————————— ——————————
1.
INTRODUCTION
Road infrastructure is an important component for people and good as moving activities and transportation which aimed to boost economical development potential, social and culture of a region. The interconnected roads in a region will create a road network system. Good road network will create a more effective and efficient transportation system to support the fulfillment of societies’ basic needs, natural resources production, and societies’ movement accessibility so the thrive of economical growth in The Province of South Sumatera, Indonesia will increase. Ogan Komering Ilir (OKI) Regency with its capital city Kayuagung has an area of 19.023,47 km or 21,86 percent of total area in South Sumatera Province [1]. It has geographic condition dominated by water in form of swamps and rivers create accessibilities among regions especially eastern parts is still low in contrast to western parts of the region with high topography has fairly good accessibilities among regions due to good road network availability.Currently the Government of OKI Regency are doing their best efforts to maintain and develop road infrastructures to create accessibilities among regions which functioned good and also maintaining roads condition according to service level standards and the determined plan age road. Due to the abundance of road network it is needed a large sum of money. However, the budget is very limited, so that government must conduct good planning to determine road handling priority and the local government budget can be allocated proportionally for other sectors development.
In order to support decision withdrawal for an evaluation to determine road handling priority become more objective and right on the target, it is required a decision support system. This study about scale priority towards regency road handling refers to some references in form of study conducted by Bhandari (2014) he conducted a study about multi-criteria evaluation to determine sub-district road development project in Nepal, he used AHP method with criteria namely economical aspects, social aspects and environmental aspect [2], then Bhandari (2017) conducted further study about the application of analytical method with the same multi criteria and sub criteria alike his previous study to compare the orders of road project determination results in Nepal by using AHP method through TOPSIS, MOORA and PROMETEE. The results showed that the order of priorities from using TOPSIS, MOORA and PROMETE were the same, however there were slight differences towards orders derived from AHP methods [3].
This study also used the addition of evaluation criteria namely cost and financial aspect, road network condition, road condition, socio-economic aspect and regional development aspects. Analytical methods in this study were AHP, TOPSIS, and MOORA methods. The decision of selecting those methods is caused by the condition where decision is taken only based on perceptions, experiences, and intuition in general to process qualitative data by using AHP method, TOPSIS methods can combine the data from perceptions of the decision makers along with the physical data from the field and it is hoped that the decision taken can be effective and better. Therefore, MOORA methods can be used as decision support system which contains simple calculating and requires only physical data from the field. The objectives of this study are :
As the basis of technical evaluation in order to determine regency on road handling priority located in OKI Regency.
The use of the budget will be optimal for the road handling.
————————————————
Deddy Ardiansyah, Department of Civil Engineering, Faculty of
Engineering, Sriwijaya University, South Sumatera, Palembang, Indonesia.
Joni Arliansyah, Department of Civil Engineering. Faculty of
Engineering, Sriwijaya University, South Sumatera, Palembang, Indonesia. Email Corresponding Author : [email protected]
Edi Kadarsa, Department of Civil Engineering, Faculty of
238 Withdraw an efficient decision results for the road
handling.
2
MATERIAL AND METHOD
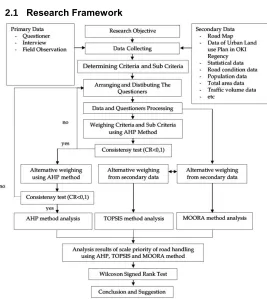
2.1 Research Framework
Figure 1. Research Framework
The flow chart can be seen from Figure 1 and here are some steps conducted from the study :
Conducting preliminary to determine study location on 21 roads in OKI Regency because the roads are located in primary collector read network based on Urban Land use Plan of OKI Regency in 2013-2033, which connected the capital city of the regency and the capital city of the districts.
Formulating the problems and deciding the study objectives.
Primary and Secondary Data were collected, primary data was taken from questioner and interviews with the respondents as much as 30 respondents whose job related to the study directly.
The arrangement of the questioners were based on criteria determination and sub-criteria as parameter in analysis measurement and also agency as respondents later. The agencies for the respondents were from Department of Public Works and Spatial Plan and Regional Development Planning Agency of OKI Regency. The collected data will be tested using ratio consistency test in order to make sure that they deserve to be used in the analysis of measurement using AHP method. Secondary data in form of regency road map, road handling, road condition data, population data and they were taken from Department of Public Works and Spatial Plan, Regional Development Planning Agency, Central Bureau of Statistics in OKI Regency, and related agencies in OKI Regency. The data is necessary for the analysis when using TOPSIS and
MOORA methods.
Weight determination of the criteria, sub–criteria and alternative way of measuring in AHP methods derived from primary data analysis such as questioners and interview results, to conduct TOPSIS methods the writer used weight value and sub-criteria from AHP methods, however alternative weight was taken from secondary data analysis. Whereas, the calculation in MOORA solely rely on alternative weight from secondary data. After the weight criteria, sub-criteria, and alternative were obtained.
Analyzing the data using AHP method, TOPSIS method and MOORA method with Microsoft Excel Software to get the ranking of road handling priority.
Analyzing the effect of research method towards the results of road handling priority evaluation with . Wilcoxon Signed Rank Test in SPSS Software.
2.2 Criteria and Sub Criteria Evaluation
There are some criteria and sub-criteria used in this study, such as:
1. Cost and financial aspects a. Road improvement cost
Road improvement cost is obtained from unit price per kilometer for road improvement multiplied by road length with badly damaged roads.
b. Road maintenance cost
Road maintenance cost is obtained based on unit price per kilometer. Regular maintenance costs and routine multiplied by mediocre and lightly damaged road. 2. Road network conditon
a. Accessibility aspect
Accessibility aspect is facility guidelines for road users to reach and access their destinations in the region. The measurement of accessibility is length in kilometer divided by total area of the region where the road is located in square kilometer unit.
b. Mobility aspect
Mobility aspect is road quality service which is measured by the ease of road users to use the road to reach their destination. The measurement of mobility access is road length in kilometer unit divided by total road users.
3. Road conditions a. Road damage level
Percentage of road condition (good, mediocre, lightly damaged, badly damaged) multiplied by each road weight condition. Each weight is calculated to obtain total weight for road
b. Type of road surface
Percentage of observed road hardness types (concrete, asphalt, rock and soil) multiplied by weight for all road hardness respectively. Each weight will be added to obtain total road hardness weight types.
c. Daily traffic rate
Daily traffic rate is the results of total number of cars division during observation. Daily traffic rate is stated using unit of passenger car.
4. Socioeconomic aspect
a. Total number of served population
Total number of population who received benefits from the observed road.
b. Total numbe of served public facilities
239
and education facilities) which available along the soon to be observed roads.
5. Area development aspect a. Road connection function
Road connection function viewed towards spatial plan system of the regency consists of regional activity centre, local activity centre, promotional local activity centre, area service centre and local service centre. Each criteria is given a weight value and these criteria will be added to obtain road connection function weight. b. Area development potency
The evaluation of road viewed from Area development potency such as production forest area development potency, agriculture, plantation, farming and industry. Each criterion is given a weight value and the criteria which is located along the observed road will be added to obtain area development potency weight value.
2.3 Analytical Hierarchy Process (AHP) Method
Some basic principals in order to overcome the problems is by using AHP method, such as [4] :
1. Creating hierarcy (Decomposition)
All criteria on the same level will be compared until it forms paired matrix comparison as showed in equation 1.
A=[
1 ⋯ aij
⋮ 1 ⋮
aji ⋯ 1
] (1)
where aij=x , so that aji= 1 x⁄ which an inversion of aij, and
vice versaaji=x, so aij= 1 x⁄ is an inversion of aji.
2. Comparative Judgment
Value and the definition of qualitative opinion in comparison scale (1994) [5], as seen on Table 1.
TABLE1
PAIRWISE COMPARISION SCALE
Scale Definition
1 As important as it is 3 Less more important
5 More important
7 Very important
9 Absolutely more important
2, 4, 6, 8 Median
3. Synthesis of Priority
The evaluation is conducted on every comparison matrix cells, so it can obtain a new comparison matrix which is the combination of all comparison matrix from all respondents so it will obtain eigen vector for each criteria by using equation 2.
wi=√nai1xai2xai3x…xain (2)
Weight criteria of eigen vector is (Xi) is determined through equation 3.
xi=( wwi
i) (3)
The maximum eigen value (λ maks), obtained equation 4.
λ maks= a ij.x j (4)
4. Logical Consistency
Consistency measurement from a matrix is based on maximum eigen value, so that the consistency which usually derived from comparison matrix can be minimized and it can be calculated using equation 5.
(5)
The comparison between CI and RI for a matrix is defined as Consintency Ratio (CR) as seen in equation 6.
CR=CIRI 0,1 (6)
Random Index value (RI) has been determined based on ordo of comparison matrix created and served on Table 2 below [5], whereas for the calculation of road comparison with ordo matrix, ordo matrix which is more than 15 is can be seen on table 3 [6].
TABLE2
RANDOM INDEX VALUE
n RI
1 0
2 0
3 0,58
4 0,9
5 1,12
6 1,24
7 1,32
8 1,41
9 1,45
10 1,49
TABLE3
MORE THAN 15RANDOM INDEX VALUE
n RI
16 15.978 17 16.086 18 16.181 19 16.265 20 16.341 21 16.409 22 16.470
End value from each alternative total weight is obtained by adding the multiplication of weight criteria, sub criteria and alternative with mathematical system [7] in equation 7. Then, the weight value is ranked from the biggest to the smallest.
Y=A (c1 x a1+…+cn x an)+…+D (c1 x a1+…+ cnx an) (7)
with ;
240
a1, …, an : alternative weight
2.4 Technique for Order Reference by Similarity to Ideal Solution (TOPSIS) Method
TOPSIS (Technique For Orders Reference by Similarity to Ideal Solution) is developed by Hwang and Yoon in 1981 [8]. This method has principal that the chosen alternative must have closest distance from positive ideal solution and the furthest from negative ideal solution. The selected item will be ranked based on a value so that the alternative with shortest distance with an ideal positive solution is the best alternative item. Alternative with bigger score is the best to choose. In this study, the stages in TOPSIS methods are :
1. Determining decision matrix normalization. Normalized value is calculate using equation 8.
rij= xij
√∑m xij2 i=1
(8)
with i = 1,2,…,m and j = i = 1,2,…,n
2. Determining normalized value of decision matrix.
Normalized weight value , vij is calculated with equation
9.
vij=rij . wj (9)
where i = 1, 2, ..., m; and j = 1, 2, ..., n
3. Determining a positive ideal solution and negative ideal solution is defined as normalized weight value with equation 10.
A+={y1+, …,…, y n
+} (10)
A-={y1-, …,…, y n -}
with yj+={max(y
ij) if j=benefit, min(yij) if j=cost}
yj-={max(y
ij) if j=benefit, min(yij) if j=cost}
4. Determining the distance of alternative value from positive ideal solution and negative ideal solution can be seen in equation (11,12) below;
Si+=√∑ (mj=1 yij-yj+) (11)
where, j = 1,2,…,m
Si-=√∑ (yij-yj -) m j=1
2
(12)
where, j = 1,2,…,m
5. Calculating relative closeness towards most ideal solution is using the equation below;
Ci*= Si
-Si*+Si
(13)
with 0 < Ci* < 1 and i = 1,2,…,m
6. Ranking the alternative based on value. So from that point, the best alternative is one of the item with the shortest distance to a positive ideal solution and has the farthest distance to negative ideal solution.
2.5 Multi-Objective Optimization on The Basic of Ratio Analysist (MOORA) Method
MOORA method was first introduced by Brauers and Zavadkas (2006) [9] used it for the first time when he took a decision with multi criteria. This method has high flexibility level and a convenience to separate subjective items from an evaluation process into the decision of weight criteria with some attributes for decision making. MOORA method has good selectivity because it can determine the objective of incompatible criteria where benefit criteria or cost criteria [10]. In MOORA method there are five main steps [9]
1. Determining the objective and identify related evaluation attributes.
2. Determining matrix of responses.
Matrix of responses ( ) shows value from all alternative i
towards the objectives j, i = 1, 2, …, m; m is the total number of alternative, j = 1, 2, …, n; n total number of the objective. Matrix of responses is show in equation 14.
X=[
x11 … x1i … x1n
xj1 … xji … xjn
xm1 … xmi … xmn
] (14)
3. Calculating normalized matrix.
Ratio value is alternative value i toward attribute j and divided by denominator which represent all alternative toward attribute j. The calculation of ratio is shown in equation 15.
xij= xij
√(∑mj=1xij2)
(15)
4. Calculating the optimization.
Calculating the optimization is by adding beneficial attribute value j so g that is reduced with cost attribute value g+1 so n for each alternatives i as shown in equation 16.
yj*=∑ x ij * i=g
i=1 -∑ni=g+1xij* (16)
for g is total atrribute that will be maximized, (n-g) is total number of atrributes which will be minimized, and is normalized value for alternative i toward all attribute. To show an attribute is more important, it can be multiplied with matching weight (significant coefficient) when this weight is being considered so the equation will become equation 17 as follow;
∑ ∑ (17)
5. Alternative ranking.
Value of can be positive or negative depends on total maximum (beneficial attributes) or minimum (non beneficial attribute) within decision matrix. The biggest value will be the best alternative, whereas the lowest alternative has the smallest value.
3
RESULT AND DISCUSSION
3.1 Calculation of AHP Method
241
Figure 2. Structure AHP
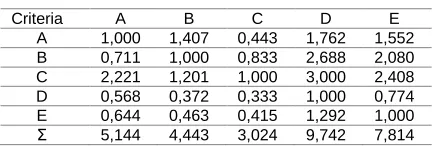
Next step is determining paired comparison between criteria in form of matrix. Comparison score is based on weighing derived from interview results and filling the questioners, respondents were from Department of Public Works and Spatial Plan and Regional Development Planning Agency of OKI Regency. There were 30 respondents for this study. The equation (2) was used to gather all information and opinions from the experts in form of geometric rate equation. Paired matrix arrangement can be seen in the following Table 4.
TABLE4
PAIRED MATRIX COMPARISION
Criteria A B C D E
A 1,000 1,407 0,443 1,762 1,552 B 0,711 1,000 0,833 2,688 2,080 C 2,221 1,201 1,000 3,000 2,408 D 0,568 0,372 0,333 1,000 0,774 E 0,644 0,463 0,415 1,292 1,000 Ʃ 5,144 4,443 3,024 9,742 7,814
Next step is normalization of paired matrix criteria by dividing the contents of comparison matrix with total number in matching column. Complete results normalization matrix can be seen on Table 5 below.
TABLE5
NORMALIZATION MATRIX
Criteria A B C D E
A 0,194 0,317 0,146 0,181 0,199 B 0,138 0,225 0,275 0,276 0,266 C 0,432 0,270 0,331 0,308 0,308 D 0,110 0,084 0,110 0,103 0,099 E 0,125 0,104 0,137 0,133 0,128 Ʃ 1,000 1,000 1,000 1,000 1,000
Sythesis weight can be obtained by adding the lines on each normalization matrix and then eigen vector was obtained by dividing each synthesis weight with synthesis weight. Next maximum eigen value obtained from multiplication results on paired matrix comparison with eigen vector from each criteria, then to determine lamda maximum is by adding the result of maximum eigen division with eigen vector from each criteria
and divided by total number of criteria, the complete results can be seen on Table 6 below.
TABLE6
EIGEN VECTOR CALCULATION
Criteria Synthesis Weight
Eigen Vector
Eigen Max λ max
A 1,037 0,207 1,059 5,105
B 1,181 0,236 1,191 5,044
C 1,649 0,330 1,680 5,094
D 0,506 0,101 0,514 5,077
E 0,628 0,126 0,636 5,070
Ʃ 5,000 1,000 5,080 5,078
Then determining CI (Consistency Index) value using equation (5), Consistency Ratio (CR) obtained from the division of CI (Consistency Index) with Random Index (RI) calculating using equation (6), requirements of paired matrix can be approved when the value of CR < 0,1. RI score can be seen on Table 2 and Table 3. The calculation for sub-level criteria is conducted in the same stage, same as criteria calculation above, started from the beginning matrix until weighing. Recapitalization for each criteria and sub criteria from AHP method analysis can be seen on Table 7.
TABLE7
RECAPITULATION OF WEIGHT CRITERIA,SUB CRITERIA AND
ALTERNATIVE
Level Definition Weight
Criteria
A. Cost and Finance Aspect 0,207 B. Road Network Condition 0,236
C. Road Condition 0,330
D. Socioeconomic Aspect 0,101 E. Area Development Aspect 0,126
Sub Criteria
A1. Road Improvement Cost 0,454 A2. Road Maintenance Cost 0,546 B1. Accessibility Aspect 0,542
B2. Mobility Aspect 0,458
C1. Road Damage Level 0,590
C2. Road Surface Types 0,231 C3. Daily Traffic Rate 0,180
D1. Served Population 0,570
D2. Served Public Service 0,430 E1. Road Connection Function 0,422 E2. Area Development Potency 0,578
Alternative
1. Tanjung Lubuk – Sri Tanjung 0,049 2. Kayuagung - SP 1 Sumber Hidup 0,152 3. Simpang Kijang – Terusan Menang 0,125 4. Sirah Pulau Padang - Pampangan 0,091 5. Simpang Tiga – Talang Rimba 0,014 6. Ujung Tanjung – Simpang Tiga 0,011 7. Pampangan – Lebung Batang 0,077 8. Bumi Agung – Cahaya Tani 0,021 9. Simpang Dabuk Rejo – Catur Tunggal 0,038 10. SP. 4 Harapan Jaya – Sungai Ceper 0,008 11. Talang Jaya – Sungai Menang 0,018 12. Talang Jaya - Cengal 0,015 13. SP.1 Talang Jaya - SP.4 Harapan
Jaya
242
Next step is calculating to obtain ranking based on weight in each criteria, by adding the multiplication of weight criteria with sub criteria weight and alternative weight. The calculation is using mathematical model [7] and calculated by using equation (7) Calculation for another road is conducted by using the same way, Y value on each roads is ranked from the biggest to the smallest in order to determine ranking priority on road handling in OKI Regency. The calculation results can be seen on Table 8.
TABLE8
RANK BASED ON AHPMETHOD
Rank Road Code Weight
1 Road 2 0,1515
2 Road 3 0,1245
3 Road 19 0,1040
4 Road 15 0,1018
5 Road 4 0,0904
6 Road 7 0,0767
7 Road 18 0,0607
8 Road 1 0,0491
9 Road 9 0,0382
10 Road 20 0,0320
11 Road 21 0,0305
12 Road 8 0,0213
13 Road 17 0,0199
14 Road 11 0,0179
15 Road 12 0,0149
16 Road 5 0,0136
17 Road 14 0,0116
18 Road 6 0,0114
19 Road 16 0,0093
20 Road 13 0,0085
21 Road 10 0,0084
3.2 Calculation Using TOPSIS Methods
In TOPSIS and MOORA calculation methods, the criteria used were sub criteria in AHP method, weight value criteria is global weight from AHP method analysis as seen on Table 9. Whereas, in order to determine decision matrix on Table 10 was taken from secondary data processing by alternative weighing based on determined criteria variable. Decision matrix on Table 10 will be used in calculation using TOPSIS method and MOORA method [12],[13].
TABLE9
DETERMINING TOPSISWEIGHT CRITERIA METHOD
Code Criteria Global Weight
C1 Road Improvement Cost 0,094
C2 Road Maintenance Cost 0,113
C3 Accessibility Aspect 0,128
C4 Mobility Aspect 0,108
C5 Road Damage Level 0,194
C6 Road Surface Types 0,076
C7 Daily Traffic Rate 0,059
C8 Served Population 0,058
C9 Served Public Service 0,044
C10 Road Connection Function 0,053 C11 Area Development Potency 0,072
TABLE10
DECISION MATRIX
C1 C2 C3 C4 C5 C6 C7 C8 C9 C10 C11
(in million) (in million)
Road 1 57.150,00 15.164,20 2,219 0,017 1,95 3,22 1623 3531 44 5 36 Road 2 44.450,00 15.932,00 1,500 0,020 1,43 3,89 2778 5078 76 4 32 Road 3 26.670,00 8.964,40 2,645 0,006 1,54 3,00 2480 6518 58 1 26 Road 4 90.170,00 29.048,72 4,459 0,011 2,63 3,00 2391 8232 81 3 55 Road 5 106.045,00 32.684,00 0,112 0,007 3,39 1,35 709 272 16 1 8 Road 6 119.284,75 22.525,40 0,254 0,008 2,45 1,53 656 650 17 1 8 Road 7 40.963,85 9.546,04 1,488 0,016 1,69 2,95 2106 2465 45 4 32 Road 8 34.366,20 15.209,60 0,490 0,002 3,57 3,00 1124 2012 44 1 12 Road 9 50.933,35 14.064,84 0,810 0,006 1,84 3,38 2229 2214 50 3 20 Road 10 91.509,85 29.558,80 0,066 0,006 2,88 1,13 726 179 15 1 10 Road 11 70.383,40 12.811,36 0,376 0,021 2,20 2,43 1193 370 46 4 14 Road 12 99.066,35 29.106,84 0,037 0,003 2,68 2,78 1213 202 22 2 4 Road 13 131.959,35 33.650,80 0,405 0,035 2,77 2,00 822 223 18 1 15 Road 14 35.814,00 225,60 0,024 0,002 2,00 2,00 678 74 28 2 8 Road 15 100.330,00 27.313,68 1,563 0,017 2,01 3,51 2065 3010 52 3 32 Road 16 241.706,40 9.874,56 0,196 0,043 1,63 1,00 594 549 30 1 16 Road 17 37.496,75 11.732,20 0,984 0,008 1,78 2,12 2116 1898 59 1 28 Road 18 160.508,95 36.675,08 1,220 0,014 2,08 2,68 2313 3845 109 4 45 Road 19 71.120,00 27.734,16 0,888 0,004 2,95 3,07 2404 4194 60 2 25 Road 20 111.258,35 30.583,64 0,184 0,007 2,65 2,61 1459 556 45 3 25 Road 21 90.170,00 25.551,52 0,396 0,006 2,83 2,52 1389 1322 47 2 19
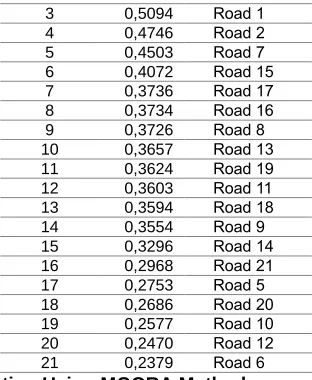
Then, normalizing decision matrix using equation (8). After that conducting weighing normalized matrix by using equation (9) that is multiplication of weight criteria with normalized matrix. Next, determining positive ideal solution and negative ideal solution based on equation (10). After that, conducting a calculation of positive separation measure and negative separation measure base on formula (11) and (12). Then, counting the prevalence value for every
alternatives using equation (13). The calculation results can be seen on Table 11
TABLE11
RANK BASE ON TOPSISMETHOD
Rank C Road Code
243 3 0,5094 Road 1
4 0,4746 Road 2 5 0,4503 Road 7 6 0,4072 Road 15 7 0,3736 Road 17 8 0,3734 Road 16 9 0,3726 Road 8 10 0,3657 Road 13 11 0,3624 Road 19 12 0,3603 Road 11 13 0,3594 Road 18 14 0,3554 Road 9 15 0,3296 Road 14 16 0,2968 Road 21 17 0,2753 Road 5 18 0,2686 Road 20 19 0,2577 Road 10 20 0,2470 Road 12 21 0,2379 Road 6 3.3 Calculating Using MOORA Method
To start the calculation using MOORA method it is important to determine the evaluation criteria. The criteria used are the same criteria for AHP and TOPSIS method. The criteria which is determined in order to withdraw the decision are grouped into benefit criteria (+) or cost (-). Besides that, to make the calculation process become easier so, the code was created to represent every criteria name. The determination of criteria data in this study is shown in Table 12 below [14].
TABLE12
CRITERIA DETERMINATION IN MOORAMETHOD
Code Criteria Type of Criteria
C1 Road Improvement Cost -
C2 Road Maintenance Cost -
C3 Accessibility Aspect +
C4 Mobility Aspect +
C5 Road Damage Level +
C6 Road Surface Types +
C7 Daily Traffic Rate +
C8 Served Population +
C9 Served Public Service +
C10 Road Connection Function + C11 Area Development Potency +
Within calculation analysis using MOORA method, next step was creating Matrix of Response, is the decision matrix taken from analyzed secondary data based on determined criteria and creating normalized decision matrix. Calculating stages towards TOPSIS methods are alike so it is not necessary to re-state and continued to value optimization stages or value which is the difference from maximum criteria method. Maximum value is addition of benefit (+) value criteria whereas minimum value is the addition of cost (-) criteria. The end result is an alternative ranking based on optimization value. The best alternative is alternative object with highest optimization value. The ranking of optimization value or from the biggest to the smallest is to obtain ranking priority of road handling in OKI Regency and can be seen on Table 13.
TABLE13
RANK BASE ON MOORAMETHOD
Rank Road Code Optimization Value
1 Road 4 2,7626
2 Road 2 2,3259
3 Road 1 2,0889
4 Road 3 2,0401
5 Road 7 1,8851
6 Road 18 1,8116
7 Road 15 1,6708
8 Road 19 1,5142
9 Road 9 1,4709
10 Road 17 1,3658
11 Road 11 1,2759
12 Road 8 1,0988
13 Road 21 0,9605
14 Road 20 0,9223
15 Road 13 0,7479
16 Road 14 0,7341
17 Road 16 0,6717
18 Road 12 0,4875
19 Road 6 0,3657
20 Road 5 0,3110
21 Road 10 0,3028
3.4 Results from All Priority Ranks from All Methods
On Table 14 can be seen that recapitalization of road weight calculation in OKI Regency is using 3 analytical methods namely AHP, TOPSIS and MOORA.
TABLE14
RANK OF PRIORITY RECAPITULIZATION
RANK AND WEIGHT
Road Code AHP TOPSIS MOORA
Road 1 8 0,0491 3 0,5094 3 2,0889 Road 2 1 0,1517 4 0,4746 2 2,3259 Road 3 2 0,1247 2 0,5101 4 2,0401 Road 4 5 0,0905 1 0,6409 1 2,7626 Road 5 16 0,0136 17 0,2753 20 0,3110 Road 6 18 0,0114 21 0,2379 19 0,3657 Road 7 6 0,0768 5 0,4503 5 1,8851 Road 8 12 0,0213 9 0,3726 12 1,0988 Road 9 9 0,0382 14 0,3554 9 1,4709 Road 10 21 0,0084 19 0,2577 21 0,3028 Road 11 14 0,0180 12 0,3603 11 1,2759 Road 12 15 0,0149 20 0,2470 18 0,4875 Road 13 20 0,0085 10 0,3657 15 0,7479 Road 14 17 0,0116 15 0,3296 16 0,7341 Road 15 4 0,1019 6 0,4072 7 1,6708 Road16 19 0,0093 8 0,3734 17 0,6717 Road 17 13 0,0199 7 0,3736 10 1,3658 Road 18 7 0,0608 13 0,3594 6 1,8116 Road 19 3 0,1042 11 0,3624 8 1,5142 Road 20 10 0,0321 18 0,2686 14 0,9223 Road 21 11 0,0305 16 0,2968 13 0,9605 3.5 Wilcoxon Signed Rank Test
Enlisting rank priority data from each methods as shown on Table 14, then conducting Wilcoxon Signed Rank Test by using SPSS software in order to analyze paired road priority rank results from combination of two evaluating methods whether the results are different or not [15].
244
TABLE15
WILCOXON TEST (AHP-TOPSIS)
TABLE16
WILCOXON TEST (TOPSIS-MOORA)
TABLE17
WILCOXON TEST (AHP-MOORA)
TABLE18
TEST STATISTICS
On Table 18, test statistic shows that asymp. sig. (AHP-TOPSIS) value as much as 0,852, asymp. sig. (AHP-(AHP-TOPSIS) as much as 0,895, asymp. sig. (AHP-MOORA), as much as 0,983. Significant value from three combination methods shows that sig >0.05, so (Ho) is accepted, it means there isn’t any significant difference on rank priority produced by the methods.
4
CONCLUSION
a. The evaluation using Analytic Hierarchy Process (AHP) depends on respondents evaluation perceptions, Technique for Order Preference by Similarity to Ideal Solution (TOPSIS) method, evaluation is using combination of respondents evaluation and physical data taken from the field, whereas Multi Objective Optimization on the Basis of Ratio Analysis (MOORA) method does not depend on respondents’ weigh evaluation because it only uses physical data taken from the field. Thus, the evaluation must using experts who understand about the object which will be observed in order to obtain more objective weighing. b. Based on Wilcoxon Signed Rank Test, it can be concluded that three research methods namely AHP, TOPSIS dan MOORA significantly provide a slightly similar results on priority ranks. So the decision takers can use or choose the methods based on physical data from the field or based on their perceptions as good supporting systems to determine the road handling priority.
REFERENCES
[1] BPS (Badan Pusat Statistik), 2018. OKI dalam Angka. BPS Kabupaten Ogan Komering Ilir.
[2] Bhandari, B. S., et al , 2014. Multi-criteria Evaluation for Ranking Rural Road Projects: Case study of Nepal. IOSR Journal of Mechanical and Civil Engineering (IOSR-JMCE), 2014, Volume 11, Issue 6 Ver. I (Nov- Dec. 2014), PP 53-65.
[3] Bhandari, B. S. and Nalmpantis, D., 2018. Application of Various MultipleCriteria Analysis Methods for the Evaluation of Rural Road Projects. The Open Transportation Journal, 2018, 12, 57-76.
[4] Mulyono, A.T., 2007. Model Monitoring dan Evaluasi Pemberlakuan Standar Mutu Perkerasan Jalan Berbasis Pendekatan Sistemik. Disertasi, Program Pascasarjana Universitas Diponegoro, Semarang, Indonesia.
[5] Saaty, T, L. and Luis G. Vargas. 1994. Fundamental Of Decision Making and Priority Theory With The Analytic Hierarchy Process. Pittsburg : University of Pittsburgh RWS Publication. [6] J. A. Alonso & M. T. Lamata, 2006. Consistency In The Analytic
Hierarchy Process : A New Approach. International Journal of Uncertainty, Fuzziness and Knowledge-Based Systems Vol. 14, No. 4 (2006) 445−459.
[7] Brodjonegoro, P. S., 1991. Petunjuk Mengenai Teori dan Aplikasi dari Model The Analytic Hierarchy Process. Jakarta. Sapta Utama.
[8] Kecek G. and Demra F., 2016. A Comparative Analysis of TOPSIS and MOORA in Laptop Selection. Research on Humanities and Social Sciences. Vol.6, No.14, 2016.
[9] Brauers, W.K.M. and EK Zavadskas, E.K., 2006. The MOORA method and its application to privatization in a transition economy control and cybernetics.
[10] Mandal, K. U., dan Sarkar, B., 2012. Selection of Best Intelligent Manufacturing System (IMS) Under Fuzzy Moora Conflicting MCDM Environment, International Journal of Emerging Technology and Advanced Engineering, No.9, Vol.2, 301–310.
Ranks
N Mean Rank Sum of Ranks AHP
-MOORA
Negative Ranks
9g 9,44 85,00
Positive Ranks
9h 9,56 86,00
Ties 3i
Total 21 g. AHP < MOORA
h. AHP > MOORA i. AHP = MOORA
Test Statisticsa AHP - TOPSIS
TOPSIS - MOORA
AHP - MOORA
Z -,187b -,131b -,022b
Asymp. Sig. (2-tailed) ,852 ,895 ,983 a. Wilcoxon Signed Ranks Test
b. Based on negative ranks.
Ranks
N Mean Rank Sum of Ranks AHP -
TOPSIS
Negative Ranks
10a 11,00 110,00
Positive Ranks
10b 10,00 100,00
Ties 1c
Total 21 a. AHP < TOPSIS
b. AHP > TOPSIS c. AHP = TOPSIS
Ranks
N Mean Rank Sum of Ranks TOPSIS
-MOORA
Negative Ranks
9d 9,83 88,50
Positive Ranks
9e 9,17 82,50
Ties 3f
Total 21 d. TOPSIS < MOORA
245
[11] Irawan, H., et al, 2016. Penentuan Skala Prioritas Penanganan Jalan Kabupaten di Kabupaten Kudus Dengan Metode Analytical Hierarchy Process. Jurnal Teknik, 37(2), hal. 72-77, 2016.
[12] Chamid, A. A. dan Murti, A. C., 2017. Kombinasi Metode AHP dan TOPSIS Pada Sistem Pendukung Keputusan. Prosiding SNATIF ke-4 Tahun 2017.
[13] Fadlan, M. 2017. Terapan Kombinasi Metode Topsis dan Analytical Hierarchy Process pada Perekomendasian Penerimaan Beasiswa Peningkatan Prestasi Akademik (Studi Kasus pada STMIK PPKIA Tarakanita Rahmawati). Jurnal SIMETRIS, Vol 8 No 2 November 2017.
[14] Wardani1, S., Solikhun, dan Revi, A., 2018. Analisis Sistem Pendukung Keputusan Penyeleksian Siswa Calon Peserta Olimpiade Dengan Metode MOORA. Jurnal Teknovasi Volume 05, Nomor 01, 2018, 18 – 26 ISSN : 2540-8389.