52 IJSTR©2020
MRI Brain Tumor Image Classification Using
Morphological operations and Neural Network
Algorithm
Rahul Mapari, Sangeeta Kakarwal , Ratnadeep Deshmukh
Abstract— Presently, the brain tumor had risen up to large scale. Designing an automated process to recognize the tumor from MRI pictures is essential. MRI brain Image is the frame muscle that had been generated through gradual adding up of the irregular cells and it is essential to detect the brain tumor from the MRI for diagnosis. In addition, brain MRI tumor recognition and classification is the routing method for the human research. The understanding of the pictures is dependent on the arranged and open classification of brain MRI and different methods had been planned. The data recognized with the atomically design structure and possible anomalous cells that are notable to treat provided by the MRI Image segmentation on brain. The planed scheme used the NN and wavelet transformation approach for the desired segmentation and classification method which is done through layer based classified method. In proposed work, initially the self-organized map NN trained the extracted characteristics from DWT merge wavelet, and output morphological features and filter factors were subsequently trained by NN and testing procedure is accomplished in two phases. The planned NN classified scheme categorized the brain tumor in binary trained procedure that provides preferred presentation above conventional classification technique. The planned method has been validated along with the provision of the actual information database and experiment analysis improved the performance rate.
Index Terms— MRI Brain Tumor, Neural Network, Wavelet Transformation, Morphological Operators and Feature Extraction method.
—————————— ——————————
1 I
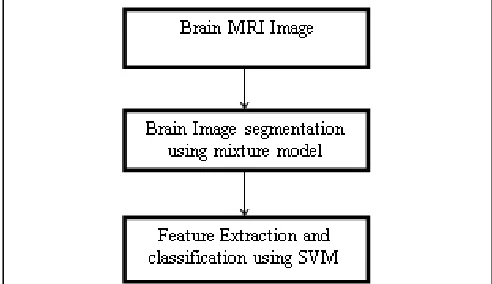
NTRODUCTION WITH the advent in the technological aspect in health care, this has resulted in the improvement of the health of patient [1]. Brain is one of the fast growing -life threatening diseases challenging large amount of individuals. However, brain tumor is classification scheme is significant to assure initial detection and classification of tumor [2],[3]. Brain tumor influences the medical condition of the human due to the non-standard development of the cells current in the brain. It disturb the functioning of the mind and may also work as the life-threatening [4], [5]. Generally, the two kinds of the brain tumors are detected as benign tumor and malignant tumor. Malignant are more dangerous as compared to benign tumor because of the huge development and it is more dangerous, whereas; benign is developed at slow rate and less dangerous. In addition, in medical imaging the technology depends on the non-invasive algorithm such as MRI, CT, scan, Ultrasound, and X ray [6],[7]. Generally, the disease of brain tumor has more influence on the life cycle of the human being due to its emergence as prevailing disease throughout the world. In the present technological world, the brain tumor disease has been identified using MRI, but in some situations, the radiologists (Expert pathologists) may identify tumor [8] [9]. MRI is the most commonly used technique as compared to other methods and it provides the high contrast pictures of the brain and infectious tissues. Different medical services like as cancertumor stage used analytical models [10], [11]. Though, human beings classified the pictures for grading the tumors that is interrelated to intergrade change that depends on the visualized characteristics of lesions [13]. However, brain tumor are accomplished of assisting in major diagnosis that are categorized through an automatic picture analysis procedure [14], [15]. There is not already defined features of tumor and lesions need an exact distinction from being standard to infectious tissue [16]. It has been a challenging approach in the picture analysis of brain tumor. Presently, the SVM has an enhanced bio-medical and biological picture analysis services like as cell identification form histological pictures, cancer and skin infection classification [17],[18]. In the given figure1, brain tumor disease classified in MRI pictures that that has been processed using classifier that depends on SVM [19]. In the initial stage, the tumor area disseminated through an ICA model. Using segmented picture machine learning characteristics were eliminated through SVM approach [20].
————————————————
Rahul Mapari, Computer Science and Engineering Department,Maharashtra Institute of Technology, Aurangabad, India. Email: [email protected]
Sangeeta Kakarwal, Computer Science and Engineering Department, PES College of Engineering, Aurangabad, India. Email: [email protected]
Ratnadeep Deshmukh, department of Computer Science and IT, Dr.
53 IJSTR©2020
It has been estimated that the body creates some additional cells that again generate the lump of tissue so, it is known as tumor. The tumor presents in brain area that may cause the sensible operation of the body that is to be reformed. It is not easy and unsafe to diagnose because of the position and disseminate the ability. Generally, the previous classified and detected of the cancer image is essential. Currently, CAD (computer aided diagnosis) are essentially utilized for regular and specified detection of the brain irregularities. The cancer image is the abnormal growth of the tissue or the center spine that interrupt the appropriate operative of the brain. Researchers had investigated through the NCIS (National Cancer Institute Statistics) that in USA about 12,765 deaths take place every year, 1065 in month, 234 in week and 30-30 persons in a day. The major advantage of the brain tumor detection is that the disease can be treated at correct time. In addition, the identification is done at rapid speed and accurately. Generally, the detection is done by medical experts where MR (Magnetic Resonance) and distrustful areas are extracted using MRI picture segmentation procedure. Brain tumor classification is utilised to classify every entity in group of data into pre-defined group of the classes. In contrast, classification is a significant method to distinguish the standard and tumor brain pictures. In existing approach, they calculated the unique properties using LBP full form Local Binary Pattern algorithm. In this algorithm, the extraction of the histogram though the small area of the tissues and single feature vector was generated. The features after the extracted data were comparable to dataset pictures. After the extraction of the features, the classification procedure is done by DL (Deep Learning) method to detect the features of the cancer disease. The proposed approach, the extraction of the textual features and classifications done using wavelet coefficient rule and NN method. The features extracted through the Wavelet Co-Efficient Rule Based Fusion (WCRBS) technique are extracted the text based features. The textual pattern Characteristics are calculated from the MRI images using WCRBS method to recognize the region of weights. Generally, the wavelets are utilized to recognize the various frequencies of picture through diverse scales. This algorithm enables both the local and global features available in the picture. In the addition, Brain image segmentation is done through the contour based ROI segmentation process. Along with that, the classification of local and global features as glioma is done through Neural Network technique. To compute the performance metrics such as accuracy rate, specificity and, sensitivity. Sections are described as charts; section 1 explained the overview of the MRI cancer detection, Cancer brain image segmentation and classification along with its advantages. The comprehensive study of various papers has been done in section 2. The research work has been discussed in section 3. In addition, the section 4 elaborated the results and discussions. Moreover, the conclusion has been given in section 5.
2
P
RIORW
ORK54 IJSTR©2020
Fig. 2. Proposed Methodology
public database of the brain pictures. Experimental analysis demonstrated that have better performance comparable to current methods in term of classified accuracy up to 94.3% using random hold-out method. Saraswathi, V et al., 2019 [25] presented research on the multiple class classification of the brain tumor in MR neurological pictures through randomized forest classification with three methods. In the planned model, the GLCM, LBP (Shape based and local binary pattern) characteristics were calculated. After that, PCA (principal component analysis) were utilized for the size deduction of the calculated feature vector (FV). The complete features were eliminated into smaller patches comprising 3X3 in localized window. The experiment analysis was done on brain tumor database comprising 3064 T1 weigh contrast improved pictures and comparative study of RF, RF-PCA and RF-PCA along with randomized selection. Experimental results showed that RF-PCA along with randomized selection performed better compared to other techniques along with testing accuracy was 8.8%and validated accuracy of about 85.4%.
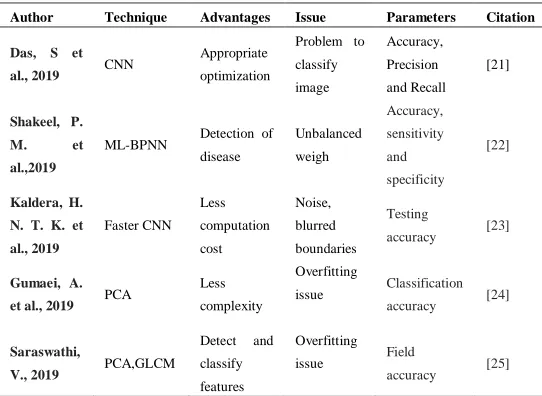
TABLE1
LITERATURE ANALYSIS WITH VARIOUS METHODS,ADVANTAGES AND
PERFORMANCE METRICS
Author Technique Advantages Issue Parameters Citation
Das, S et
al., 2019 CNN
Appropriate optimization
Problem to classify image
Accuracy, Precision and Recall
[21]
Shakeel, P.
M. et
al.,2019
ML-BPNN Detection of disease
Unbalanced weigh
Accuracy,
sensitivity
and
specificity [22]
Kaldera, H.
N. T. K. et
al., 2019
Faster CNN Less computation cost
Noise, blurred boundaries
Testing
accuracy [23]
Gumaei, A.
et al., 2019 PCA
Less complexity
Overfitting
issue Classification accuracy [24]
Saraswathi,
V., 2019 PCA,GLCM
Detect and classify features
Overfitting issue Field
accuracy [25]
3 P
ROPOSEDM
ETHODOLOGYIn this section explained the research methodology using NN (Neural Network) algorithm. NN (Neural Network) classification algorithm to detect the disease in brain images and evaluate the performance metrics such as accuracy rate,
specificity, sensitivity and compared it. Initial the download the dataset from the online repository site. This dataset is divide into different dataset images in brain images. Image brain cancer tumor pre-processing process is used to eliminate the noise, smooth image and segment the brain images.
3.1 Segmentation phase:
Initially read the Brain Tumor Image (MRI) T1C and T2 Image series. Attain S1 image after the image fusion the T1C and T2 MRI brain image series using wavelet transformation (DWT) with max protocol and display it. The read the S1 and Fair Brain Image Series. F(x1, y1) fused image series is created after fusing the S1. and Fair Brain Image Series and display it. It apply the skull strip in order to eliminate the gray scale matter from the skull of brain image series F(x1,y1).Get the reflection brain image r (x1,y1) of the combined MRI Image F(x1,y1). D(x1, y1) is the MRI image difference attained after subtract the F(x1, y1) from r(x1, y1).
Formula:
D(x1, y1) = F(x1, y1) – r(x1, y1).. (i) .
Then applied the ACM (Advance Contour Method) to get the image segmented edges or regions and display it.
At the last, for precise brain tumor isolation use the imerode and imdilate method repeatedly, until the MRI brain tumor is completely eliminated. Evaluated the tumor area and volume of segmented region and show the tumor along with area and column.
3.2 Feature Extraction:
Implement the morphological characteristics based on shape based unique properties are extracted from cancer segmented region and edge which is attained from the early phase or stage which are;
(i) Major Length and (ii) Minor Length (iii) Eccentricity
(iv) Roundness and Equi. Distance (ED).
Show the brain tumor region along with all the evaluated morphological characteristics in a window. Now, evaluate the text features from the image segmented brain tumor edge using a technique based on DWT, LBP and GLRLM (Grey-Level Run Length Matrix).
The main technique is illustrated below:
1. Three wavelet LL, HL, LH and HH sub-bands are the output of DWT technique and three are feed into LBP method. 2. Three Linear Binary Pattern method images are the output of LBP technique and these 3 LBP Images are numbered into 8 –bits in order to make 8-bit indexed Brain Tumor Images.
3. Now, with the help of GLRL approach 11 features are evaluated in 4 directions such as 0, 45, 90 and 135 degree and for each LBP index brain image 44 characteristics (4*11) are evaluated.
4. Because there are 3 index MRI images so a total of 132 features are evaluated and utilized for train the staked ensemble model.
55 IJSTR©2020
Fig. 3. Back propagation neural network model
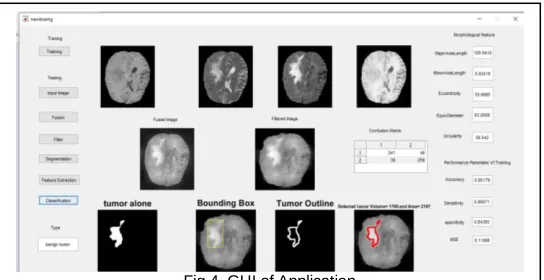
Fig.4. GUI of Application 3.3 Classification Process:
The classification process is valued to classify the cancer area in the MRI image into benign and malignant type. We use back propagation neural network for classification. The features extracted in previous step are given input to the back propagation neural network.
Back propagation Network
Back-propagation is the foundation of neural net training. It is the method of fine-tuning a neural net's weights based on the rate of error obtained during the previous epoch (i.e., iteration). Proper weight adjustment helps you to reduce error levels and make the model reliable by increasing its generalisation.
Inputs X, arrive through the pre-connected route. Input is modeled with real weights W. Weights are normally picked at random. Calculate the output from the input layer, to the hidden layers, to the output layer for each neuron Calculate the Outputs defect.
ErrorB= Actual Output – Desired Output
Travel back to the secret layer from the output layer to change the weights in such a way as to minimize the error. Keep repeating the process until reaching the desired output. Back propagation is a short term for "backward error propagation," a popular approach for training artificial neural networks. This method helps to calculate a loss function's gradient with respect to all the network weights. The advantages of Back propagation are:
Back propagation is programmable fast, easily and clearly. There are no parameters to fine-tune apart from input numbers. It is a versatile process, since it does not require prior network knowledge. It's a standard method that works well, in general. There is no need for any special mention of the function features to be learnt. The neural network algorithm Back propagation (BP) is a multi-layer feed forward network trained according to the algorithm of error back propagation and is one of the most commonly used neural network models. BP network can be used to learn and store a lot of input-output mapping relationships, and no need to reveal the mathematical equation defining these mapping relationships in advance. Its learning rule is to follow the steepest descent method by which the back propagation is used to control the network's weight value and threshold value to achieve the square’s minimum error number. BP
algorithm is actually a method of monitoring learning. It uses mean square error and gradient descent methods to make the adjustment to network connection weight. The adjustment to network link weight is intended to achieve the minimum square error number. In this algorithm, the network connection value is given a little value first, and then a training sample is chosen to measure the error gradient relative to this sample. The BP learning process can be described as follows:
1. Operating signal forward propagation: The input signal is propagated from the input layer to the output layer through the hide layer. The weight value and offset value of the network are held constant throughout the forward propagation of the operating signal, and the status of each layer of neuron can only affect that of the next layer of neuron. In case the expected output in the output layer cannot be achieved, it can be switched to the error signal for back propagation.
2. Back propagation of the error signal: the difference between the actual output and the network's expected output is known as the error signal; in the back propagation of the error signal, the error signal is propagated layer by layer from the output end to the input layer. The weight value of network is governed by the error feedback during the back propagation of the error signal. Continuous weight value and offset value adjustment is applied to bring the actual network output closer to the anticipated one.
The ideology that guides BP network's learning rules is: modification of the network's weight value and threshold value is done along the negative gradient direction that reflects the fastest decline in function.
k k k
k
x
g
x
1
……(1)
Here,
x
k represents the matrix of current weight value and threshold value;g
krepresents the gradient of current function; ŋk represents the learning rate.4 E
XPERIMENTALA
NALYSIS56 IJSTR©2020
Fig. 4. MRI Brain Dataset Images
85.18% 85.00% 84.36% 86.91%
50.67%
86.84%
0.00% 10.00% 20.00% 30.00% 40.00% 50.00% 60.00% 70.00% 80.00% 90.00% 100.00%
sensitivity specificity Accuracy
Val
ue
Performance Metrics
Comparative Analysis
Proposed Scheme KNN
Fig.6. Comparison –Accuracy Rate, Specificity and Sensitivity between proposed scheme and KNN
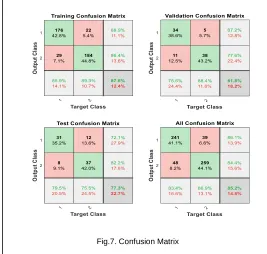
Fig.7. Confusion Matrix
a new method to classify the cancer area in MRI Images. The research based method is part defined the existing section 2 and 3. The detail description on the proposed result and the performance is studied or calculated. The research based method is proposed in the operational platform of MATLAB simulation tool and the detail description on the research work presentation calculate is as follow:
(i) Data Collection (ii) Performance Analysis and (iii) Result Analysis.
4.1 Data Collection
It is the procedure for considering and calculating data on target classes in a developed systematic analysis, which then enables, one to answer reliable questions and calculate results. In proposed method for the classification process we have utilized a train process and test process. Total images extracted 3600. In training phase, we have used 2400 images such as 1200 non-cancer and 1200 cancer images and left 1200
images are utilized for test purpose. The dataset collected from online repository site such as T1, T2, T1C and Flair categories of MRI images shown in table 2 and 3. The dataset is collected form BRATS website[27].
4.2 Performance Metrics
In this section, after the defined set of MRI Images are trained, during the test stage, cancer and non-cancer MRI brain images are classified. The calculated results are achieved through calculation metrics name are; (i) Accuracy Rate (ii) Specificity (iii) Specificity. True Positive Rate means Sensitivity is the probability that a diagnostic test analysis is positive defined that the person has the brain disease. True Negative Rate means sensitivity is the probability that the diagnostic test analysis is negative, offered that the person doesn’t have the brain disease. Accuracy rate is calculate which determines the
probability about how many consequences are accurate classified and detected.
Accuracy Rate= (Tn+Tp)/(Tn+Tp+Fn+Fp)
……(2)
Specificity= Tn/(Tn+Fp)
……(3)
Sensitivity= Tp/(Tp+Fn)
……(4)
Hence, Tp full form for True Positive which is utilized to define the complete no of cancer sections accurately detected, Tn full form for True Negative which is utilized to define the non-cancer cases accurately classified, Fp is False Positive which is used to define the indicate incorrectly classified non
cancer cases when they are accurately cancer sections and Fn is False Negative which is to define inaccurately classified cancer sections, when they are real sections. These result metrics are evaluated expending the complete no. of MRI brain image of samples studied for the classification and detection.
TABLE2 TOTAL DATASET
Total Images Dataset
Cancer Non Cancer Images 3600 2400 1200
TABLE3
MRIBRAIN DATASET HIGHGRADE AND LOWGRADE CLASSIFICATION
Categories Training Dataset (HG)
Training Dataset (LG)
Testing Dataset (HG)
Flair 300 300 300 T1 300 300 300
57 IJSTR©2020
4.3 Results Analysis
The Brain MRI image classification performance metrics found after the executing the method for all the images are;
TABLE4
CLASSIFICATION USING NNACCURACY PARAMETER VALUES
Parameters Values % Tn 241 Fn 39 Tp 259 Fp 48
TABLE5
PROPOSED METHOD PERFORMANCE METRICS (ACCURACY, SPECIFICITY AND SENSITIVITY)
Parameters Values Accuracy Rate (%) 85.18% Specificity (%) 84.36% Sensitivity (%) 86.91%
After the calculation of proposed results, we have compared the proposed results with existing methods using their classification accuracy. The Proposed method attained a classification accuracy rate 85.18%, Sensitivity 86.91% and Specificity value is 84.36%. The results have been defined in Table 4, 5.
TABLE6
COMPARISON ANALYSIS
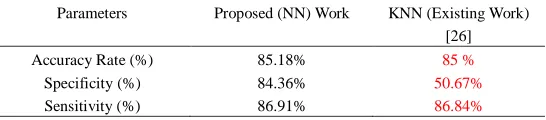
Parameters Proposed (NN) Work KNN (Existing Work) [26] Accuracy Rate (%) 85.18% 85 % Specificity (%) 84.36% 50.67% Sensitivity (%) 86.91% 86.84%
The figure 6 shows the comparison between NN proposed and existing method (KNN) with different parameters such as accuracy, specificity and sensitivity. In research method, we have achieved the maximum accuracy rate and specificity between all the others. The specificity of proposed method is also close about the other BRAIN TUMOR DETECTION system.
6 C
ONCLUSION ANDF
UTURES
COPEThe proposed work has defined a technique for classification the cancer and non-cancer MRI pictures. Firstly, MRI image is read by the classification system, the MRI image brain pre-processing and Extract the features and classification is completed. In this pre-processing phase, Grayscale conversion, binarization, wavelet and region of interest calculated. In feature extraction phase, evaluated the unique properties of the uploaded or trained images and feature set namely; (i) Minor and Major axis length (ii) Eccentricity (iii) Roundness (iv) Diameter etc. After that the research work with NN classification method with the effective method to
classifies the cancer and non-cancer brain images. It is proposed in MATLAB simulation tool used. The result and performance of the various layers of classification scheme in terms of accuracy rate, specificity and sensitivity is calculated. The results analyzed that the research system yielded superior performance when the comparison with other methods. It additional described that the proposed NN classification method is a capable method for image classification in a health application and it could be utilized in CAI health-care network. The proposed method has been calculated for its classification accuracy after execution the procedure for the large sum of information (MRI brain images). Experimental analysis showed that the research method attained a classification accuracy rate 85.18%, Sensitivity 86.91% and Specificity value is 84.36%. The future scope will main focus on enhancing the true positive rate and processing time optimizing. For further accurate classification methods, more valuable features can be searched out. Secondly, the automatic analysis can be CAI health-care system. This automatic scheme can be future use for the organization of MRI medical brain images with various kinds of conditions, illness status etc.
R
EFERENCES[1] Qurat-Ul-Ain, G. L., Kazmi, S. B., Jaffar, M. A. and Mirza, A. M. (2010), ―Classification and segmentation of brain tumor using texture analysis,‖ Recent advances in artificial intelligence, knowledge engineering and data bases, 147-155.
[2] Ain, Q., Jaffar, M. A. and Choi, T. S. (2014), ―Fuzzy anisotropic diffusion based segmentation and texture based ensemble classification of brain tumor,‖ applied soft computing, 21, 330-340.
[3] Khened, M., Kollerathu, V. A.and Krishnamurthi, G. (2019), ―Fully convolutional multi-scale residual DenseNets for cardiac segmentation and automated cardiac diagnosis using ensemble of classifiers,‖ Medical image analysis, 51, 21-45.
[4] Huda, S., Yearwood, J., Jelinek, H. F., Hassan, M. M., Fortino, G. and Buckland, M. (2016), ―A hybrid feature selection with ensemble classification for imbalanced healthcare data: A case study for brain tumor diagnosis,‖ IEEE access, 4, 9145-9154. [5] Rafiqul Islam, Shah Imran, Md. Ashikuzzaman, Md. Munim Ali
Khan (2020), ―Detection and Classification of Brain Tumor Based on Multilevel Segmentation with Convolutional Neural Network‖ J. Biomedical Science and Engineering, Vol. 13, (No. 4), pp: 45-53.
[6] Usman, K and Rajpoot, K. (2017), ―Brain tumor classification from multi-modality MRI using wavelets and machine learning,‖ Pattern Analysis and Applications, 20(3), 871-881. [7] Islam, A., Reza, S. M. and Iftekharuddin, K. M. (2013),
―Multifractal texture estimation for detection and segmentation of brain tumors,‖ IEEE transactions on biomedical engineering, 60(11), 3204-3215.
[8] Iftekharuddin, K. M., Ahmed, S. and Hossen, J. (2011), ― Multiresolution texture models for brain tumor segmentation in MRI,‖ In 2011 Annual International Conference of the IEEE Engineering in Medicine and Biology Society (pp. 6985-6988). IEEE.
58 IJSTR©2020
combination of multiple classifiers,‖ Australasian physical & engineering sciences in medicine, 38(2), 241-253.
[10]Wels, M., Carneiro, G., Aplas, A., Huber, M., Hornegger, J and Comaniciu, D. (2008), ― A discriminative model-constrained graph cuts approach to fully automated pediatric brain tumor segmentation in 3-D MRI,‖ In International Conference on Medical Image Computing and Computer-Assisted Intervention (pp. 67-75). Springer, Berlin, Heidelberg.
[11]Kaur, T., Saini, B. S. and Gupta, S. (2017), ―Quantitative metric for MR brain tumor grade classification using sample space density measure of analytic intrinsic mode function representation,‖ IET Image Processing, 11(8), 620-632.
[12]Viswanath, S. and Madabhushi, A. (2012), ―Consensus embedding: theory, algorithms and application to segmentation and classification of biomedical data,‖ BMC bioinformatics, 13(1), 26.
[13]Yasmin, M., Sharif, M., Mohsin, S. and Azam, F. (2014), ―Pathological brain image segmentation and classification: a survey,‖ Current Medical Imaging, 10(3), 163-177.
[14]Azmi, R., Pishgoo, B., Norozi, N and Yeganeh, S. (2013), ―Ensemble semi-supervised frame-work for brain magnetic resonance imaging tissue segmentation,‖ Journal of medical signals and sensors, 3(2), 94.
[15]Kumar, B. S. and Selvi, R. A. (2015), ―Feature extraction using image mining techniques to identify brain tumors,‖ In 2015 International Conference on Innovations in Information, Embedded and Communication Systems (ICIIECS) (pp. 1-6). IEEE.
[16]Shergalis, A., Bankhead, A., Luesakul, U., Muangsin, N., and Neamati, N. (2018), ―Current challenges and opportunities in treating glioblastoma,‖ Pharmacological reviews, 70(3), 412-445. [17]Shree, N. V. and Kumar, T. N. R. (2018), ―Identification and
classification of brain tumor MRI images with feature extraction using DWT and probabilistic neural network,‖ Brain informatics, 5(1), 23-30.
[18]Basheera, S. and Ram, M. S. S. (2019), ―Classification of brain tumors using deep features extracted using CNN,‖ In Journal of Physics: Conference Series (Vol. 1172, No. 1, p. 012016). IOP Publishing.
[19]Chavan, N. V., Jadhav, B. D and Patil, P. M. (2015), ―Detection and classification of brain tumors, ―International Journal of Computer Applications, 112(8).
[20]Sundararaj, G. K. and Balamurugan, V. (2014), ― Robust classification of primary brain tumor in Computer Tomography images using K-NN and linear SVM,‖ In 2014 International Conference on Contemporary Computing and Informatics (IC3I) (pp. 1315-1319). IEEE.
[21]Das, S., Aranya, O. R. R., & Labiba, N. N. (2019, May). Brain Tumor Classification Using Convolutional Neural Network. In 2019 1st International Conference on Advances in Science, Engineering and Robotics Technology (ICASERT) (pp. 1-5). IEEE.
[22]Shakeel, P. M., Tobely, T. E. E., Al-Feel, H., Manogaran, G. and Baskar, S. (2019), ―Neural network based brain tumor detection using wireless infrared imaging sensor,‖ IEEE Access, 7, 5577-5588.
[23]Kaldera, H. N. T. K., Gunasekara, S. R.and Dissanayake, M. B. (2019), ― Brain tumor Classification and Segmentation using Faster R-CNN,‖In 2019 Advances in Science and Engineering
Technology International Conferences (ASET) (pp. 1-6). IEEE. [24]Gumaei, A., Hassan, M. M., Hassan, M. R., Alelaiwi, A. and
Fortino, G. (2019), ―A hybrid feature extraction method with regularized extreme learning machine for brain tumor classification,‖ IEEE Access, 7, 36266-36273.
[25]Saraswathi, V. and Gupta, D. (2019), ― Classification of Brain Tumor using PCA-RF in MR Neurological Images,‖ In 2019 11th International Conference on Communication Systems & Networks (COMSNETS) (pp. 440-443). IEEE.
[26]Anitha, V., &Murugavalli, S. (2016),‖ Brain tumor classification using two-tier classifier with adaptive segmentation technique‖, IET computer vision, 10(1), 9-17.Polytopes for Dynamic Collision Detection," IEEE Trans. Visualization and Computer Graphics, vol. 14, no. 1, pp. 1-12, Jan/Feb 2008, doi:10.1109/TVCG.2007.70405. (IEEE Transactions )
[27]BRATS dataset, Retrieved from