IMPLEMENTATION OF A MACHINE
LEARNING TECHNIQUE: STORE AND
PROCESS BIG DATA IN DISTRIBUTED
ENVIRONMENT OVER THE ARRAY OF
COMPUTERS
NANDINI MADINENI
Assistant Professor
Department of Electronics and Communication Engineering Golden Valley Integrated Campus
Angallu , India
CH.SIVASANKAR
Assistant Professor
Department of Computer Science and Engineering. Annamacharya Institute of Technology and Sciences
Tirupathi, India Abstract
Machine learning (ML) is a subdivision of information
science which explains with programming the frameworks
such that they mechanically learn and enhance with
practice. There are several machine learning methods
among one, to arrange elements or objects of a given
collection into groups based on the likeness between the
items called Clustering. For example, the applications
related to publishing online news grouping based on
articles published in the news using clustering. At present
we are breathing in an epoch where information is
available in profusion from various media sources like
internet, intranet, web etc. The information load has
increased to such heights that sometimes it becomes
difficult to manage our gadgets tiny mailboxes, predict the
dimensions of data and records of popular websites
maintenance information up to date. It is true where
unknown websites receives and maintains bulk information.
To analyze such huge data across the multiple networked
computer systems normally it depends on classical mining
algorithms to identify trends and draw conclusions.
However, the traditional machine learning techniques
which are implemented and run on legacy system
framework can be sufficiently productive to process
constrained datasets and give results in fast time, unless the
computational errands are keep running on numerous
machines circulated over the clusters of commodity of
computers.We propose a novel algorithm can be testing a
very big data processed with a new framework called
Mahout that allows us to break down a computation task
into multiple segments and run each segment on different
machines.The experiment results shows that with number
of records increases but it will not affect the system
performance and also it will gives good cluster quality.
Key Words: - Machine Learning, Clustering,
K-Means, Hadoop, Mahout,
I. INTRODUCTION
Due to the advances in scientific data collection methods, the volume and veracity of data have tremendous growth. Therefore it is virtually impossible to discover the useful information from such raw data by using the traditional database analysis techniques.Big Data includes huge volume, high velocity, and extensible variety of data [6]. The data in it will be of three types as structured data contains Relational data, Semi Structured data that having XML data. And Unstructured data that holds Word, PDF, Text, Media Logs.
datasets. Clustering is an unsupervised classification data mining technique that divides the dataset into homogenous groups based on some resemblance criterion [2].Many previous works [3-4] focus on only grouping the numerical data. Clustering the categorical data is an extremely complex assignment since there exists no characteristic relative request between all of the qualities. Machine learning is a branch of science that takes measures concerning with programming the frameworks such that they consequently learn and enhance with involvement. Here, learning implies perceiving and understanding the information and settling on shrewd choices in light of the provided information.
It is exceptionally hard to oblige to every one of the choices in light of every conceivable information. To handle this issue, calculations are produced. These calculations construct information from particular information and past involvement with the standards of insights, probability hypothesis, rationale, combinative streamlining, look, support learning, and control hypothesis.The developed algorithms form the basis of various applications such as, Language processing, Vision processing,, Forecasting (e.g., stock market trends), Pattern recognition, Games, Data mining, Expert systems and Robotics
Machine learning (ML) is a broad category and it is out of the scope of this paper to cover all its features. There are a few approaches to execute machine learning procedures, however the most ordinarily utilized ones are directed and unsupervised learning. Managed Learning:Supervised learning manages taking in a capacity from accessible preparing information. A directed learning calculation dissects the preparation information and produces a deduced work, which can be utilized for mapping new cases.Normal cases of administered learning include: messages as spam grouping, site pages marking in light of their substance, and acknowledgment voice designs. In the machine
learning administered learning calculations, for example, neural systems, Support Vector Machines (SVMs), and Naive Bayes classifiers. Mahout actualizes Naive Bayes classifier. Unsupervised: Unsupervised learning comprehends unlabeled information without having any predefined dataset for its preparation.
It is a great degree intense apparatus for breaking down accessible information and search for examples and patterns. Logical groups can be clustered with same input be usually used. Basic ways to deal with unsupervised learning incorporate partiotional and hierarchical where in partiotional methods follows the partional approaches and hierarchical methods approaches follows hierarchical approaches like bottom up(agglomerative) and top down(bottom up) , k-means, self-organizing maps, and Hierarchical clustering
The various leveled grouping calculations can be utilized to bunch the downright information, yet their quadratic time difficulty hampers its utilization. In this paper we implement and test the proposed k-means algorithm with the new frame work called Mahout to scale up the data with multiple clusters of commodity of computers.
The rest of the paper organized as follows Section 2, notations and proposed k-means algorithm. Section 3, pre processing data, Section 4, proposed algorithm presents how proposed k-means working with training data given. Section 5, presents how to interface proposed algorithm with Mahout Framework and section 6, explains how to draws results with graphs and final conclusion.
Notations and hypothesis used
A. Definition
For ease of convenience consider that „D‟ is a dataset i.e. D={d1,d2,……dN}, where each data attribute di , 1< i ≤N is described by „n‟ categorical attributes i.e di ={x1
i , x2
i,…x n
i
isolated groups called clusters, by minimizing the cost function as follows:
…… ………(1)
Subject to 0≤ xi,j ≤1, for 1< i ≤N,1< l ≤k………..(2)
Where „X’ is an k×N partition matrix, yi€Y is is a mean vector of categorical attribute set of lth cluster, that can be obtained from the most frequent categorical value of each attribute domain and dis(di,yi ) is a simple matching distance between ith data point and lth cluster, that is defined as follows:
……….(3)
In the next section we discuss of simple matching distance metric (3) with the help of given dataset given in Table 1 and then we present our new similarity coefficient in next section
Pre Processing Data
Cluster analysis or clustering is the task of grouping a set of objects in such a way that objects in the same group (called a cluster) are more similar (in some sense or another) to each other than to those in other groups (clusters)[1].
One of the most frequently used unsupervised algorithms is k-means. K-Means Clustering is exploratory data analysis technique. This is non-hierarchical method of grouping objects together.
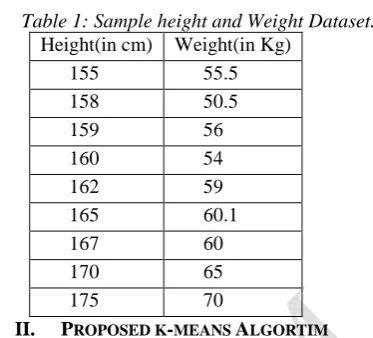
We have Height(H) set H={h1,h2,….hS} and Weight(W)set W={w1,w2…wT} information. Using these two variables, we need to group the objects based on height and weight information. If you look at the below table, you will expect that there are two visible clusters/segments and we want these to be identified using k- means algorithm.
Table 1: Sample height and Weight Dataset. Height(in cm) Weight(in Kg)
155 55.5
158 50.5
159 56
160 54
162 59
165 60.1
167 60
170 65
175 70
II. PROPOSED K-MEANS ALGORTIM
Give us a chance to take the info informational index with matched properties like{Name, age, stature, weight,… … ..}
={t1,t2,t3,t4,… … ..tn}… … .(4)
Select starting centroid esteems as m1 and m2 and furthermore pick last outcome framework accepted to invalid then the accompanying will be the proposed k-implies bunch.
Stage 1: Select information informational index as D={d1,d2,… … dN}
Stage 2: Initialize specific centroids as K={k1,k2,..kn}
Stage 3: Calculate nearest information variable from with its underlying centoid information esteems as shut distanc CD as takes after: (5)
Where
XH: Observation estimation of H
Hello there: Centroid estimation of ith st Cluster variable H
XW: Observation estimation of variable W Wi: Centroid estimation of ith Cluster
Stage 4: Move on to Next record or perception re compute shut separation with current record to past records what's more, refresh Centroid esteems and select least among the centroid esteems for advance counts
Stage 5: Repeat Step 3 and 4 until the point that no records found
Stage 6: Update the Result grid
By applying the above calculation to the given whole dataset we get the advancing outcomes will be delivered. Give us a chance to consider above Table 1 information we apply our proposed calculation as takes after:
At first accepted centroids and mean esteems are(h1,w1) and (h2,w2) as(155,55.5) and (158,50.5), Let us take beginning groups are(k1,k2) ,at that point next by applying k-implies we get the accompanying outcomes.
k=1, mean esteems are (155, 55.5) k=2, mean esteems are (158, 50.5)
From bunch 1 to group 2 and the other way around the refreshed bunch are as per the following
(k1,k2)=min(0,5.83)=0 then initially record has a place with k1,
(k1, k2)=min(5.83, 0)=0 at that point second record has a place with k2 then the refreshed bunches are as per the following
Table2: Initial Centroids and Cluster Assignment CD from Cluster1 CD from Cluster2 Assignment
0 5.83 1
5.83 0 2
III. INTERFACING PROPOSED ALGORITHM WITH
MAHOUT
HADOOP 1.0 HADOOP.20
A. Starting Hadoop:
Mahout works with Hadoop, hence make sure that the Hadoop server is up and running.
#cd HADOOP_HOME/bin #start-all.sh
B. Preparing Input File Directories:
Create directories in the Hadoop file system to store the input file, sequence files, and clustered data using the following command:
# hadoop fs -p mkdir /mahout_data # hadoop fs -p mkdir /clustered_data # hadoop fs -p mkdir /mahout_seq
We can verify whether the directory is created using the hadoop web interface in the following URL http://localhost:50070/It gives you the output as shown below:
C. Copying Input File to HDFS:
Put the input data file from the local(Linux) file system to mahout data directory in the Hadoop File System as shown below. Assume that the input file is sampledata.txt and it is in the /home/Hadoop/data/ directory.
# hadoop fs -put /home/Hadoop/data/mydata.txt /mahout_data/
D. Preparing the Sequence File:
Mahout provides you a utility to convert the given input file in to a sequence file format. This utility requires two parameters.
1. The input file directory where the original data resides.
2. The output file directory where the clustered data is to be stored.
Step 1: Browse to the Mahout home directory. You can get help of the utility as shown below:
[Hadoop@localhost bin]# ./mahout seqdirectory --help
Job-Specific Options:
--input (-i) input Path to job input directory.
--output (-o) output The directory pathname for output.
--overwrite (-ow) If present, overwrite the output directory
Generate the sequence file using the utility using the following syntax:
mahout seqdirectory -i <input file path> -o <output directory>
Example:
mahout seqdirectory
-i hdfs://localhost:9000/mahout_seq/ -o hdfs://localhost:9000/clustered_data/
Creating Vector Files
Unlike Canopy algorithm, the k-means algorithm requires vector files as input, therefore we have to create vector files. To generate vector files from sequence file
format, Mahout provides
the seq2parse utility.
Given below are some of the options of seq2parse utility. Create vector files using these options.
#MAHOUT_HOME/bin/mahout seq2sparse
--analyzerName (-a) analyzerName The class name of the analyzer
--chunkSize (-chunk) chunkSize The chunkSize in MegaBytes.
--output (-o) output The directory pathname for o/p --input (-i) input Path to job input directory.
After creating vectors, proceed with k-means algorithm. The syntax to run proposed k-means job is as follows:
mahout kmeans -i <input vectors directory> -c <input clusters directory>
-o <output working directory> -dm <Distance Measure technique> -x <maximum number of iterations> -k <number of initial clusters>
K-implies bunching work requires input vector register, output cluster registry, remove measure, greatest number of cycles to be done, and a whole number esteem speaking to the quantity of groups the information is to be separated into k-ways.
E. Data flow for Cluster setup:
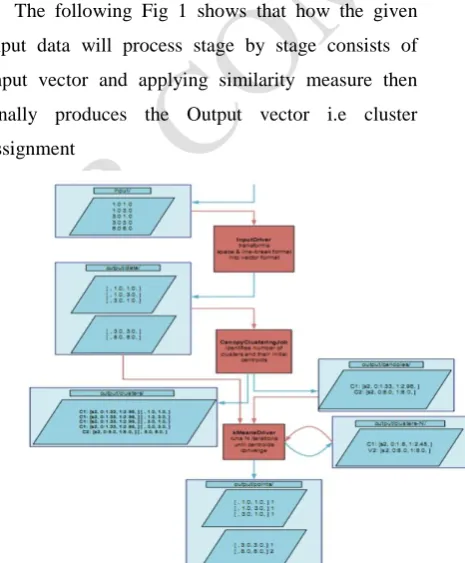
The following Fig 1 shows that how the given input data will process stage by stage consists of Input vector and applying similarity measure then finally produces the Output vector i.e cluster assignment
Fig 1:Data flow diagram for proposed algorithm in Mahout
IV. PERFORMANCE ANALYIS AND CONCUSIONS
We test the implemented algorithm for the given sample dataset values contains variable like Height and Weight attribute set value.
cluster on CentOS virtual machine on our computer [8].
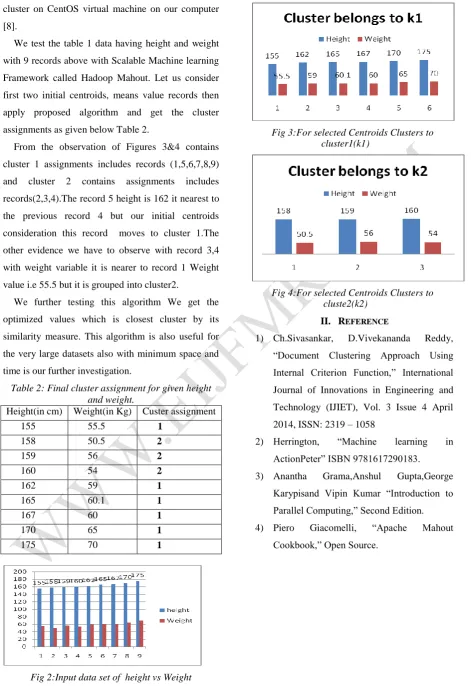
We test the table 1 data having height and weight with 9 records above with Scalable Machine learning Framework called Hadoop Mahout. Let us consider first two initial centroids, means value records then apply proposed algorithm and get the cluster assignments as given below Table 2.
From the observation of Figures 3&4 contains cluster 1 assignments includes records (1,5,6,7,8,9) and cluster 2 contains assignments includes records(2,3,4).The record 5 height is 162 it nearest to the previous record 4 but our initial centroids consideration this record moves to cluster 1.The other evidence we have to observe with record 3,4 with weight variable it is nearer to record 1 Weight value i.e 55.5 but it is grouped into cluster2.
We further testing this algorithm We get the optimized values which is closest cluster by its similarity measure. This algorithm is also useful for the very large datasets also with minimum space and time is our further investigation.
Table 2: Final cluster assignment for given height and weight.
Height(in cm) Weight(in Kg) Custer assignment
155 55.5 1
158 50.5 2
159 56 2
160 54 2
162 59 1
165 60.1 1
167 60 1
170 65 1
175 70 1
Fig 2:Input data set of height vs Weight
Fig 3:For selected Centroids Clusters to cluster1(k1)
Fig 4:For selected Centroids Clusters to cluste2(k2)
II. REFERENCE
1) Ch.Sivasankar, D.Vivekananda Reddy, “Document Clustering Approach Using Internal Criterion Function,” International Journal of Innovations in Engineering and Technology (IJIET), Vol. 3 Issue 4 April 2014, ISSN: 2319 – 1058
2) Herrington, “Machine learning in ActionPeter” ISBN 9781617290183. 3) Anantha Grama,Anshul Gupta,George
Karypisand Vipin Kumar “Introduction to Parallel Computing,” Second Edition. 4) Piero Giacomelli, “Apache Mahout