www.orientjchem.org
An International Open Free Access, Peer Reviewed Research Journal
2016, Vol. 32, No. (1): Pg. 627-635
Fabrication A Composite Electrode Based on
MWCNT/Zeolite for Potentiometric Determination of
Chromium (III)
ZAHRA HEIDARI, MAHBOUBEH MASROURNIA* and RAZEA SANNAVII KHOSHNOOD
Department of Chemistry, Faculty of Sciences, Mashhad Branch, Islamic Azad University, Mashhad, Iran.
*Corresponding author E-mail:[email protected]
http://dx.doi.org/10.13005/ojc/320171
(Received: November 12, 2015; Accepted: February 23, 2016)
ABSTRACT
A nanocomposite based on carbon paste electrode fabricated, by using zeolite as ion carrier .Functional multi-wall carbon nanotube was used for improvement of electrode response. The optimal composition of CPE was built from 65% graphite powder, 20 wt% paraffin oil, 5% ion carrier (zeolite), 10% MWCNTs. Electrode showed Nernstian response 19.88 (±0.2)mVdecade”1 in the measuring
range 10"7–10"2 mol L”1 and showed detection limit of 6.3×10⁻⁷ M. The sensor was successfully used
for potentiometric titration Cr3+ with EDTA. The carbon paste electrode showed fast response time,
good selectivity and applicable in the wide pH range of 3 -10.
Key words: Sensor, Ion Selective Electrode, Multi-Walled Carbon Nanotubes, Potentiometry, Zeolite
INTRODUCTION
In the first decade of the nineteenth century, chromium used as a component of paints, but now its main application is (85%) for the manufacture of stainless steel and electroplating with chromium and the remainder used in chemical industries, refractory and foundry industries. With development of use of chromium compounds in various industries like leather, paint, coating metals and steel industry as well as its entering to the environment through waste factories, toxic effects have been observed on human health. 1-4.
response, simple instrumentation, wide linear range, reasonable selectivity, low cost5-12.
Carbon paste electrodes, are one of the latest of the ion-selective electrodes, are consideration of, because of improvements of some factors, such as lower detection limits, the low ohmic resistance, renewability, stable response, no need for internal solution. This kind of sensor consists of a combination of ionophore, paraffin oil, graphite powder and sometimes a matter of modifier13-19.
Multi-wall carbon nanotube is one of the most active studied material in the manufacture of carbon paste electrodes because of its unique structure and physical properties such as, Ultra-light weights, high mechanical strengths, high electrical conductivities, high thermal conductivities, metallic or semi-metallic behaviors and high surface areas. Combination of the unique properties of carbon
nanotubes into materials with high potential was caused their various applications. They improve dynamic range and reduce response time20-32.
Zeolites are crystalline and hydrate aluminasilicates with tetrahedral structure that make up from an endless three-dimensional network from tetrahedral SiO44-.and AlO
45- that are connected
together with oxygen atoms. Zeolites as Natural resin have properties removal of anionic pollutant and cationic exchange. After identifying unique physicochemical properties of zeolites, they attracted the attention of many researchers. Structure and chemical compound of natural zeolites and their modified form are potential sources of various researches. They are used as ion exchanger, catalyst and influence in adsorption and desorption of ions. Zeolites are attention due to the adsorption properties and porous structure and applied in the manufacture of sensors. Zeolite apply in different
Table 1: The slope and r2 for plot of potential, versus,
the logarithm of the concentration of some cations
M Cr3+ Cd2+ Ni2+ Fe3+ As3+ Al3+ cu2+ co2+ Mn6+
slope 20.14 34 27.37 17.77 17 15.65 26.22 27.48 8.8 (mVdecad-1)
R2 0.996 0.996 0.996 0.992 0.994 0.996 0.992 0.995 0.998
0 0 0 0 0 0 0 0 0
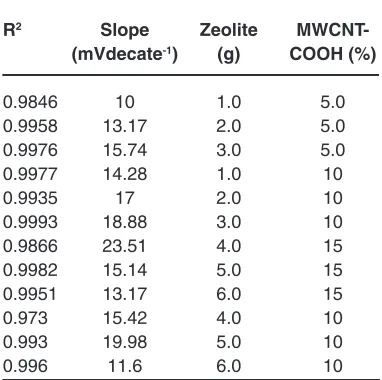
Table 2: Investigation of the optimal amount of carbon nanotube powder for carbon
paste electrode.
R2 Slope Zeolite
MWCNT-(mVdecate-1) (g) COOH (%)
0.9846 10 1.0 5.0
0.9958 13.17 2.0 5.0
0.9976 15.74 3.0 5.0
0.9977 14.28 1.0 10
0.9935 17 2.0 10
0.9993 18.88 3.0 10
0.9866 23.51 4.0 15
0.9982 15.14 5.0 15
0.9951 13.17 6.0 15
0.973 15.42 4.0 10
0.993 19.98 5.0 10
0.996 11.6 6.0 10
industries because of having cation exchange, molecular sieve, acidity and catalytic properties. The most Natural zeolites include clinoptilolite, Mordenite,
phillipsite, analcime and the synthetic zeolite include
X, Y, F, W, LA. Zeolite ion exchange properties are dependent upon the chemical structure of the zeolite, and change with structure and nature of the zeolite. Ion exchange capacity of the cation is dependent on the number of locations interchangeable. Cavities in zeolites make selective absorption of a specific ion or molecule in the presence of the other. They are abundant and cheap materials33-35.
In this article, we built a nano-composite carbon paste electrode for determination of Cr3+ and
ExPERIMENTAL Chemicals
Graphite powder with a <50µm particle size (Merck) and paraffin oil (Aldrich) was used for the preparation of the carbon paste electrode. The multi-walled carbon nanotubes (MWCNTs) with 10-40 nm diameters, 1-25 µm length was purchased from Research Institute of Petroleum Industry (Iran). The nitrate salts of the cations were purchased from Merck Co. Deionized water was used for preparing all of the solutions. The natural Clinoptilolite zeolite was obtained from IRAN (FERDOWS CITY) result of elemental analysis of a natural Clinoptilolite zeolite show (SiO2 63.37%, MnO 0.02%, Al2O3 10.71%, CaO 1.69%, Na2O 4.09%, P2O5 0.05%, MgO 1.20%, Fe2O3 2.15%, K2O 2.00%, SO3 0.53%, TiO2 0.34%, LOI 12.87%.
Instruments
The electrochemical cell contained, a calomel (Azar electrode) as a refrence electrode and the chromium (III) sensor as the indicator electrode .The Schematic figure is as follows:
Carbon paste electrode | sample solution | Cl-(4M) %Hg
2Cl2(s) %Hg (l) %Pt. After EMF is
calculated, calibration curve is drawn by plotting potential, versus the logarithm of the concentration of the chromium ion.
Functionalization of nanotubes
The amount of the carbon nanotube with a certain amount of nitric acid and sulfuric acid was refluxed for 4 hours at 120 to 140 ° C. Materials produced was filtered by the Millipore filter and vacuum pumps and was washed with distilled water until complete neutralization of the leach solution.
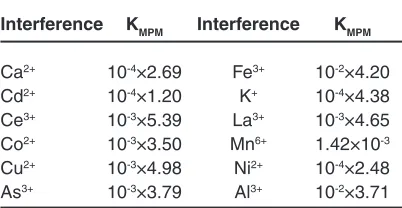
Table 3: The selectivity coefficients of various interfering cations for the Cr3+ electrode
Interference KMPM Interference KMPM
Ca2+ 10-4×2.69 Fe3+ 10-2×4.20
Cd2+ 10-4×1.20 K+ 10-4×4.38
Ce3+ 10-3×5.39 La3+ 10-3×4.65
Co2+ 10-3×3.50 Mn6+ 1.42×10⁻³
Cu2+ 10-3×4.98 Ni2+ 10-4×2.48
As3+ 10-3×3.79 Al3+ 10-2×3.71
Table 4: Lifetime of Cr (III) nano-composite CPE
Time Week 2 Week 4 Week 8
Slope(mVdecate-1) 18.40 19.17 19.88
R2 0.9980 0.9960 0.9980
0 0 0
After drying it, using the IR spectrum was assessed the created functional groups.
Carbon paste electrode preparation
Desired amount of Zeolite, graphite powder, paraffin oil and functionalized nanotubes were thoroughly mixed and then transferred into a glass tube with i.d. 5mm and a height of 3cm. After the mixture homogenized, to avoid the formation of air gaps, the paste was packed carefully in to the tube. This can prevent an increased in the electrical resistance of the electrode .Then Electrical contact was made by inserting a copper wire in to the opposite end. The working surface of the electrode was polished by using soft abrasive paper.Then, the electrode was conditioned for 24h by being soaked in a 1.0×10⁻³ mol L-1 of Cr (NO
3)3 solution36-39.
RESULTS AND DISCUSSION
Potential response of the electrode
To study the selectivity behavior of designed electrode, clinoptilolite zeolite was employed as a sensing element in preparation of some carbon paste electrodes. Zeolites have regular channels and holes that have been filled by cations and water molecular. Existing cations were mobile, and can replace with other cations. Also, existing cations in the pores of zeolite can interact with some polar molecular and attract them in its external surface. Existing water molecular in zeolite network can go out of network, continuously and reversibility. After preparing of carbon paste electrode, the selectivity of the designed electrode was tested against the some cations. Electrodes were used for solution of 1×10⁻¹ M to 1×10⁻⁷ M of the nitrate salt of the cations.
Potential was measured and plotted against the logarithm of the concentration of the ions. Results are shown in Table 1. According to data, Cr3+ shows
Optimization of CPEs
Ion carrier is a key element in the sensor, which has main role in determining of the selectivity of the membrane. It binds with certain ion. In this paper, we used Clinoptilolite zeolite as an ion carrier Clinoptilolite is a natural zeolite and has high ion exchange property, and its abundant resources are attentional in our country. High ion exchange capacity of Clinoptilolite cause that can remove heavy ions from contaminated water.
Also we used MWCNT-COOH as modifier in CPE. We know, that MWCNT cause to increase conductivity of the sensor and transduction of the chemical signal to electrical signal. As a result, dynamic working range and response time of the sensor improved, and the potential response of the sensor improves to Nernstian values. As well as, reaction acid with frame and unsymmetrical end of nanotube cause to open its end and was created functional group in breakage location on wall, that this method cause to increase solubility of nanotube and purification nanotube from amorphous carbon. By the way the toxicity of nanotubes are reduced. As a result of a more nanotube sit on surface of electrode
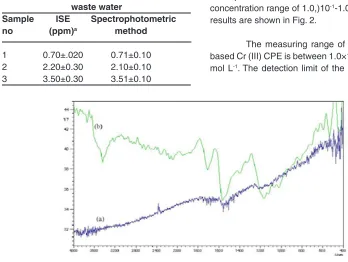
Table 5: Determination of Cr3+ in
waste water
Sample ISE Spectrophotometric no (ppm)a method
1 0.70±.020 0.71±0.10
2 2.20±0.30 2.10±0.10
3 3.50±0.30 3.51±0.10
and more analyte is attracted towards surface of electrode and are provided stronger interaction with the analyte. An important method for the detection of functionalized MWCNT is FT-IR spectrum. As can be seen, in Fig 1, the spectrum of nanotubes haven’t any specific functional group except C=C absorption band But in the absorption spectrum of functional nanotube, absorption of hydroxyl group is seen in 3000-3500 cm-1 and absorption of carbonyl group is
seen in 1650-1800 cm-1.
After we optimized amount of ion carrier and MWCNT with one variable at the time method. Results are shown at Table 2.
It can be seen from Table 2, that an electrode with composition of 5% zeolite, 10% MWCNT, 65% graphite powder, 20% paraffin oil was chosen as the optimum composition, showing a Nernstian slope of 19.98±0.2 mV decade-1
Calibration curve
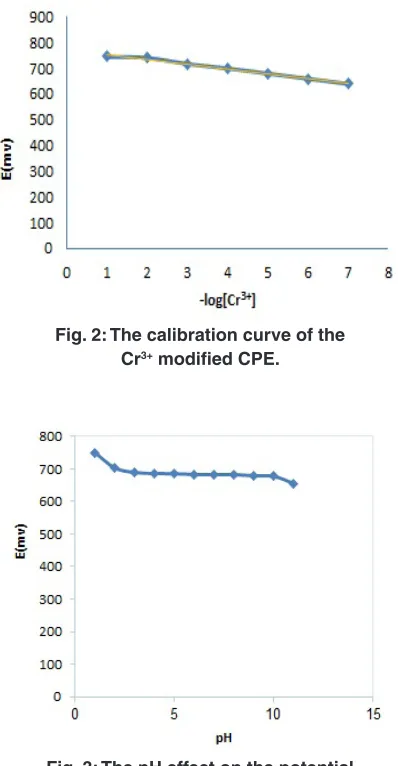
The measurement range of an ISE is defined as the upper and lower detection limits, that in the range, response of the electrode obeys of nernst equation38-40. The response of the electrode
with optimal combination was tested in Cr (III) ion concentration range of 1.0,)10-1-1.0,)10-7 M and the
results are shown in Fig. 2.
The measuring range of nano-composite based Cr (III) CPE is between 1.0×10⁻⁷ and 1.0×10⁻²
mol L-1. The detection limit of the modified carbon
paste electrode was 6.3 × 10⁻⁷ mol L-1 which was
calculated by the extrapolating of the linear portion of the calibration curve in Fig.2.
Effect of pH
In order to evaluate the effect of pH on the potential response of the sensor, the potentials were measured for 1.0×10⁻³ mol L-1 of Cr3+ solution
with different pH values. The pH varied by addition of HNO3 or KOH. The potential was plotted versus; pH in Fig. 3. The composition of the electrode was kept constant in all experiments. The results display the potential of electrode is constant between pH (3–10) in Fig.3. Decrease in potential in above the pH value of 10.0 is because of formation of Cr3+ ion
hydroxyl complexes in the solution. And decrease in
Fig. 2: The calibration curve of the Cr3+ modified CPE.
Fig. 3: The pH effect on the potential response of the Cr3+ modified CPE
potential below the pH value of 3.0 was related to the partial protonation of the zeolite41-42.
In another experiment, the values of E (mV) were examined for Cr3+ solution with a concentration
of 1.0,)10-1-1.0,)10-7 M in the pH (2, 4, 6). The result
shown, pH has no effect on potential response. But the best slope was recorded for pH (2).
Response time
Response time of an electrode is one of the important factors for every ISE. Response time of an electrode is obtained through measuring the average time after its immersion in a series of solutions of the target ions, each having a ten-fold concentration difference43. At this stage experiments, time
response for the mentioned sensor was investigated by changing the Cr3+concentration from1.0×10-7 to
1.0×10⁻² mol L-1 and the results showed that the
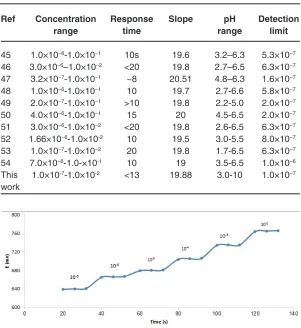
response time of the electrode was less than 13 s (Fig 4)
Interference studies
Selectivity of electrode is ability of electrode to detect the target ion of other ions (interfering ions) and is expressed in terms of selectivity coefficients. It determined by the matched potential method (MPM). According to this method, a specified activity (concentration) of main ions (A) is added to a reference solution and the potential is measured. In a separate experiment, interfering ions (B) are successively added to an identical reference solution, until the measured potential matches the one obtained before the addition of the primary ions. The matched potential method selectivity coefficient,
KMPM, is then given by the resulting main ion to interfering ion activity (concentration) ratio, KMPM =aA/aB. aA, is main ion activity(concentration). aB, is interfering ion activity (concentration)44. The results
are shown in Table 3.
As can be seen, alkali, alkaline earth and transition metals don’t disturb the measurement of chromium with this electrode.
Life time
Table 6: Comparison of proposed electrode with other Cr3+
selective electrode
Ref Concentration Response Slope pH Detection range time range limit
45 1.0×10⁻⁶-1.0×10⁻¹ 10s 19.6 3.2–6.3 5.3×10⁻⁷
46 3.0×10⁻⁶–1.0×10⁻² <20 19.8 2.7–6.5 6.3×10⁻⁷
47 3.2×10⁻⁷-1.0×10⁻¹ ~8 20.51 4.8–6.3 1.6×10⁻⁷
48 1.0×10⁻⁶-1.0×10⁻¹ 10 19.7 2.7-6.6 5.8×10⁻⁷
49 2.0×10⁻⁷-1.0×10⁻¹ >10 19.8 2.2-5.0 2.0×10⁻⁷
50 4.0×10⁻⁶-1.0×10⁻¹ 15 20 4.5-6.5 2.0×10⁻⁷
51 3.0×10⁻⁶-1.0×10⁻² <20 19.8 2.6-6.5 6.3×10⁻⁷
52 1.66×10⁻⁶-1.0×10⁻² 10 19.5 3.0-5.5 8.0×10⁻⁷
53 1.0×10⁻⁷-1.0×10⁻² 20 19.8 1.7-6.5 6.3×10⁻⁷
54 7.0×10⁻⁶-1.0-×10-1 10 19 3.5-6.5 1.0×10⁻⁶
This 1.0×10⁻⁷-1.0×10⁻² <13 19.88 3.0-10 1.0×10⁻⁷
work
Fig. 4: The Dynamic response time of Cr3+-CP E ISEs in the range of 4 to 10 weeks. After this time
slope will be reduced and the detection electrode increases .in order to investigate the lifetime of the sensor, a series of experiments were performed using 3 electrodes for 10 weeks and after 8 weeks, slight decline in the electrode potential response was observed .So life time of the sensor was estimated 8 weeks.Results are shown in Table 4.
Analytical application
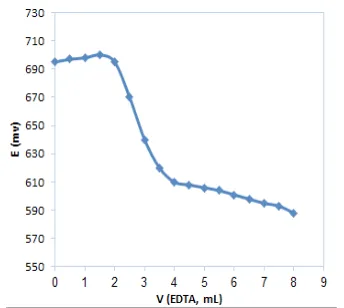
Fabricated electrode was used for detection of the end point of titration Cr3 + with EDTA. 50 ml of
solution of 1.0×10⁻⁴ M Cr3+ was titrated with solution
of 1.0×10⁻³ M EDTA. With addition of EDTA, potential
values reduced, because complex of Cr3 + with EDTA
formed, as a result, concentration of free Cr3 + ions
in solution decreased. Potential changes around of
the point of equivalent sharply, which represents behavior of sensor is successful to measure of Cr3 + in potentiometric titration .The curve is shown in
Fig.5.
The new Cr3 +-selective CPE was used
for determination of Cr3 +in waste water sample.
The method repeated five times, and results were recorded. Then Atomic Absorption Spectroscopy (AAS) was applied to determination of Cr3 + ion
pH range, response time and slope of these electrodes are given in Table 6. As can be understood from Table 6, the electrode in measurement of chromium ion is more successful than other reported electrodes because of having a wide measuring range the lower detection limit, fast response time, much wider pH range. Different Cations don’t interfere in measuring of Chrome with these electrode so this sensor is useful for determining of Cr3+.
CONCLUSION
In the present work, we used zeolite as selective ionophore for fabrication a nanocomposite CPE for determination of Cr3+. Electrode can use well
in range pH (3-10) with response time less than 13 s. The linear range for determination of Cr3+ with this
electrode is 1.0×10⁻⁷ - 1.0×10⁻² with nernstian slope
of 19.88 and detection limit of 6.3.0×10-7. Electrode
can used in the presence alkali, alkaline earth and transition metals without inconvenience.
REFERENCES
1. Emmanueul, S.; Adamu, I.; Ejila, A.; Ja’afaru, M.; Yabaya, A.; Habila, B. Journal of Toxicology
and Environmental Health Sciences. 2014, 6,
89-98.
2. Xu, X. R.; Li, H. B.; Gu,J. D.; Li, X. Y.
Environmental toxicology and chemistry.
2005, 24, 1310-1314.
3. Cheung, K.; Gu, J. D. Inter national
Biodeterioration & Biodegradation. 2007, 59,
8-15 .
4. Fernandes,H. M. Environmental Pollution.
1997, 97, 317-325.
5. Ali, T. A.; Aglan, R. F.; Mohamed, G. G.; Mourad, M. A. International Journal of Electrochemical
Science. 2014, 9, 1812-1826.
6. Ali, T. A.; Mohamed, G. G.; Azzam, E. M. S.; Abd-Elaal, A. A. Sensors and Actuators, B:
Chemical. 2014, 191, 192-203.
7. Ali, T. A.; Mohamed,G. G.; El-Dessouky, M. M. I.; El-Ella, S. M. A.; Mohamed,R. T. F. Journal
of Solution Chemistry. 2013, 42, 1336-1354.
8. Ali,T. A.; Eldidamony, A. M.; Mohamed,G. G.; Elatfy, D. M. International Journal of
Electrochemical Science. 2014, 9, 2420.
9. El-Hariri, T. Y. M. A.; Mousa, A. S.; Moustafa, T.
F.; Farouk, S. Egyptian Journal of Petroleum.
2012, 21, 71.
10. Ganjali, M. R.; Moghaddam, M. R.; Hosseini, M.; Norouzi, P. Int. J. Electrochem. Sci,
2011,6,1981-1990
11. Mohammadabadi, F.; Zamani, H. A.; Joz-Yarmohammadi, F. M.; Abedi, R. Int. J.
Electrochem. Sci. 2015, 10, 2791-2800.
12. Frag, E. Y. Z.; Ali,T. A.; Mohamed, G. G.; Awad, Y. H. H. International Journal of
Electrochemical Science.2012, 7, 4443.
13. Mohamed, G. G.; Ali, T. A.; El-Shahat, M. F.; Migahed, M. A.; Al-Sabagh, A. M. Drug Testing
and Analysis. 2012, 4, 1009.
14. Wang, Y.; Wei, W.; Zeng, J.; Liu, X. ; Zeng, X.
Microchimica Acta. 2008, 160, 253-260.
15. Javanbakht, M.; Badiei,A.; Ganjali, M. R.; Norouzi,P.; Hasheminasab,A.; Abdouss, M.
analytica chimica acta. 2007, 601, 172-182.
16. Javanbakht, M.; Ganjali, M. R.; Norouzi, P.; Badiei, A.; Hasheminasab, A.; Abdouss,M.
Electroanalysi. 2007, 19, 1307-1314.
17. Goyal, R. N.; Oyama, M.; Gupta, V. K.; Singh,S. P. ; Sharma, R. A. Sensors and Actuators B:
Chemical. 2008, 134, 816-821.
Fig. 5: The curve of titration Cr3+ with EDTA
Comparison of the proposed electrode (V) with literature precedents
18. Javanbakht, M.; Eynollahi- Fard, S.; Abdouss, M.; Mohammadi, A.; Ganjali, M. R.; Norouzi, P.; Safaraliee, L. Electroanalysis, 2008, 20, 2023-2030.
19. Rezaei, B.; Damiri, S.Sensors Journal, IEEE.2008, 8, 1523-1529.
20. Siswana, M.; Ozoemena, K. I.; Nyokong, T.
Sensors, 2008, 8, 5096-5105.
21. Li, G.; Xu, H.; Huang, W.; Wang, Y.; Wu, Y.; Parajuli, R.. Measurement Science and
Technology. 2008, 19, 065203-065209.
22. Bianco, A.; Hoebeke, J.; Godefroy, S.; Chaloin, O.; Pantarotto, D.; Briand, J. P.; Muller, S.; Prato, M.; Partidos, C. D. Journal of the
American Chemical Society. 2005, 127,
58-59.
23. Bianco, A.; Kostarelos, K.; Prato, M. Current
opinion in chemical biology. 2005, 9,
674-679.
24. Klumpp, C.; Kostarelos, K.; Prato, M.; Bianco,
A. Biochimica et Biophysica Acta
(BBA)-Biomembranes. 2006, 1758, 404-412.
25. Kostarelos, K.; Lacerda, L.; Pastorin, G.; Wu, W.; Wieckowski, S.; Luangsivilay, J.; Godefroy, S.; Pantarotto, D.; Briand, J. P.; Muller, S.
Nature nanotechnology, 2007, 2, 108-113.
26. Lacerda, L.; Bianco, A.; Prato, M.; Kostarelos,
K. Advanced drug delivery reviews2006, 58,
1460-1470.
27. Lacerda, L.; Pastorin, G.; Wu, W.; Prato, M.; Bianco, A.; Kostarelos ,K. Advanced
Functional Materials, 2006, 16, 1839-1846.
28. Pantarotto, D.; Singh, R.; McCarthy, D.; Erhardt, M.; Briand, J. P.; Prato, M.; Kostarelos, K.; Bianco, A.Angewandte Chemie. 2004, 116, 5354-5358.
29. Pastorin, G.; Wu, W.; Wieckowski, S.; Briand, J.-P.; Kostarelos, K.; Prato, M.; Bianco, A.
Chemical communications.2006,
1182-1184.
30. Singh, R.; Pantarotto, D.; Lacerda, L.; Pastorin, G.; Klumpp, C.; Prato,M.; Bianco, A.; Kostarelos, K.Proceedings of the National Academy of Sciences of the United States of
America. 2006, 103, 3357-3362.
31. Chou, A.; Böcking, T.; Singh, N. K.; Gooding, J. J. Chemical communications.2005, 7, 842-844.
32. Nezamzadeh-Ejhieh, A.; Mirzaeyan, E.
Electrochimica Acta. 2011, 56, 7749-7757
33. Nezamzadeh-Ejhieh, A. ; Afshari, E.
Microporous and Mesoporous Materials.2012,
153, 267-274
34. Nezamzadeh-Ejhieh, A.; Badri, A. Journal of
Electroanalytical Chemistry. 2011, 660,
71-79
35. Ali, T. A.; Mohamed, G. G.; Al-Sabagh, A.; Migahed, M. Chinese Journal of Analytical
Chemistry.2014, 42, 565 -572.
36. Ali, T. A.; Farag, A. A.; Mohammad, G.
G. Journal of Industrial and Engineering
Chemistry 2014, 20, 2394-2400.
37. Ali, T. A.; Eldidamony,A. M.; Mohamed, G. G.; Abdel-Rahman, M. A. Int. J. Electrochem. Sci
2014, 9, 4158-4171.
38. Ganjali, M. R.; Memari, Z.; Faridbod, F.; Dinarvand, R.; Norouzi, P. Electroanalysis.
2008, 20, 2663-2670.
39. Ganjali, M. R.; Norouzi, P.; Faridbod, F.; Yousefi, M.; Naji, L.; Salavati-Niasari, M.
Sensors and Actuators B: Chemical. 2007,
120, 494-499.
40. Gupta, V. K.; Jain, S.; Chandra, S. Analytica
chimica acta. 2003, 486, 199-203.
41. Ganjali, M. R.; Faridbod, F.; Norouzi, P.; Adib,
M. Sensors and Actuators B: Chemical. 2006,
120, 119-124.
42. Zamani, H. A.; Rajabzadeh, G.; Ganjali, M. R.
Sensors and Actuators B: Chemical. 2006 ,
119, 41-46.
43. Gupta, V. K.; Al Khayat, M.; Singh, A. K.; Pal, M. K. Analytica Chimica Acta2009, 634, 36-43.
44. Zamani, H. A.; Rajabzadeh, G.; Masrornia, M.; Dejbord, A.; Ganjali, M. R.; Seifi, N.
Desalination. 2009, 249, 560-565.
45. Gholivand, M. B.; Sharifpour, F. talanta. 2003,
60, 707-713.
46. Ghaedi, M.; Shokrollahi, A.; Salimibeni, A. R.; Noshad, S. , Joybar, S. Journal of Hazardous
Materials.2010, 178, 157-163.
47. Zamani, H. A.; Rajabzadeh, G.; Ganjali, M.
R. Sensors and Actuators B: Chemical 2006,
119, 41-46.
48. Kumar, P.; Sharma H. K. ,Electrochimica Acta
2013, 87, 925-929.
49. Gupta, V.; Jain, A.; Kumar, P.; Agarwal, S.; Maheshwari, G. Sensors and Actuators B:
Chemical. 2006, 113, 182 -186
60, 707-713.
51. Abbaspour, A.; Izadyar, A. Talanta. 2001, 53, 1009-1013.
52. G h o l i va n d , M . B. ; R a h e e d aya t , F.
Electroanalysis.2004, 16, 1330-1335.
53. Sharma, R. K.; Goel, A. Analytica Chimica