Malaysian Journal of Soil Science Vol. 20: 95-110 (2016) Malaysian Society of Soil Science
N
2O and CO
2Emissions From Arable and Grassland Soils
Under Various Moisture Regimes: A Microcosm Study
Shah, A.
1, 2,*and R. Gaebler
11 Institute of Soil Science and Land Evaluation, Biogeophysics (310),
University of Hohenheim, 70593 Stuttgart, Germany
2 Sindh Agriculture Research Institute, Tando Jam Pakistan
ABSTRACT
Greenhouse gas emissions have increased during the last century due to human activities such as agricultural practices, fossil fuel burning and industrial practices. However, the formation of greenhouse gases, in particular N2O or CO2 is strongly controlled by both soil temperature and soil moisture. A laboratory experiment was conducted to assess the response of grassland and arable soils with regard to N2O and CO2 flow and mineral nitrogen concentration; soils were exposed to various drying- rewetting cycles at different gravimetric water contents (θwt) under controlled conditions for a duration of 60 days. In total, four treatments were conducted: soils under continuously moist conditions (control) at 32% θwt; soils received short drying-rewetting cycles (SDWC) of between 32 to 21% θwt; soils exposed to medium drying rewetting cycles (MDWC) of between 32 to 18% θwt and a treatment with long drying-rewetting cycles (LDWC) of between 32 to 5% θwt. Short, medium and long drying-rewetting cycle treatments went through 6, 4 and 2 drying-rewetting cycles (DWC) (0.1, 0.07 and 0.03 drying-rewetting frequencies). Soil samples of arable and grassland soils were analyzed for NH4+
and NO3- at the different stages of incubation in order to compare changes over time. The results indicated that arable and grassland soils reduced N2O-N flow in the long drying-rewetting treatments. For the grass soil, the short drying-rewetting cycle treatment yielded the highest cumulative N2O-N flow (325 μg kg-1). In arable
soil, however, the long drying-rewetting cycles receiving treatment released 69% less N2O-N flow as compared to the other treatments. For the CO2-C flow, soils
showed differing patterns, with the shortly dried-rewetted cycle treatment of grassland soils yielding the highest (130 μg kg-1) cumulative flow that was 25%
higher than LDWC. Drying-rewetting cycles (DWC) on grass soils had no effect. The stressed treatments emitted only 19% higher CO2-C flow than the control. The treatment with 5% (θwt) successfully reduced N2O-N flow in grassland and arable soils. Soil net nitrogen mineralization (NNM) and nitrification (NNN) rates of arable soils were significantly higher than in grassland soils.
Keywords: Grassland soils, arable soils, N2O, CO2, moisture regimes.
INTRODUCTION
Soils are one of the major sources of atmospheric greenhouse gases, in particular CO2 (Raich et al., 2002) and 70 % of the total N2O emissions (Wei et al., 2010; Conrad 1996). N2O and CO2 are the consequences of microbial mediated processes, enhanced by physico-chemical characteristics of soil (Batjes and Bridges 1992) and land management practices (Ugalde et al., 2007). Nitrous oxide is very stable and persists in the atmosphere for approximately 120 years. It has a large global warming potential that is 296 times greater than CO2 in a 100-year period and is related to the catalytic destruction of the stratospheric ozone (Diz-Muñoz et al., 2010). Atmospheric CO2 concentration has increased by almost 100µL L-1 since
pre-industrial levels, reaching as high as 379μL L-1 in 2005. The mean annual
growth rate during 2000-2005 was higher than in the 1990s and will continue to rise in Europe, Caucasus and Central Asia by more than 40% until 2030 (IPCC, 2007).
Fierer et al., (2003) predicted that mineral soils are expected to receive long drying periods during summers in this century because of climate change (Muhr et al., 2008). Surface soils get more exposure to drying-rewetting events (Fierer and Schimel, 2002) and this have a significant impact on the microbial community (Smith et al., 2003) by providing physiological stress (Fierer et al., 2003).
Few studies have underlined how the frequency of stress events (drying-rewetting) control soil biochemical processes related to C and N cycles. Wang et al., (2010) indicated that the C mineralisation rate was not significantly affected by moisture. However, several reports suggest that repeated drying-rewetting has an effect on nitrogen and carbon turnover in the soil (Kruse et al., 2004; Butterly, 2008) and on the microbial community (Fierer and Schimel, 2002; Smith et al., 2003). Nitrifier activity may generally be sensitive to low moisture (Fierer and Schimel, 2002). Maximum N2O was emitted when soil was rewetted (Ruser et al., 2005), yet no differences between constantly moist (Beare et al., 1999) and frequently dried soils (Kruse et al., 2004) were found. Shortage of water can retard microbial activity by lowering intracellular water potential and in solid matrices by restricting substrate supply, leading to a decline in nitrification rates (Stark and Firestone, 1995). However, nitrification rates were found to increase in the soils that were exposed to soil drying for short periods (Fierer and Schimel, 2002; Kessavalou et al., 1998).
Nitrous oxide emissions are significantly affected by soil moisture during the wheat growing season (Liu et al., 2011). Normally, wheat crops require adequate irrigation and fertilisers during the entire growth period. High N fertilisation stimulates N2O emission by providing substrate as NH4+ and NO
3- for the
(Smith et al., 2003). Variability in moisture content can also affect respiration rates (Fierer and Schimel 2002). Thomson et al. (2010) detected significantly higher respiration rates in dried and rewetted microcosms.
Global circulation models indicate that an increase in global warming is due to C cycle feedbacks (Smith et al., 2003) because it is more sensitive to rewetting frequency than N (Miller et al., 2005). Its uptake and storage by plants can be increased through improved agricultural management practices (Haney and Haney, 2010). However, the influence of autotrophic or heterotrophic activity to changes in CO2 evolution is not verified yet (Kim et al., 2011); especially in grass soils which contain more labile carbon than annually cropped soils regardless of tillage regimes (Carpenter-Boggs et al., 2003).
However, the net N mineralization is considerably dominated by nitrification in grassland soils (Zhang et al., 1998) as seen in the higher N2O emission due to increased nitrification rates and organic C availability that is used as an energy source for heterogenous microorganisms. The influence of drying-rewetting frequencies on overall ecosystem nutrient budgets is still unclear. In this connection, an effort was made to quantify the impact of various drying-rewetting cycles (DWC) on grassland and arable soils, specifically in relation to CO2 and N2O emissions, NH4+ and NO
3- contents at different stages by means of
a microcosm experiment under controlled conditions.
MATERIALS AND METHODS
Soil Sampling
Two soils under different management practices were chosen for incubation, that is, grassland and arable soil from Heidfeldhof Research Station at the University of Hohenheim, 13 km south of Stuttgart, Germany (48° 43’ 00” N; 9° 11’ 40” E) where annual average temperature and total rainfall are 8.7°C and 685 mm, respectively. The soil is classified as Alfisols (USDA, 2010). Soil samples were taken from a depth of 0-15 cm by removing upper vegetation and then well integrated to ensure homogeneity. After sampling, soil was immediately transported to the laboratory and sieved through a 4 mm sieve (Thomson et al., 2010).
Experimental Setup
Soil weighing 130 g was packed into columns (100 cm3) resulting in a bulk density
of. 1.3 g cm-3. The soils were artificially saturated and adjusted to pF 1.8 i.e.
32% gravimetric water content (θwt) by weight through pressure plates (Loveday, 1974). After pF adjustment, soil cores were placed into microcosms (0.85l) and sealed with plastic lids containing rubber septa. In total, 80 microcosms were prepared. The microcosms were then transferred to a climate chamber, set at a constant temperature of 20°C in darkness for 60 days.
to multiple drying-rewetting cycles with target moisture content (Figures 2c, 4c, 5c and 6c). The control soil remained at constant moisture of 32% θwt. Treatments receiving short drying-rewetting cycles (SDWC) were exposed to six evenly distributed DWC; the soil was rewetted to 32% θwt after reaching a water content of 21% θwt; soils with medium drying-rewetting cycles (MDWC) were exposed to 15% θwt and brought back to 32% θwt, while soils with long drying-rewetting cycles (LDWS) were exposed to drying until 5% θwt and were rewetted back to their previous moisture state.
SDWC, MDWC and LDWC went through 6, 4 and 2 DWC i.e. 0.1, 0.07 and 0.03 drying-rewetting frequencies (drying-rewetting frequencies means the number of cycles in 60 days. Six drying-rewetting cycles are divided by 60 resulting in 0.1 drying-rewetting frequencies and so on).
All of the treatments received the final drying-rewetting cycles for a 2-month period. Soil drying was accomplished by removing the microcosm lids to allow for evaporation. Rapid rewetting was performed by dripping deionised water cautiously onto the soil surface with the use of a graduated syringe.
N2O and CO2 Flow Measurements
For measuring N2O and CO2 flows, the microcosms were tightly closed and a
rubber septum was fixed in the lid with a 2-way Luer-Lock valve. Gas sampling was carried out at 0-, 30- and 60-min time intervals by connecting the microcosm atmosphere to the vacutainer with a mounted septum, using a surgical syringe (Smith et al., 1995) and then stored in the evacuated vacutainers of 0.25 L volume.
To ensure the absence of N2O prior to gas sampling, all vacutainers were evacuated and rinsed with N2 thrice shortly before sampling to avoid contamination. Nitrous oxide and CO2 concentrations were analysed by N63 electron capture
detector (ECD) and flame ionisation detector (FID) respectively, using a gas chromatograph (AutoSystem XL Perkin Elmer) coupled with an auto-sampler. The instrumental conditions were as follows: oven temperature 65°C, ECD operation temperature 100-450°C, carrier gas for ECD and FID CH4/Ar (10%/90) and He (95%) respectively. Calibration was done with three external standards (0.0003, 0.0015 and 0.003 μl L-1 for N
2O and 400, 1500 and 3000 μl L-1 for CO2). Gas
flow rates were calculated by measuring the change of gas concentration in the headspace of the microcosm using linear regression. Cumulative flow rates were calculated by linear interpolation. To estimate cumulative N2O and CO2 flows throughout measuring period, sum curves were created by multiplying mean flow rates of two sequential gas flow rates with the consistent time period and summing up these time-weighted means afterwards as described by Goldberg et al., (2009).
Soil Analysis
in 1: 2.5 (soil:0.01 M CaCl2) using glass electrode pH meter. Soil mineral N (NH4+
and NO3-) was extracted in a 1 M KCl solution (soil/liquid ratio 1: 5 w/w) as
referred to by Keeney and Nelson (1982). The filtrates were then analysed on an automated flow injection analysis (Brann en LuebbeTrAAcs 800 Auto analyzer). Net nitrogen nitrification (NNN) mg kg-1 was calculated as final concentration
of NO3--N minus initial concentration of NO
3-. Likewise, net nitrogen
mineralisation (NNM) mg kg-1 was assumed as final concentration of NO 3- plus
NH4+, minus initial concentration of NO
3- plus NH4+.
Physico-Chemical Properties of Soil
The arable soil was cultivated with spring wheat (Triticum aestivum L. cv. Triso) and fertilised with 140 kg N, 60 kg K and 30 kg P ha-1. Arable soil contained 1.2%
total carbon (TC) and pH value of 6.5 (CaCl2). Grassland soil exhibited 2% TC and pH value of 6.0 (CaCl2), respectively.
Particle size distribution of the arable soil was 12.6% sand, 58% silt and 29.4% clay, while the grassland soil was 17.3% sand, 61.7% silt and 21% clay. Ammonium and NO3- contents of the soil before incubation were 5.3 and 6.1 mg
kg-1 for arable and 4.3 and 2.4 mg kg-1 for grassland soils, respectively.
Statistical Analysis
The experimental results were statistically evaluated by one way analyses of variance (ANOVA) using the software IBM SPSS Statistics Version 19. The least significant difference (LSD) test (α=0.05) was used to identify significant differences among treatments.
RESULTS
N2O Cumulative Flow
On a cumulative basis, the response of the grassland soils to frequent stress (SDWC) with regard to N2O flow was significantly (α=0.05) higher than those of control, MDWC and LDWC treatments (Figure 1). Arable soil behaved differently to DWC, where the control (245 µg kg-1), SDWC (242 µg kg-1) and MDWC(220.7
µg kg-1) treatments produced significantly higher cumulative flows compared to
the LDRW (75 µg kg-1).
Temporal Dynamics of N2O over the 2-Month Incubation
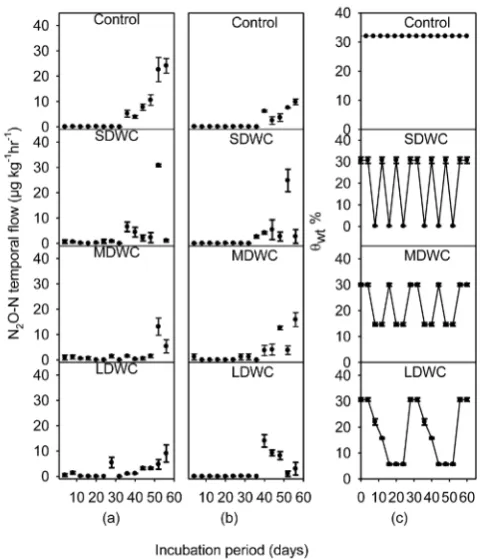
Temporal N2O evolution patterns of both soils by different DWC are depicted in Figure 2. With regard to arable and grassland soils against different θwt, the flows started rising after the 38th day of incubation. Such an increase was negligible in the control (0-10 µg kg-1 hr-1) treatments of arable soils, but continued to rise
to 24.09 µg kg-1hr-1 in grassland soils. During periods of background emission,
SDWC treatment induced a N2O-N peak of 30.78 µg kg-1 hr-1 and 24.81 µg kg-1
hr-1 grassland and arable soils, respectively, and only appeared on the 50th day of
incubation when the treatment returned to the actual moisture content of 32% θwt
Figure 1: Cumulative flow of N2O-N (µg kg-1) in arable and grassland soils during the
two months’ incubation, when drying-rewetting frequencies were manipulated. Means of three replicates per treatment with standard error.
Figure 2: Temporal dynamics of N2O-N (µg kg-1 hr-1) in grassland (a) and arable (b) soils
The flows were within the range of 0.4-1.8 µg kg-1 hr-1 during the first month
of all treatments (Figure 2). MDWC and LDWC yielded two higher peaks (16. and 14.11 µg kg-1hr-1, respectively) in arable soils within the 2nd month of incubation
(Figure 2). In MDWC of grassland soils, the flow also rose to 13.08 µg kg-1 hr-1
when brought back to 15% θwt.
CO2 Cumulative Flow
Based on the cumulative flow illustrated in Figure 3, after a 2-month incubation period, statistically significant (α=0.05) differences were found between the cumulative flows of CO2 by the grass soil receiving LDWC (97.2 mg kg-1)
and SDWC (130.50 mg kg-1), where SDWC was 25.38% higher than LDWC.
Furthermore, the arable soil (Figure 3) showed no statistically significant difference in response to the frequency of stress events compared to the control while the stressed treatments emitted CO2 flows that were only 19.85% higher
than the control.
CO2 Temporal Dynamics over the 2- Month Incubation Period
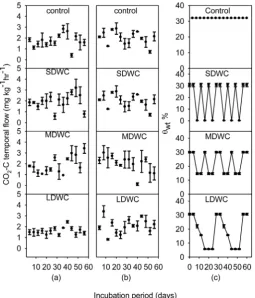
Evolution of CO2 was initially higher in all arable soil treatments (Figure 4). SDWC behaved similarly to the control during the entire period of incubation. Flows dropped from 2 to 0 mg kg-1 hr-1when exposed to a second drying cycle in
MDWC. The flows of LDWC treatments reduced to nearly 1 from 3.5 mg kg-1 hr-1
when exposed to the first drying cycle and then remained low. With regard to the grassland soils, a significant increase was detected between 30 and 40 days, about half way in the incubation period. Flows significantly reduced to 0.5 mg kg-1 hr-1
from 2.5mg kg-1 hr-1 when the SDWC soils were brought back (Figure 4) to their Figure 3: Cumulative flow of CO2-C (mg kg-1) in arable and grassland soils during the
initial θwt (32%). An immediate response in the MDWC treatment occurred when exposed to the third drying cycle. Long drying-rewetting events significantly suppressed CO2 flows during the entire incubation period.
Figure 4: Temporal dynamics of CO2-C (mg kg-1 hr-1) in grassland (a) and arable
(b) soils against different moisture regimes (c). Data points represent means of three replicates per treatment with standard error.
Nitrogen Concentration
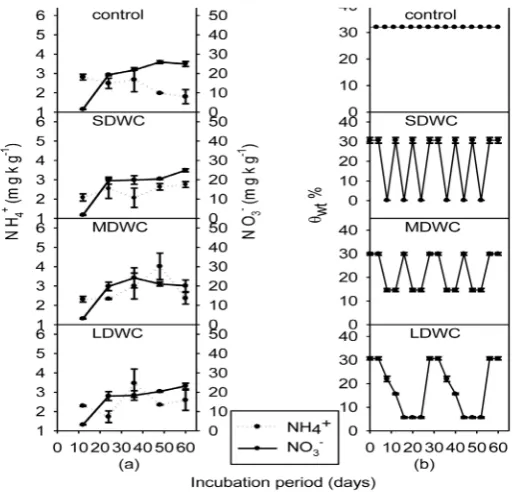
Nitrogen concentration was affected in all treatments regardless of stress events. Ammonification increased significantly in MDWC and LDWC treatments in both soils gradually with time in the control treatment of arable soils (Figures 5 and 6). Ammonium content in the SDWC treatment of arable soils steadily declined (Figure 5), followed by a rapid increase in nitrate content (4.75-36.51 mg kg-1). In
contrast, in the grassland soils (Figure 6) NH4+ content decreased thereby increasing
NO3-, but only minutely.
With regard to MDWC treatments of grass and arable soils, NH4+ increased
slightly and decreased sharply at the end, but NO3- continued to rise in arable soils
Figure 5: Figure 5: NH4+ and NO
3-(mg kg-1) contents of different arable soil (a)
treatments against different moisture regimes (b). Data points represent means of three replicates per treatment with standard error.
Figure 6: Figure 6: NH4+ and NO
3- (mg kg-1) contents of different grassland soil (a)
and LDWC (1.47-3.46 mg kg-1) and in the LDWC treatment of arable soil as well
(2.5-4.0 mg kg-1). However, NO
3- contents of arable soils were significantly higher
than in grassland soils in all cases (Figures 5 and 6).
DISCUSSION
N2O Flow During a Two-Month Incubation Period and N concentration
Distinct temporal patterns of N2O flows from control and SDWC treatments of grass soils, as well as the results obtained for N mineralisation, when using different moisture conditions, reveal that grass soil induced N2O flows were weakly related
to the NO3- content that might have been denitrified. Nevertheless, the presence
of only NO3- does not ensure denitrification (Kunickis et al., 2010). Thus, it can
be postulated that N2O flows were not only due to microbial nitrification, but also due to the limited availability of total organic carbon(McCarty and Bremner, 1992). On the other hand, such short and temporary drying-rewetting frequency enhanced denitrifier activity by availing physically protected organic matter (Fierer and Schimel, 2002). The behaviour of both soils (Figures 5 and 6) under a constant moisture regime (32% θwt) is different in the second half of the incubation period, where significantly higher N2O emission was observed.
Bateman and Baggs (2005) and Ciarlo et al., (2008) pointed out the predominance of nitrification between 18-21% volumetric water content in the soil and that continuous moisture treatments influenced release of N2O. It can be assumed that in arable soils, most of the organic carbon was lost as CO2 at the beginning of the incubation. However, NO3--N content of arable soils was
significantly higher, but organic carbon was not available for the denitrifiers. The activity of denitrifiers might have accelerated when the MDWC finished its first and second drying cycle.
Long drying significantly reduced N2O temporal and cumulative flows in both soils indicating that the activity of nitrifying and denitrifying microorganisms was disrupted (Bottner 1985). Significantly lower N2O production from nitrification
at low water content (below 40% WFPS) has been reported previously (Dalal et al., 2003). Likewise, Smith and Parsons (1985) postulated that drying results in a large decrease in the number of denitrifiers and their membrane bound denitrifying enzyme system.
Mineral Nitrogen Concentration Affected by Soil Moisture and Temperature Ammonium content decreased due to a continuous moist state, but not in the stressed treatments of the grassland soils (Figure 6). The other possibility could be that NH4+ might have been promptly converted to NO
3-. The favourable
temperature (20°C) had a measurable effect on the oxidation of NH4+ to NO3-
grass soils. The considerable increase in NH4+ content in MDWC and LDWC
is likely due to the mineralisation of the amount of organic N because of soil drying (Appel, 1998). The NH4+ content of arable soil was initially higher than
in grass soil, which might be due to fertiliser application to the crop in the field. Nitrate concentration shot up significantly between days 12-24 in all treatments regardless of stress events; either the nitrifiers were in a more active state (Abera et al., 2012) or they were stress resistant (Fierer and Schimel, 2002). In arable soils, the NNM and NNN were significantly higher than in the grassland soils in all treatments revealing the internal cycling of nitrogenous compounds into biologically available forms (Strauss, 2000). Higher NH4+ contents indicate the
slow mineralisation or reduced availability of indigenous N in grassland soils rather than arable soils. On the contrary, Fierer and Schimel (2002) found no significant differences between stressed and unstressed oak and grassland soils with regard to NO3- concentration. They proposed that nitrifier population might
be able to survive during the drying periods. With regard to NNN, the NO3- has
been denitrified. However, under natural grassland conditions, the quantification of available N is difficult as NH4+ is rapidly converted to NO
3- and both are taken
up by developed grass root systems.
The gradual increase in NO3- with time (Figures 5 and 6) in manipulated
and control soils can be justified in both cases by explaining that NH4+ has been
transformed to NO3. The most likely explanation is that nitrifiers were stress resistant and survived (Fierer and Scimel, 2002) in arable soils.
Temporal Dynamics of CO2.
Carbon mineralisation trends observed in arable and grassland soils in relation to CO2-C flow are opposite. The manipulations affected grassland soils
with different VWC during the first month of incubation, while arable soils proved more responsive with different θwt during the second month of incubation. The flows associated with arable soils were initially higher and afterwards decreased (Figure 4) under all treatments. When brought back to the actual moisture content (32% θwt), LDWC was quite efficient in its evolution of CO2-C flows. Later, an
increase in CO2 flows in the SDWC and MDWC of grass soils (Figure 4) were identical to the control. Microbes managed to survive at 21% θwt and 15 % θwt.
The lower temporal and cumulative flow related to the treatment with LDWC in grassland soils may be ascribed to the reduction in microbial activity at a moisture regime of 0.05% θwt due to moisture deficiency (Stark and Firestone, 1995; De Nobili et al., 2006) or even death of microbes (Chen and Alexander 1973). But it is noted that the flows were initially higher as seen in the other treatments.
matter, likely because of higher microbial activity due to N fertiliser application at sowing time and possibly its re-mineralisation afterwards.
A late appearance of peaks in the control (32 %), SDWC (21 %), MDWC (18 %) and LDWC (5 %) after one month of incubation was a result of the decomposition of very minute roots (mixed with soil), which might have been a major source of organic C (Herman et al., 1977). Furthermore, no statistically significant differences were found between the cumulative flow of the control and the stressed soils (Figure 3). The results are in agreement with Muhr et al. (2008), who found no differences among CO2 flows of constantly moist soil and drying-rewetting treatments.
CONCLUSION
The factors that influence carbon and nitrogen mineralisation leading to N2O
and CO2 emissions are influenced by a range of factors: temperature, fertiliser
application and organic carbon availability. Moreover, for CO2 and N2O production, we can conclude that the variation between soils at different periods of emission was accounted for by differences in organic carbon availability. Gravimetric water content (5%) appeared to be effective in reducing CO2 and N2O emissions in both soils. However, NO3- content was significantly higher in arable
soils than in grass soils. Thus, it is concluded that long drying and rewetting can increase NH4+ but not NO
3-.
High doses of nitrogen fertiliser result in low N utilisation by denitrifiers and a high risk of water contamination by nitrates leading to further research on the judicious use of N on wheat crops. Grassland soils can be N retaining if not frequently moistened. As far as the control treatment is concerned, it can be argued that the soils under continuous moist conditions, or frequently rewetted, could undergo nitrification thereby increasing N losses as N2O or as ground water leaching losses.
REFERENCES
Abera G., Wolde-Meskel E., Beyene S., Bakken L.R. (2012): Nitrogen mineralization dynamics under different moisture regimes in tropical soils. International Journal of Soil Science. 7: 132-145.
Appel T. (1998): Non-biomass soil organic N. The substrate for N mineralization flushes following soil drying rewetting and for organic N rendered CaCl2
-extractable upon soil drying. Soil Biology and Biochemistry. 30: 1445-1456.
Batjes N. H., Bridges E. M. (1992): A review of soil factors and processes that control fluxes of heat, moisture and greenhouse gases. Technical paper 23, International soil reference and information center, Wageningen.
Bateman E. J., Baggs E. M. (2005): Contributions of nitrification and denitrification to N2O emission from soils at different water-filled pore space. Biology and
Beare M. H., Williams P. H., Cameron K. C. (1999): On-farm monitoring of soil quality for sustainable crop production. In: Currie L.D., Hedley M. J., Horne D. J., Loganaathan P. (Eds.) Proceedings of the 1999 Fertilizer and Lime Research Center Conference. Occasional report No. 12. Massey University, Palmerston North, New Zealand: 81- 90.
Bottner P. (1985): Response of microbial biomass to alternate moist and dry conditions in a soil incubated with 14C- and tSN-tabelled plant material. Soil Biology and Biochemistry. 17: 329-337.
Brant J. B., Sulzman E.W., Myrold D. D. (2006): Microbial community utilization of added carbon substrates in response to long-term carbon input manipulation. Soil Biology and Biochemistry. 38: 2219-2232.
Butterly C. R. (2008): Drying-rewetting Cycles in Southern Australian Agricultural Soils: Effects on Turnover of Soil Phosphorus, Carbon and Microbial Biomass. Dissertation, University of Adelaide.
Carpenter-Boggs L., Stahl, P. D., Lindstrom M. J., Schumacher, T. E. (2003): Soil microbial properties under permanent grass, conventional tillage, and no-till management in South Dakota. Soil Tillage Research. 71: 15-23.
Chen H., Norbert B., Karl S., Yakov K. (2007): Effect of nitrogen and intensive mixing on decomposition of C- labeled maize (Zea maysL.) residue in soils of different land use types. Soil Tillage Research. 96: 114-123.
Chen M. and Alexander M. (1973): Survival of soil bacteria during prolonged desiccation. Soil Biology and Biochemistry. 5: 213-221.
Ciarlo E., Conti M., Bartoloni N., Rubio G. (2008): Soil N2O emissions and N2O/
(N2O+N2) ratio as affected by different fertilization practices and soil moisture.
Biology and Fertility of Soils. 44: 991-995.
Conrad R. (1996): Soil microorganisms as controllers of atmospheric trace gases (H2, CO2, CH4, OCS, N2O, and NO). Microbiological Reviews. 60: 609-640.
Dalal R.C., Wang W., P., Parton W. J. (2003): Nitrus oxide emission from Australian agricultural lands and mitigation options: a review. Australian Journal of Soil Research. 41: 165-195.
Diz-Muñoz C., Paulino L., Monreal C., Zagal E. (2010): Greenhouse gas (CO2 and
N2O) emissions from soil: A review. Chilean Journal of Agricultural Research.
70: 485-497.
Duxbury J. M. (1994): The significance of agricultural sources of greenhouse gases. Fertilizer Research. 38:151-163.
Fierer N., Schimel J. P. (2002): Effects of drying-rewetting frequency on soil carbon and nitrogen transformations. Soil Biology and Biochemistry. 34: 777-787.
Fierer N., Schimel J. P, Holden P. (2003): Variations in microbial community composition through two soil depth profiles. Soil Biology and Biochemistry. 35: 167-176.
Gee G. W., Bauder J. W. (1986): Particle-size analysis. In: Klute A (ed.) Methods of Soil Analysis, Part 1. Physical and Mineralogical Methods. Agronomy monograph No. 9, 2edn. American society of agronomy/Soil science society of America, Madison, WI: 383-411.
Goldberg S. D., Knorr K. H., Blodau C., Lischeid G., Gebauer G. (2009): Impact of altering the water table height of an acidic fen on N2O and NO fluxes and soil
concentrations. Global Change Biology. 16: 220-233.
Haney R. L., Haney E. B. (2010): Simple and rapid laboratory method for rewetting dry soil for incubations. Communications in Soil Science and Plant Analysis. 41: 1493-1501.
Herman W. A, McCill W. B., Dormaar J. F. (1977): Effects of initial chemical composition and decomposition of roots of three grass species. Canadian Journal of Soil Science. 57: 205-215.
Huang Y., Jiao Y., Zong L., Wang Y., Sass R. L. (2002): Nitrous oxide emissions from the wheat growing season in eighteen Chinese paddy soils: an outdoor pot experiment. Biology and Fertility of Soils. 36:411-417.
IPCC. (2007): Summary for Policymakers. In: Climate Change. The Physical Science Basis. Contribution of Working Group I to the Fourth Assessment Report of the Intergovernmental Panel on Climate Change [Solomon S. D, Qin M., Manning Z., Chen M., Marquis K. B., Averyt M., Tignor H. L., Miller (eds.)]. Cambridge University Press, Cambridge, United Kingdom and New York, NY, USA.
Kessavalou A., Doran J. W., Arvin R., Mosier A. R., Drijber R. A. (1998): Greenhouse gas fuxes following tillage and wetting in a wheat-fallow cropping system. Journal of Environmental Quality. 27: 1105-1116.
Kim D. G, Vargas R., Bond-Lamberty B., Turetsky M. R. (2011): Effects of soil rewetting and thawing on soil gas fluxes: a review of current literature and suggestions for future research. Biogeosciences Discuss 8. 9847-9899.
Kruse J., Kissel D. E., Cabrera M. L. (2004): Effects of drying and rewetting on carbon and nitrogen mineralization in soils and incorporated residues. Nutrient Cycling in Agroecosystems. 69: 247-256.
Kunickis S. H, Gilliam J. W., Evans R. O., Dukes M. (2010): Soil characteristics and their role in developing conditions favorable for denitrification. 19th World Congress of Soil Science, Soil Solutions for A Changing World 1-6 August, Brisbane, Australia. Published on DVD.
Liu C., Wang K., Zheng X. (2011). Responses of N2O and CH4 fluxes to fertilizer
nitrogen addition rates in an irrigated wheat-maize cropping system in northern China. Biogeosciences. 9: 839-850.
Loveday J. (1974): Methods for analysis of irrigated soils. Commonwealth Agricultural Bureau. Soils Technical Communications. 54.
Mancino C. F., Torello W. A. (1986): Enumeration of denitrifying microbial populations in turf. Plant and Soil. 96: 149-151.
McCarty, G. W., Bremner J. M. (1992): “Availability of organic-carbon for denitrification of nitrate in sub soils”. Biology and Fertility of Soils. 14: 219-222.
Miller A. E., Schimel J. P., Meixner T., Sickman J. O., Melack J. M. (2005): Episodic rewetting enhances carbon and nitrogen release from chaparral soils. Soil Biology and Biochemistry. 37: 2195-2204.
Muhr J., Goldberg S. D, Borken W., Gebauer G. (2008): Repeated drying-rewetting cycles and their effects on the emission of CO2, N2O, NO, and CH4 in a forest
soil. Journal of Plant Nutrition and Soil Science. 171: 719-728.
Parker D. T., Larson W. E. (1962): Nitrification as affected by temperature and moisture content of mulched soils. Soil Science Society of America journal. 26: 238-242.
Ruser R., Flessa H., Russow R., Schmidt G., Buegger F., Munch J. C. (2005): Emission of N2O, N2 and CO2 from soil fertilized with nitrate: effect of compaction, soil
moisture and rewetting. Soil Biology and Biochemistry. 38: 263-274.
Smith K. A., Ball T., Conen F., Dobbie K. E., Massheder J., Rey A. (2003): Exchange of greenhouse gases between soil and atmosphere: interactions of soil physical factors and biological processes. European Journal of Soil Science. 54: 779-791.
Smith K. A., Clayton H., McTaggart I. P., Thomson P. E., Arah J. R. M., Scott A. (1995): The measurement of nitrous oxide emission from soil by using chambers. Philosophical transactions of the Royal Society of London. 351: 327-338.
Smith M. S., Parsons L. L. (1985): Persistence of denitrifying enzyme activity in dried soils. Applied and Environmental Microbiology. 49: 316-320.
Stark J., Firestone M. (1995): Mechanisms for soil moisture effects on activity of nitrifying bacteria. Applied and Environmental Microbiology. 61: 218-221.
Strauss E. A. (2000): The Effects of Organic and Nitrogen Availability on Nitrification Rates in Stream Sediments. Dissertation, University of Norte Dame, Indiana.
Thomson B. C., Ostle N. J., McNamara N. P., Whiteley A. S., Griffiths R. I. (2010). Effects of sieving, drying and rewetting upon soil bacterial community structure and respiration rates. Journal of Microbiological Methods. 83: 69-73.
Ugalde D., Brungs A., Kaebernick M., McGregor A., Slattery B. (2007): Implications of climate change for tillage practice in Australia. Soil Tillage Research. 97: 318-330.
U.S. Department of Agriculture. (2010). Keys to Soil Taxonomy, 11th ed. USDA,
Natural Resources Conservation Service, Washington, DC.
Wang X., Li X., Hu Y., Lv J., Sun J., Li Z., Wu Z. (2010): Effect of temperature and moisture on soil organic carbon mineralization of predominantly permafrost peatland in the Great Hing’an Mountains, northeastern China. Journal of Environmental Sciences (China). 22: 1057-1066.
Wei, X. R., Hao M. D., Xue X. H., Shil P., Horton R., Wang A., Zang Y. F. (2010): Nitrous oxide emission from highland winter wheat field after long-term fertilization. Biogeosciences 7: 3301-3310.