eISSN: 2600-8238 online
PAIRWISE CLUSTERS OPTIMIZATION AND CLUSTER MOST
SIGNIFICANT FEATURE METHODS FOR ANOMALY-BASED
NETWORK INTRUSION DETECTION SYSTEM (POC2MSF)
Gervais Hatungimana
Department of Informatics Engineering, Institut Teknologi Sepuluh Nopember, Indonesia [email protected]
ABSTRACT
Anomaly-based Intrusion Detection System (IDS) uses known baseline to detect patterns which have deviated from normal behaviour. If the baseline is faulty, the IDS performance degrades. Most of researches in IDS which use k-centroids-based clustering methods like means, K-medoids, Fuzzy, Hierarchical and agglomerative algorithms to baseline network traffic suffer from high false positive rate compared to signature-based IDS, simply because the nature of these algorithms risk to force some network traffic into wrong profiles depending on K number of clusters needed. In this paper, we propose an alternative method which instead of defining K number of clusters, defines t distance threshold. The unrecognizable IDS; IDS which is neither HIDS nor NIDS is the consequence of using statistical methods for features selection. The speed, memory and accuracy of IDS are affected by inappropriate features reduction method or ignorance of irrelevant features. In this paper, we use two-step features selection and Quality Threshold with Optimization methods to design anomaly-based HIDS and NIDS separately. The performance of our system is 0% ,99.99%, 1,1 false positive rates, accuracy, precision and recall respectively for NIDS and 0%,99.61%, 0.991,0.97 false positive rates, accuracy, precision and recall respectively for HIDS.
Keywords: Clustering; Cluster Most Significant Feature, Network Traffic Baseline; Network Security; Quality Threshold
1. Introduction
The next step for ensuring safe Information Technology (IT)-enabled information system after deployment of firewall at network perimeter is the deployment of network Intrusion Detection System (IDS). While the firewall offers protection against external attack, IDS can offer protection from both internal and external attack (Davidoff & Jonathan, 2012). This research has been concentrating to fixing issues within anomaly-based IDS mainly high false alarms.
Based on the literature, the research in anomaly-base IDS can be seen in three categories; clustering-based, classification-based, and hybrid-based. The clustering based methods make exclusive use of unsupervised machine learning techniques to detect intrusion within dataset; K-MEANS, K-medoids, EM clustering, and Outlier Detection dominate this category (Agrawal & Agrawal, 2015). The classification-based has been exploited by many researchers using original or adapted supervised machine learning techniques to train the model based on known traffic so that unknown traffic can be detected later. Naïve Bayes, Decision Tree, Fuzzy Logic, Neural Network, Genetic Algorithm and Support Vector Machine dominate this category (Nasiroh, 2014). A hybrid design combines both unsupervised and supervised machine learning techniques to train the model so that the new traffic will be predicted about its type (Agrawal & Agrawal, 2015).
two dimensional features. In Muttaqien & Ahmad (2016), a divisive clustering method was proposed for profiling. The features selection is as per chi-square. To improve the classification, a feature transformation which groups features into one dimension was used. A combination of genetic algorithm and fuzzy clustering was proposed in Fries (2015) to detect intrusion in TCP KDD dataset. Although the author targets TCP, all 41 features in KDD dataset where considered for reduction process using algorithm which gives out 8 features. Among basic TCP connection features of KDD dataset only 4 are packet header attributes; if GA gives 8 features out of 41 it is obvious that the design favors HIDS.
Hierarchical clustering and SVM method is proposed in Horng et al. (2011) on KDD Cup 1999 dataset. The feature selection method is “leave-one-out”. The profiling is according to K-medoids which is the best method for categorical attributes (Chitrakar & Chuanhe, 2012) together with SVM this method ended up with accuracy of 99.7 and 0.07 false positive. Earlier the substitution of SVM with other classification techniques was done in Gervais et al. (2016) but it shows that SVM has obtained higher performance. The quality threshold clustering method in Gervais et al. (2016) uses 7 features from the basic TCP connection features; with interesting false positive rate of 0.2% and accuracy of 99.6 % using decision tree as classifier.
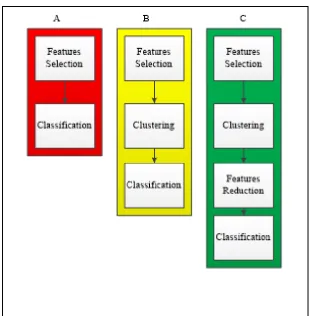
The methods with exclusive clustering have been proposed in Fossaceca et al. (2015) and Al-Mamory & Jassim (2015). These methods only classify data as they are in KDD dataset. Al-Mamory et al. (2015) proposed the use of basic features and statistical features collaboratively to design a two-gain level classifier in KDD 99. The features reduction is according to information gain method. Fossaceca et al. (2015) proposed MARK-ELM method to classify data in KDD 99 dataset without features reduction. Referring to the previous research so far discussed we can summarize the advances of anomaly-based IDS design as depicted in Figure 1.
Considering these three generations of IDS design, we can notice that the parameterization as it was introduced in Agrawal & Agrawal (2015) so far in the current (3rd) generation includes features selection, clustering and features reduction methods. While for the 2nd generation the parameterization includes only features selection and clustering methods. The 1st generation’s parameterization is only limited to features selection. Our research is dealing with issues within parameterization in 3rd generation. Davis & Clark (2011) say that preprocessing cost more than 50% of all time required to build IDS model. More emphasizes on preprocessing has been discussed by Shiravi et al. (2012).
There is a problem of making distinct network profiles to serve as baseline for detection (profiling). Mostly, clustering techniques like k-mean, c-mean, or hierarchical clustering methods are used to baseline network traffic. These methods require the predefinition of the number of quality clusters from the dataset arbitrary; the problem is that when the number of clusters is small, there is a risk that some data point will be forced into inappropriate clusters (called under fitting) and when the numbers of clusters are too many there is a risk of having unnecessary clusters (called over fitting). The problem becomes more serious when the dataset has increased or reduced because the previously defined number of clusters can no more fit the new size (robustness) (Muchammad & Ahmad, 2015). There is a problem pertaining with features selection process; almost all previous research use statistical method for selecting features (Muchammad & Ahmad, 2015; Al-Mamory & Jassim, 2015; Muttaqien & Ahmad, 2016). The consequence of statistical method is that it removes important features which characterize the system being designed.
We expect that the IDS being designed will be put somewhere on the network watching the packets flows or system audit files to decide if anything is wrong based on the baseline. If methods like chi-square is used and among all features selected there is no packet header attribute, we cannot expect this system to work if it is deployed in real world network. Although Davis & Clark (2011) say that those kinds of IDS might work for HIDS, HIDS also might have received the log with some basic features from which statistical features can be computed to support detection. If you take an example of KDD 99 dataset where all data have flag feature; network experts knows that flag feature is associated with TCP; it doesn’t make sense to use flag feature for building a baseline for UDP traffic (Sembiring et. al., 2010). This is one case of issue pertaining to features selection. Wrong features selection will result in unrecognized IDS which cannot work at all.
Another problem related to features is the feature reduction process. The motivation for this process is to optimize the classifiers speed, memory and accuracy (Fossaceca et al., 2015). While generation 1 and 2 ignored these requirements, much generation 3 research considered the speed forgetting the memory limitation of network devices and proposes feature transformation methods to group some features (Muchammad & Ahmad, 2015) and (Muttaqien & Ahmad, 2016). At the time of simulation, since the features feed to the classifier are already grouped you cannot see how much memory, time, and power it would cost IDS with limited memory and computing capacity to process all those computational requirements before actual detection. We argue that features transformation is not good practice for online IDS design due to resources limitation of implementing machines and high-speed requirement to catch up with today’s fastest network.
2. Proposed Method
In this paper, we propose a two-step feature selection method. The first step is concerned with manually selecting features to support profiling phase. The selected features serve a digest for
clustering algorithms hereby referred to 𝑈𝑓𝑒𝑎𝑡𝑢𝑟𝑒s. For the scope of our research, these
features include the basic TCP connection features in KDD 99 dataset as described in Aggarwal
& Kumar (2015). The second step is concerned with finding and removing from 𝑈𝑓𝑒𝑎𝑡𝑢𝑟𝑒s,
those features which do not influence the classifier performance and remove them; so are
referred to as 𝑆𝑓𝑒𝑎𝑡𝑢𝑟𝑒𝑠 and the process as cluster most significant feature (𝑐𝑚𝑠f) method.
Again, we propose a new method for baselining network packet traffic, referred to as profiling.
a) Cluster most significant feature (cmsf)
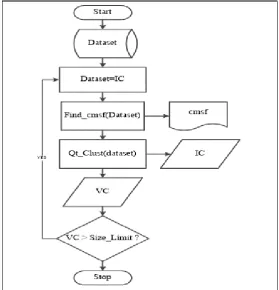
The concept of 𝑐𝑚𝑠𝑓 method as depicted in Figure 2 and Figure 3 is the identification of one
and only one feature with high gain at every iteration step. Initially the dataset is considered as
invalid cluster denoted by 𝐼𝐶; from 𝐼𝐶 we find 𝑐𝑚𝑠𝑓 according to the correlation coefficient
(Kim, 2012). The process iterates until we can’t split IC anymore. For all feature which is not
identified as cmsf is considered as cluster least significant feature denoted as 𝑐𝑙𝑠𝑓. One can
question about the features being used; At this stage we consider TCP IP basic features (Aggarwal & Kumar, 2015) to design HIDS of which Duration, Service and Flag are found to
be 𝑐𝑚𝑠𝑓. By considering the theory of NIDS we consider only Packet Header Attributes (Davis
& Clark, 2011) for NIDS design of which service, Source byte and Flag are found to be 𝑐𝑚𝑠𝑓.
b) Profiling
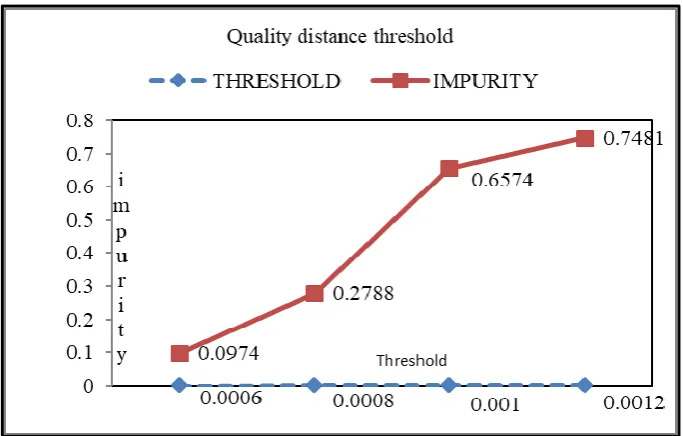
In addition to the method used for finding distance threshold (Gervais et al., 2016), this time we consider impurity as a result of two clusters being coupled together. If a couple is formed of clusters originally different profile; one attack another normal that means, there is an error and new threshold is needed. It is based on the experiment as depicted in figure 4 and 5 that we use 0.0006 and 0.0004 for HIDS and NIDS respectively.
Figure 3 The cmsf Procedure
Figure 4 Finding Distance Threshold for HIDS.
Figure 5 Finding Distance Threshold for NIDS
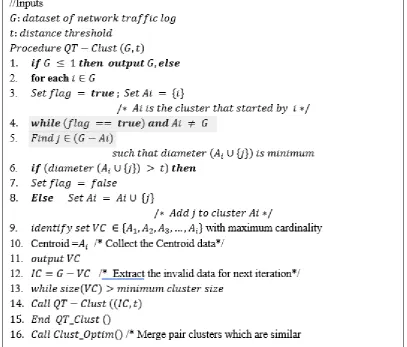
Figure 6 Optimized Quality Threshold Clustering Algorithm
The algorithm accepts dataset G and distance threshold t as inputs. Initially, every data
order to avoid the overlapping neighbors, we consider the centroid which has got most of
neighbors. This centroid and its neighbors make a valid cluster VC which is then removed from
the dataset G. The remaining dataset G − VC is denoted as IC and is taken for further clustering
(next iteration).
We save the centroid (line 10) of the VC in centroids dataset for later use during
optimization process (Line 16). The resulting VC decreases in size consecutively, starting from
the biggest cluster to the smallest. We set the cluster limit to serve to the process as iteration termination criteria. It means that, if returned cluster has more than minimum cluster size, then we are still far from reaching outlier in the dataset. So, IC is taken for further clustering; otherwise it is considered as outlier and cannot be further clustered with that threshold. In that
case, IC is discarded unless further threshold fine-tune is opted. After the loop has finished, the
outputs are VCs. We take these VCs for optimization as per line 16. The details of the
Clust_Optim procedure is described in Figure 7; it accepts centroid dataset cd as input.
Figure 7 Optimization Procedure
We start by forming the neighbor set NS for each centroid; by removing the centroid
c from the centroid dataset cd. Then we denote P_req (pairing request), the centroid form NS
to which centroid c request to merge with. Immediately we reset the NS by removing the
centroid P_req from the centroid dataset cd to give chance to P_req for finding its closest
neighbor; so, we denote P_rep, the centroid identified by P_req as the closest neighbor. If P_rep
is the index of centroid c, then new centroid is formed by coupling c and Preq, otherwise these
centroids remain separated. At the end, we get new centroids either in couple or single. Data within couple centroid are merged together to form one cluster equivalent to a network traffic profile.
This optimization process is limited to pairwise relationship. Triplewise or more risk returning to original dataset. Alternative to merging would be recalculating a new centroid form previously merged clusters then repeat the process. Since the centroids are identified once during the clustering process, this option becomes impracticable at this stage of experimentation. Reducing the number of clusters as many as possible is important for the performance of IDS therefore it is encouraged to come up with new method future work. The difference between Original as was used by Gervais et al. (2016) and the optimized algorithm is that for original algorithm the network profiles correspond directly to the clusters labels while for the optimized version some clusters may make synergy to represent one network profile.
c) Features Reduction
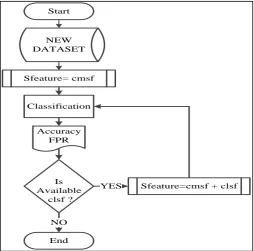
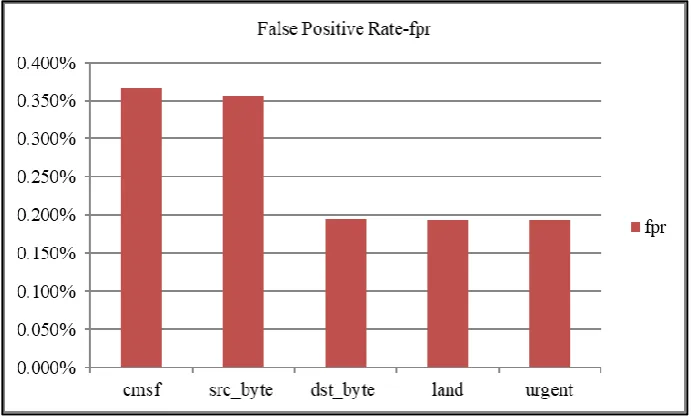
At glance of classification, we set 𝑐𝑚𝑠𝑓 features as default; As depicted in Figure 8, we do
classification and evaluate the performance in terms of false positive rate and accuracy. As long
as there are 𝑐𝑙𝑠𝑓available, we add one by one and evaluate the performance. The variation of
results is depicted in Figure 9 and Figure 10.
Figure 8 Features Reduction Process Start
Sfeature= cmsf
Classification
Sfeature=cmsf + clsf
End Is Available
clsf ?
YES
NO Accuracy
Figure 9 Accuracy Variation
Figure 10 FPR Variation
3. Results and Discussion
4. Results for HIDS
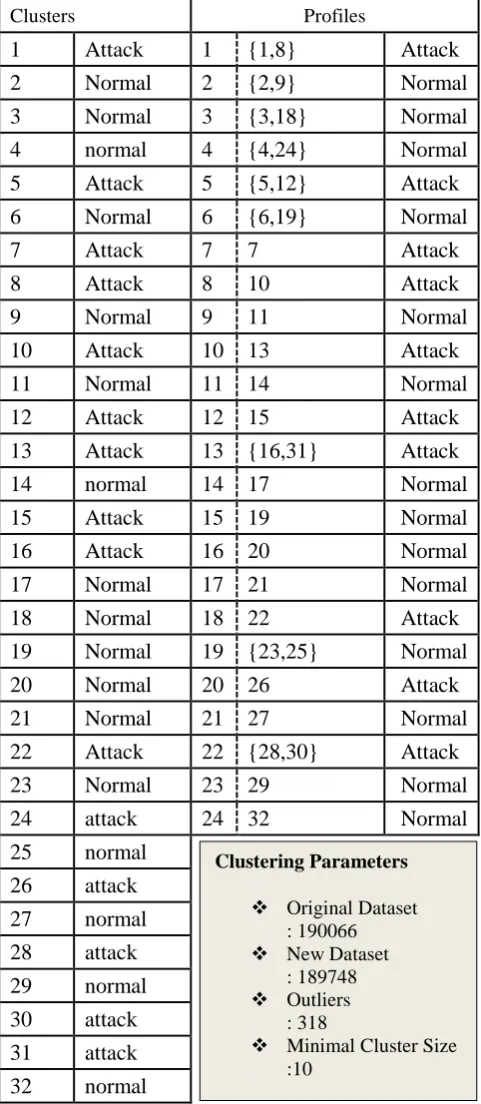
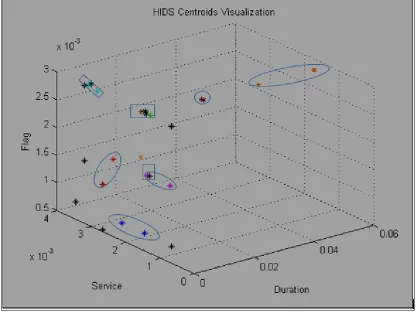
The profiling phase yields results in Table 1; column 2 holds the clusters created before optimization procedure, column 2 holds clusters after optimization procedure. The elements in {} are clusters centroids which have been coupled together. We visualize the results in Figure
11 by plotting centroids in 3-D. By looking at centroids in rectangle we can see some clusters
overlapping each other while other centroids couple in oval are visually distinguishable; it is
the consequence of using only 3 features (cmsf) to plot 7-dimentional data; however, it has no
impact on the design of IDS.
Table 1 HIDS Profiling Results
Clusters Profiles
1 Attack 1 {1,8} Attack
2 Normal 2 {2,9} Normal
3 Normal 3 {3,18} Normal
4 normal 4 {4,24} Normal
5 Attack 5 {5,12} Attack
6 Normal 6 {6,19} Normal
7 Attack 7 7 Attack
8 Attack 8 10 Attack
9 Normal 9 11 Normal
10 Attack 10 13 Attack
11 Normal 11 14 Normal
12 Attack 12 15 Attack
13 Attack 13 {16,31} Attack
14 normal 14 17 Normal
15 Attack 15 19 Normal
16 Attack 16 20 Normal
17 Normal 17 21 Normal
18 Normal 18 22 Attack
19 Normal 19 {23,25} Normal
20 Normal 20 26 Attack
21 Normal 21 27 Normal
22 Attack 22 {28,30} Attack
23 Normal 23 29 Normal
24 attack 24 32 Normal
25 normal
26 attack
27 normal
28 attack
29 normal
30 attack
31 attack
32 normal
Clustering Parameters
Original Dataset : 190066
New Dataset : 189748
Outliers : 318
Figure 11 HIDS Centroids Visualization
Finally, the classification results show that the Decision Tree is the best classifier for our design as shown in Table 2. Our method (POC2MSF) outstands in all aspects compared to QT method (Gervais et al., 2016) and KDD when no clustering is involved (Generation1) We notice significant improvement in terms of time from 33 to 28 seconds. Accuracy improvement means that profiles are more distinct than before. The time reduction is consequence of profiles reduction from 32 to 24 profiles.
Table 2 HIDS Performance Results
POC2MSF QT KDD
Profile 24 32 20
Accuracy 97.80% 97.15% 86.63%
FAR 0.1% 0.1% 0.9%
Time 15 Sec 22 Sec 40 sec
Precision 0.99 0.89 0.90
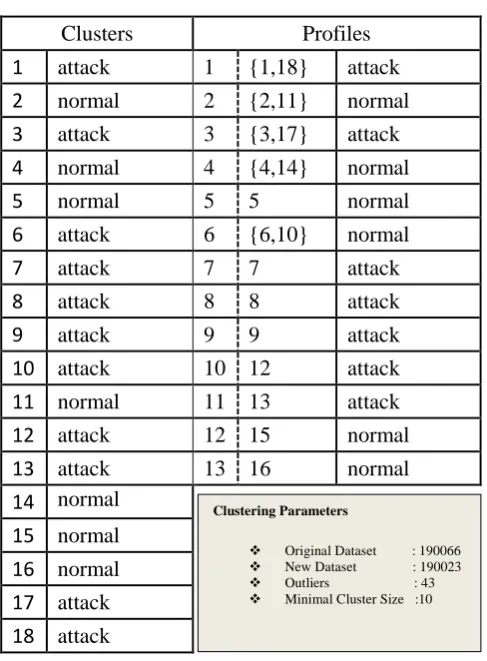
5. Experimental results for NIDS
The profiling for NIDS yields the results as are shown in Table 3; the first column represents clusters created and the second column represents profiles. The number in {} are pair of clusters merged together to form one profile. We visualize the clustering results using 3-D plotting of centroids as shown in Figure 12. All couple centroids according to results in Table 3 are represented in oval. The rest of centroids are just single. By looking at couples you can tell that all centroids which are statistically coupled as depicted in Table 3; visually they are closer to each other as depicted in Figure 12. There is no visualization error because the dataset is 3-dimentional which fits the 3-D plotting. If a member of one couple is closer to member form another couple but could not form couple, it is a result of inverse neighborhood; the reason behind is that the next centroids have identified another closest neighbor.
Table 3 NIDS Profiling Results
Clusters Profiles
1 attack 1 {1,18} attack
2 normal 2 {2,11} normal
3 attack 3 {3,17} attack
4 normal 4 {4,14} normal
5 normal 5 5 normal
6 attack 6 {6,10} normal
7 attack 7 7 attack
8 attack 8 8 attack
9 attack 9 9 attack
10 attack 10 12 attack
11 normal 11 13 attack
12 attack 12 15 normal
13 attack 13 16 normal
14 normal
15 normal
16 normal
17 attack
18 attack
After experimentation with many classifiers, we found that Decision Tree is the best of which the results are shown in Table 4. Our method (POC2MSF) outstands in all aspects compared to QT method by Gervais at al. (2016) and KDD when no clustering is involved (Generation1). We notice significant improvement in terms of time from 21 to 19 seconds. Accuracy improvement (0.0043) means that profiles are more distinct than before. The time reduction is consequence of profiles reduction from 18 to 13 profiles.
Clustering Parameters
Original Dataset : 190066
New Dataset : 190023
Outliers : 43
Table 4 NIDS Performance Results
POC2MSF QT KDD
Profile 13 18 20
Accuracy 99.97% 99.93% 99.02%
FAR 0% 0% 0.8%
Time 19 sec 21 sec 25 sec
Precision 1 1 0.98
Recall 1 1 0.99
.
Figure 12 NIDS Centroids Visualization
6. Conclusion
In this paper, we have been addressing three main issues of designing anomaly-based IDS. One of the issues is the use of feature reduction. We saw that most of research which uses statistical features reduction end up with the system which does not qualify to be network intrusion detection system (Davis & Clark, 2011). Our method of feature selection can reduce features at the last step of design by removing features which do not influence the classifier. Our method identified 1/7 features which is not needed for building the detection model although it was necessary for profiling phase. One reason for features reduction is to reduce computation load, time and memory consumption. Even if we have saved one feature in our experiment, this method can save many features depending on the type of dataset and scope of research.
NIDS. One thing not to ignore is the reduction of time. Time becomes a challenge for IDS in todays’ fastest network, by reducing 5 second requirement for HIDS and 3 second for NIDS makes great achievement considering millions of packets which would flow within one second.
The last issue discussed was general design of IDS where there is no clear separation of HIDS and NIDS. In this paper, we have designed both NIDS and HIDS separately. It is amazing to reach 0% false positive rate and almost 100% system accuracy for NIDS. The advantage of this design is that since NIDS has higher performance than HIDS and features of NIDS are available in HIDS design, a switchover is possible by tuning up NIDS to detect intrusion in TCP network logs on host to take advantage of signature-like anomaly-based IDS. The future work would be testing our method on other datasets.
References
Aggarwal, P., & Kumar, S. (2015). Analysis of KDD Dataset Attributes - Class wise For
Intrusion Detection. Procedia - Procedia Computer Science, 57, 842–851.
https://doi.org/10.1016/j.procs.2015.07.490
Agrawal, S., & Agrawal, J. (2015). Survey on Anomaly Detection using Data Mining
Techniques. Procedia - Procedia Computer Science, 60, 708–713.
https://doi.org/10.1016/j.procs.2015.08.220
Al-Mamory, S. O., & Jassim, F. S. (2015). On the designing of two grains levels network
intrusion detection system. Karbala International Journal of Modern Science, 1(1), 15–
25. https://doi.org/10.1016/j.kijoms.2015.07.002
Chitrakar, R., & Chuanhe, H. (2012). Anomaly Detection using Support Vector Machine
Classification with k-Medoids Clustering. In 4th International Conference on Computing
and Informatics, ICOCI, Sarawak, Malaysia (pp. 1–5).
https://doi.org/10.1109/AHICI.2012.6408446
Davidoff, S, Jonathan, H. (2012). Network Forensics. Upper Saddle River, New Jersey:
PRENTICE HALL.
Davis, J. J., & Clark, A. J. (2011). Data preprocessing for anomaly based network intrusion
detection: A review. Computers {&} Security, 30(6–7), 353–375.
https://doi.org/10.1016/j.cose.2011.05.008
Fossaceca, J. M., Mazzuchi, T. A., & Sarkani, S. (2015). MARK-ELM : Application of a novel Multiple Kernel Learning framework for improving the robustness of Network Intrusion
Detection. Expert Systems With Applications, 42(8), 4062–4080.
https://doi.org/10.1016/j.eswa.2014.12.040
Fries, T. P. (2015). Fuzzy Clustering of Network Traffic Features for Security. IEEE
Symposium on Large Data Analysis and Visualization 2015, 127–128.
Gervais, H., Munif, A., & Ahmad, T. (2016). Using QualityThreshold Distance to Detect
Intrusion in TCP / IP Network. In 2016 IEEE International Conference on
Communication, Networks and Satellite (COMNETSAT) (pp. 80–84).
Heyer, L. J., Kruglyak, S., & Yooseph, S. (1999). Expression Data : Identification and Analysis
of Coexpressed Genes. Genome Research, (213), 1106–1115.
https://doi.org/10.1101/gr.9.11.1106
Expert Systems with Applications, 38(1), 306–313. https://doi.org/10.1016/j.eswa.2010.06.066
Kim, S. (2012). Compute Spearman Correlation Coefficient with Matlab / CUDA. In Signal
Processing and Information Technology (ISSPIT), 2012 IEEE International Symposium
on (pp. 55–60).
Muchammad, K., & Ahmad, T. (2015). Detecting Intrusion Using Recursive Clustering and
Sum of Log Distance to Sub-centroid. In Procedia - Procedia Computer Science (Vol. 72,
pp. 446–452). Elsevier Masson SAS. https://doi.org/10.1016/j.procs.2015.12.125
Muttaqien, I. Z., & Ahmad, T. (2016). Increasing Performance of IDS by Selecting and
Transforming Features. In 2016 IEEE International Conference on Communication,
Networks and Satellite (COMNETSAT) Using (pp. 85–90).
Nasiroh Omar. (2014) Modelling Complexities Of Learner’s In Handling Web Texts Via
Abstract Scene Analysis, Malaysian Journal of Computing, 2(1), 13-26.
Sembiring, R. W., Zain, J.M., and Embong, A. (2010). A Comparative Agglomerative
Hierarchical Clustering Method to Cluster Implemented Course, Journal of Computing,
Vol. 2, Issue 12 , 33-38.
Shiravi, A., Shiravi, H., Tavallaee, M., & Ghorbani, A. A. (2012). Toward developing a
systematic approach to generate benchmark datasets for intrusion detection. Computers