E
ff
ects
of
Cohesion-Based
Feedback
on
the
Collaborations
in
Global
Software
Development
Teams
Alberto
Castro-Hernández
1,*,
Kathleen
Swigger
1,
Mirna
P.
Ponce-Flores
21Computer Science and Engineering Department, University of North Texas, Denton, Texas, 76203, USA; 2IngenieríaenTecnologíasdelaInformación,UniversidadPolitécnicadeAltamira,Altamira,Tamaulipas,Mexico
Abstract
This paper describes a study that examines the effect of cohesion-based feedback on a team member’s behaviors in a global software development project. Chat messages and forum posts were collected from a software development project involving students living in the US and Mexico. Half of the teams in the project received feedback in the form of a graphical representation that displayed the group’s cohesion level, while the other teams received no feedback. The nature of the group interactions as well as the linguistic content of such interactions was then analyzed and compared. Results from this analysis show statistically significant differences between the f eedback and non-feedback conditions. More specifically, cohesion-based feedback had a positive relation to a team’s total message count, response rate, and individual cohesion score. In addition, the analysis of linguistic categories showed that the most salient categories observed were related to words about time and work. Furthermore, a comparison between feedback variables and type (i.e., positive and negative feedback) indicates that those individuals exposed to negative feedback had an increase in their communication pacing rates when exposed to positive feedback. Although the feedback system did not appear to affect individual performance, the findings sug gest tha t the coh esion mea sure defi ned in this study is positively correlated to the task cohesion construct and is also related to individual and team performance.
Received on 7 February 2015; accepted on 09 November 2015; published on 21 December 2015 Keywords: Feedback, cohesion, teamwork, collaboration, global software development, virtual teams
Copyright © 2015 A. Castro-Hernández et al., licensed to EAI. This is an open access article distributed under the terms of the Creative Commons Attribution license (http://creativecommons.org/licenses/by/3.0/), which permits unlimited use, distribution and reproduction in any medium so long as the original work is properly cited.
doi:10.4108/eai.21-12-2015.150818
1. Introduction
Because of the growing trend toward globalization in industries, there has been a rise in the use of global teams in organizations [1]. These types of teams generally consist of people who have diverse skills, are remotely located, operate within a global organization, and collaborate on tasks by using telecommunication technologies [2]. The reasons why global teams have flourished over the past few years is because they provide industry with many benefits such as reduced costs, access to people with different skills, a flatter organizational structure, and closer proximity to local markets [3].
On the other hand, managing global teams has its own special challenges. Dealing with cultural diver-sity [2] and coping with different perceptions of time and relationships [4] can have significant effects on team performance. The lack of trust within global
∗
Corresponding author. Email:[email protected]
teams is also a major problem [5], largely because of the lack of face-to-face contact [6]. Another challenge for global teams is the difficulty in establishing eff ec-tive communication channels among team members. Because members of global teams generally use some type of telecommunication technology to share infor-mation and achieve their goals, members often find themselves using cumbersome software tools to manage the distributed communications [7].
Research has recently found that many of the prob-lems found in virtual teams are often caused by a lack of cohesiveness among group members. For exam-ple, researchers report that the use of communica-tion technologies often hinders the development of the cohesion construct [2]. Global teams have much lower cohesion levels than co-located groups, largely because they collaborate via technology rather than face-to-face. On the other hand, research suggests that the lack of group cohesiveness can be overcome through the exchange of more social communications among group members [8]. Social interactions allow team members
1
on
Collaborative Computing
Research
Article
EAI Endorsed Transactions on Collaborative Computing 122015|Volume1|Issue6|e2
EAI
European Allianceto create stronger links, which can have the effect of increasing the levels of group cohesiveness. This partic-ular factor appears to be extremely important because it is also seems to be linked to group performance [9].
Thus the question arises about whether one can improve the performance of global teams by providing groups with information about their overall cohesive-ness levels. For example, individuals within a group might change their behavior if they receive some type of feedback about how well their team is communicating with one another. Feedback has been found to be related to performance when it is adequately provided [10]. It has also been shown to increase the engagement level among team members [11]. Therefore, it should be possible to increase cohesiveness and performance within the group by providing effective feedback about how closely team members are working together.
In this paper we describe a feedback system that is intended to show individual cohesion levels within a global software development team. Our main objective is to determine whether such displays can modify the communication behavior of team members who are participating in the project. Moreover, it is proposed that the change in the communication behaviors as a result of this feedback will have an effect on team performance. Additionally, we propose that an interaction-based measure is adequate to measure task cohesion within a team.
2. Team Cohesion Literature
Cohesion is an important emergent state that is usually defined as "a dynamic process which is reflected in the tendency for a group to stick together and remain united in the pursuit of its goals and objectives" [12]. This construct has been studied at both the individual and group levels [13] and has been linked to group performance [14]. Moreover, the strength of this relationship seems to be affected by the group’s task [15].
In comparison with co-located teams, virtual teams tend to be less cohesive [5], although the performance in both types of teams is essentially the same, even when different tasks are considered. Group cohesiveness in any type of team seems to increase over time, particularly when there is a leader in the group [16]. Other elements that affect group cohesiveness include team size, degree of democratic behavior within a group, participation, and satisfaction [17].
However, strong group cohesion may not always be a positive thing for a team. For example, [17] shows that high social cohesion within a group can sometimes lead to poor performance. One explanation for this negative relationship is that a team with high social cohesion may actually lead to high levels of group conformity and a reluctance to criticize a teammate’s performance.
If such a condition persists, then high social cohesion values will eventually lead to lower performance.
Although researchers use similar words to describe the cohesion construct, they generally use different techniques to measure levels of cohesiveness among groups. One highly cited work [18] describes using the Group Environment Questionnaire (GEQ) to measure different levels of cohesion within groups. In this particular study, the authors propose measuring cohesion levels across four different dimensions: Group Interaction - Task (GIT), Group Interaction - Social (GIS), Individual Attraction to the Group - Social (ATGS), and Individual Attraction to the Group - Task (ATGT). Other researches propose similar dimensions and use surveys to measure their different group cohesiveness constructs [4] [19] [20] [21].
2.1. Related Work on Cohesion Measures
In addition to measuring group cohesiveness through surveys and self-reports, researchers have also devel-oped techniques for measuring the quantitative aspects of a team’s interactions. More specifically, [22] calcu-lates group cohesion using a Social Network Analysis technique that creates weighted links between partic-ipants based on the number of messages exchanged. Once these adjacency matrices are computed, the authors establish a group cohesion score by looking at only the links that have weights higher or equal to a pre-defined number. They argue that this particular measure is able to detect the position of the agents for a specific level of communication.
Another cohesion measure, called Linguistic Style Matching (LSM), was developed by [20]. This particular measure is based on the similarity of the use of function words between two individuals. Once all paired similarities among group members are computed, the paired values in a group are then averaged, and this number becomes the group cohesiveness score. Using this technique, the researchers found a correlation between LSM and the cohesion construct, and a limited relation between LSM and performance. This particular study tested the LSM measure using chat communications generated during a one-hour session from single gender teams. However, researchers who have applied LSM to the analysis of email messages among team members over an extended period of time were unable to duplicate the significant relationship between cohesion and performance [23].
In this paper, we use survey data and a form of LSM to measure different aspects of group cohesiveness. The survey described in the paper was developed by [8] and was based on the GEQ survey. This particular survey measures cohesiveness among work groups along three different constructs: GIT, GIS and ATGS. In this paper we report on only the GIT results. The four items
2 EAI Endorsed Transactions on
Collaborative Computing 12 2015 | Volume 1 | Issue6 | e2
EAI
European Alliancerelated to the GIT were measured using a 9-point scale. In addition to the survey data, we used a form of LSM to measure (and display) cohesion among group members. A more detailed description of how this is incorporated into our study can be found in Section 4.4 of this paper. Related literature describing various feedback characteristics now follows.
3. Related Feedback Literature
As explained in [24], feedback can take on many different forms and uses. Thus, it is important to look at the literature on feedback to determine which characteristics are most important when developing a display that is intended to increase team interactions. Below is a description of a number of characteristics that have been suggested by researchers in the feedback literature. In our opinion, these characteristics represent some of the best formal research thinking about developing effective feedback systems.
3.1. Characteristics of Effective Feedback
[10] recommends providing feedback about how well the user is progressing toward the accomplishment of a specific task. On the other hand, [25] suggests giving users two types of feedback: outcome feedback that relates to how well the person is doing on the task; and processfeedback that captures how well the individual is developing. Both types of feedback seem to be related to performance. Although the literature recommends that both outcome and process feedback should be offered, it is not always practical to display advice about a project’s outcomes, particular if the feedback must be presented in real-time. Thus, providing process feedback becomes a more realistic option for a real-time system.
According to [26], feedback should be simple and clear. Large amounts of feedback information can often be confusing, because it may seem irrelevant to a specific task or event. According to researchers, it is especially important that automatically-generated feedback systems provide clear explanations about how the display information is calculated, and how it changes over time [24].
[27] recommends avoiding any feedback that might be construed as a normative comparison, because this type of information may discourage participants from pursuing the task. On the other hand, [24] argues that sharing individual information about others’ performances can support adherence to social group norms.
The research literature also suggests that feedback can be displayed either immediately or delivered at a later time. If something requires a user’s attention in real-time, then immediate feedback is preferred [28]. However, immediate feedback can sometimes make
individuals focus on the feedback system rather than on the task. Moreover, delayed feedback can be effective if it is provided in a timely manner, such as just before a milestone or a specific date [29]. For example, software development teams often hold a daily Scrum in order to improve the communications among team members [30]. This type of daily event provides team members with not only necessary feedback but also a routine that helps set the pace for task completion.
In a formative feedback system, the intervention usually occurs at a specific time (either immediate or delayed) [27]. The consistency in the timing of the feedback allows the user to remain focused on the task. However, in an automatic real-time system, the intervention is continuous, which means that the user’s attention may be divided between the task and the feedback display. Thus, a real-time feedback system must somehow provide the desired information without interfering with the user’s engagement in the collaborative exercise [31].
One of the obvious characteristics of an effective feedback system is a good design. An example of this type of exacting development process is presented in [24], which describes the process that was used to develop a feedback tool called GroupMeter. The paper highlights the different design phases and relates the reasons why particular decisions were made. In the end, the authors found that a simple, but playful, display was the best design element to use in their feedback system.
3.2. Related Work on Feedback and Groups
Given the amount of research that has examined the efficacy of providing feedback to individuals, it is not surprising to find that there are studies that have looked at the specific relationship between feedback and groups. In [11], the researchers report on using Social Network Analysis (SNA) to provide feedback concerning a team’s communication activities. Teams working on a specific task were provided information about the group’s centrality, reciprocity, density (cohesion) and centralization after each session of work (a total of four). The researchers found that all forms of feedback tended to increase the number of messages that were generated by group members.
Another example of a feedback system that is aimed at supporting group activities is described in [31]. This particular system was designed to provide feedback concerning a group’s positivity, engagement, information exchange and participation levels. Data for these categories were obtained through the use of the Linguistic Inquiry and Word Count (LIWC) tool [32]. This particular software analyzes each word in the text, and a total count of all values is kept for a particular category. From these counts, one can determine trends
3 EAI Endorsed Transactions
on Collaborative Computing 122015 | Volume1 | Issue6 | e2
EAI
European Alliancein conversations and/or discussions for individuals and groups. As can be seen from the study, analyzing word usage in a group’s communications can lead to a better understanding of group cohesiveness. Once the communications were analyzed, the authors provided feedback to groups through a simple text display that explained how well a group was performing on each of the four cohesion constructs. After several studies, the authors concluded that providing groups with feedback concerning their levels of engagement and information exchange had positive effects. Both types of feedback had a significant relationship to the type of words that were used during the group discussion.
Thus, the literature on feedback systems and group cohesiveness suggests that providing groups with information about their interactions can lead to changes in group behavior. However, there remain many questions about which elements of a feedback display are most effective, and what specific group behaviors are most impacted by the feedback? For example, [31] reports that students were unhappy with the immediate feedback pop-up displays, yet [28] recommends presenting feedback in a timely manner. Despite the many studies on feedback, formal research on the relationship between feedback and group cohesion is still small. In order to address this need, we present a study that looks at the effects of feedback on global software development teams.
4. Research Methodology
4.1. Teams
The students who participated in this study were drawn from two remotely-located universities; one group came from the University of North Texas (UNT) in the US, and the second group came from the Universidad Politecnica de Altamira (UPA) in Mexico. US participants were all enrolled in a Human-Computer Interface course, and the Mexican participants were enrolled in a Database design course. Initially, 75 students participated in this project: 35 students from UNT and 40 from UPA. However, two of the Mexican students dropped the database course after the first week of the project, leaving a total of 73 participants.
Prior to the start of the project, students from both universities completed a Software Development Skill Survey in which subjects were asked to rate their competency in the different areas of software development such as Java proficiency and knowledge of database design. Responses on this survey were averaged, and an Individual Skill Level score (ISL) was assigned to each student who participated in the study. These scores were then used to place the students into the various work groups. After sorting each school’s students by ISL score, 1-2 students from the top of
the list were paired with a student from the bottom of the list. Once each country’ teams were assembled, a Gini index was calculated for each country-team on the two lists. (A Gini index is a measure of inequality [33] which we used to operationalize member diversity). Each university’s country-team list was then sorted by their Gini index, and country-teams with similar Gini indexes were then combined into a single team. Using this procedure we were able to create 15 teams. A more detailed description of the composition of each team can be found in Section5.
4.2. Software Development Project
Each team was asked to complete the same software development project. The assignment consisted of a redesign of an existing non-profit website. More specifically, students were asked to redesign three sections of the website (i.e., the home page, the events page, and the contribution page) and implement a database that could support the various operations that were needed to maintain the pages. The responsibilities for completing this task were divided among the two teams: UNT members developed the website front-end, whereas UPA members designed and implemented the database. Moreover, the project deliverables were further divided into four separate milestones as indicated below:
1. Team members introduced themselves to each other; exchanged information about requirements (UNT students); created an Entity-Relationship diagram for the database (UPA students). Dura-tion: 6 days.
2. UNT members re-designed and created the new home page, and UPA members implemented the database. Duration: 8 days.
3. UNT members created remaining website mod-ules and UPA members provided database queries. Duration: 7 days.
4. All members collaborated to finish the project. Duration: 7 days.
Members were reminded to complete their mile-stones on time, and checks were made to ensure that members complied with these instructions.
4.3. Collaboration Tools
Students who participated in the project were asked to communicate with one another using a project management web application based on the Redmine platform. The Redmine application platform supports several collaborative tools including chat, forums, wikis, document sharing, etc. Moreover, this particular Redmine application has been enhanced so that
4 EAI Endorsed Transactions on
Collaborative Computing 12 2015 | Volume 1 | Issue6 | e2
EAI
European AllianceFigure 1. Control, individual behavior and outcome variables at individual level.
it records and timestamps all interactions among group members and transfers this information to a centralized database. Additional refinements were made to the Redmine tool in order to provide feedback to some groups concerning their collaborations and participation levels. A description of this special module can be found in Section4.5.
In addition to the Redmine software, each team had access to a MySQL server, which allowed them to create and populate a database, as well as a web server, which allowed teams to publish their web pages.
4.4. Measures
In order to determine the effects of feedback on global software development teams, we examined a number of variables that capture different characteristics of a team’s interactions. The list of variables are shown in Figure1.
Control Variables. The Control variables used in this study were University, Team size, Country-team size, Individual skill level. Section 5 provides more details concerning each of these variables.
Individual Behaviors. The Individual Behaviors of inter-est to this study were: Communications, Response rate, Individual cohesion, and the Linguistic-categories. For example, the total number of messages generated by a group has been used as a dimension of team per-formance [4]. Thus, we defined a measure called Com-municationsto represent the total number of messages generated by team members.
The Response rate measure was operationalized by counting the number of replies made to messages in the chat and forums for each individual. A reply was defined as either a chat message or forum post that was sent by an individual who was different from the sender of the previous chat-message or forum-post (i.e., a sequence of chat-messages or forum-posts from the same author were counted as 1).
To show how much (or how similar) teammates were responding to one another’s communications, we created an Individual cohesion measure. This measure was calculated by summing messages between each pair
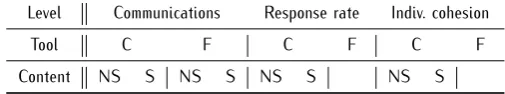
Table 1. Level of analysis of Communications, Response rate and
Individual cohesion. Where C means Chat, F means Forum, NS means Non-social and S means Social
Level Communications Response rate Indiv. cohesion
Tool C F C F C F
Content NS S NS S NS S NS S
of individuals on a team, as follows:
cohesionij = 1−
abs(rij−rji)
rij+rji
(1)
Where rij are the replies sent from member i to
member j. An Individual’s cohesion was then obtained by averaging all the paired cohesion values, as show in equation2.
cohesioni =
P
j∈M,j,icohesionij
|M| −1 (2)
Wherejare the teammates ofiin teamM. For a group-level measure, all team member’s Individual cohesion values were averaged (see equation3).
group_cohesion=
P
i∈Mcohesioni
|M| (3)
These measures were based on the similarity measure proposed in [20]. The scores on each of these measures range between 0 and 1, with a 1 representing perfect cohesion.
Communications, Response ratesand Individual cohe-sionmeasures were also analyzed at the individual tool level [i.e., messages using either the (C)hat or (F)orum tool]. Moreover, these three measures were divided even further into those chat and forum communications that referred to Non-Social (NS) and (S)ocial1 content (see table 1). For example, we separated the chat room messages that were non-social and identified them as Non-social-chat-communications. The Non-social/Social Forum messages for the Response rates and Individual Cohesion measures were not included in this study because the levels of participation of Feedback groups in the forums was too low (as reported in the next section).
TheLinguistic word categorymeasures were obtained by applying the sentiment analysis software (LIWC) [32]) to the group transcripts generated during this project. LIWC was utilized for this project because it looks at different linguistic features that characterize
1A message was counted as Social, if according to its LIWC Social
category value, it obtained 50% or higher. Otherwise, it was counted as Non-social.
5 EAI Endorsed Transactions Collaborative Computingon
122015 | Volume1 | Issue6 | e2
EAI
European Alliancedifferent individuals and groups. Through such a procedure, we were able to extract both an individual and a group’s use of different linguistic categories.
Outcome Measures. The two Outcome measures used in this study wereTask cohesion and Performance. Task cohesion is a measure of a team’s perception of their level of commitment to complete the task. At the end of the project, Task cohesion scores for this project were calculated by averaging an individual’s responses on a 4-item Task Cohesion survey, as described in [8]. We also calculated Group task cohesion scores by aggregating the individual surveys by team, as described in Section5.4.
Performance scores were obtained by examining the individual grades assigned to students after the completion of the project. Each country team (i.e., UNT and UPA) was assessed separately by its corresponding course professor. That is, UNT students were graded by the US instructor, and UPA students were graded by the Mexican instructor. To avoid any inconsistencies between the two evaluation procedures, grades for all students were normalized by their university values. Moreover, Team grades were obtained by averaging students’ individual grades for each group, as described in Section5.4.
4.5. The Feedback Display
In order to determine the effect of feedback on teams, we created a special graphic that appeared in the chat module that resides within our collaborative tool. We chose the chat module for the feedback display because previous experience showed that this is the most frequently used tool for collaborations [34]. This particular module was designed to provide information about how a team was collaborating throughout the project. Following the recommendations suggested in [24], the special feedback visual was designed to consist of four elements (see Figure2):
1. A piece of text showing the group’s current cohesion level. This number is computed using theGroup cohesionformula.
2. A piece of text showing an individual student’s percentage of Individual participation. This num-ber is computed as a proportion of the numnum-ber of replies sent by the individual student over the total number replies sent by the team.
3. A graph that displays the group’s current cohesion level. The graphic consists of a central node (in a light gray color) surrounded by other nodes (in dark gray colors), which represent the teammates of the current viewer. The central node represents the position where, ideally, all nodes should be when a team has perfect cohesion
Figure 2. Cohesion-based feedback display.
(Group cohesion measure = 1). Edges represent the inverseIndividual cohesionmeasure of a team member associated with its teammates (i.e. when an individual’s cohesion measure is close to 0, its node is far from the central node). The cohesion level of current viewer of the feedback display is represented as a light blue node.
4. A text describing the above graph.
The feedback display was designed to provide students with a more focused understanding of their group’s communication activities. For example, the graph shows how closely the user (represented as the blue node) and their group (represented as the dark gray nodes) relate to ideal cohesiveness (represented as the center, light gray node). While such information may discourage some students, as suggested in [24], we believed that showing teams opportunities for improvement could motivate them to move in those directions.
In addition to the graph, the display also reports on a student’s individual participation rates in comparison to the total participation of the team. This information is not only helpful to the individual, but it is designed to offset any negative effects brought about by the group cohesiveness graph, since an individual can always control their own behavior, but perhaps not their team’s behavior. These types of mixed reviews concerning the effects of feedback are reported in [25] and [35].
The cohesion-based feedback display was provided to eight of the fifteen teams who participated in the study. These eight teams were randomly selected and
6
EAI Endorsed Transactions on Collaborative Computing 12 2015 | Volume1 | Issue6 | e2
EAI
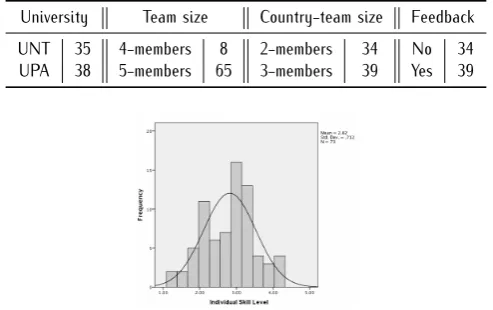
European AllianceTable 2. Control variables
University Team size Country-team size Feedback UNT 35 4-members 8 2-members 34 No 34 UPA 38 5-members 65 3-members 39 Yes 39
Figure 3. Individual Skill Level distribution.
designated as the Feedback teams. Seven teams received no feedback through Redmine and were, therefore, designated as the No-Feedback teams. Teams assigned to the Feedback group received an email describing the information contained in the feedback display at the beginning of the project. Once the project began, the feedback displays were updated every two hours.
5. Data Analysis
A total of 2831 messages were sent during this project: 2636 chat messages, 195 forum posts and 0 wiki pages. A total of 71, out of a possible 73,Task Cohesionsurveys were received, with an internal consistency of 0.807 (Cronbach’s alpha).
The total number of participants for each of the control variables is listed in Table2. Moreover, Figure3
reports the overall distribution levels of student scores on the Individual Skill Level survey. The mean for subjects completing the Individual Skill Level survey was 2.82 (SD = 0.712).
Unless otherwise specified, the following correlations that are reported were controlled by University, Team size, Country-team size and Individual skill level. In addition, the presence or absence of Feedback was operationalized with a dummy variable (1 or 0).
5.1. Feedback Effect on Individual Behaviors
We anticipated that overallCommunications would be higher in Feedback teams than in No-Feedback teams. The results from a partial correlation analysis show a marginal and positive relationship between Feedback andCommunications(r= 0.1872,p= 0.0623). When the
2r measures the strength and direction of a linear relationship 3p-value is defined as the probability of obtaining a result equal to
the proposed hypothesis
Figure 4. Comparison of Feedback and No-Feedback teams on
Communication-related measures.
communication variables were analyzed at the tool-level (i.e., Chat and Forum communications), we found a positive correlation (r= 0.206, p <0.05) between Feedback teams and Chat communications. The corre-lation between Feedback and Forum communications, however, was negative (r=−0.204,p <0.05). Feedback
seems to have affected the total number of Communi-cations as well as the Chat communiCommuni-cations generated by Feedback teams. The negative relationship between Feedback and Forum communications can be explained by the fact that Feedback teams had a much greater preference for the Chat tool as opposed to the Forum tool. Since our Feedback graphic was displayed within the Chat tool module, it seems reasonable to assume that the Feedback teams were more likely to keep returning to the Chat tool for their group information rather than use the Forum tool.
WhenChat and Forum Communicationswere analyzed at the linguistic level, we found that there were no correlations between Feedback and Social-Chat-Communications or between Feedback and Social-Forum-Communications. On the other hand, there was a significant relationship between Feedback teams and Non-social-Chat-Communications (r= 0.214, p <0.05), and between No-feedback teams and Non-social-Forum-Communications(r=−0.196,p= 0.053). As [2] reports,
the low level of social communication is expected in virtual teams, since they tend to have weaker social cohesiveness than face-to-face groups. However, both Feedback and No-Feedback groups seem to use non-social messages to communicate about the task. A more graphic illustration of the relationships that we found can be seen in Figure4, which shows a comparison of the means of Feedback and No-Feedback groups on all the communication-related measures.
It was also hypothesized that the feedback display would affect a team’s Response rates. Results of partial correlations between Feedback and the different response-rate measures indicate that Feedback was significantly and positively related to overallResponse Rates (r= 0.262, p <0.05), Chat-Response-Rates (r=
0.296, p <0.01), and Non-social-Chat-Response-Rates
7 EAI Endorsed Transactions on
Collaborative Computing 12 2015 | Volume 1 | Issue6 | e2
EAI
European AllianceFigure 5. Comparison of Feedback and No-Feedback teams on Response Rate (RR) -related measures.
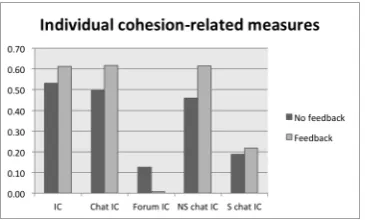
Figure 6. Comparison of Feedback and No-Feedback teams on
Individual Cohesion (IC) -related measures.
(r= 0.306, p <0.01). As anticipated, feedback teams
had fewer responses within the forums, and so the relationship between Feedback and Forum-Response-Rateswas negative (r=−0.298,p <0.01). Lastly, there
was no correlation between Feedback teams and Social-Chat-Response-Rates (r= 0.105, p= 0.194). Again, the mean comparisons of Feedback and No-Feedback teams on each of the Response-Rate measures can be seen in Figure5.
Results also indicate that Feedback teams were much more cohesive than Non-Feedback teams. A partial correlation analysis of Feedback teams and Individual Cohesion rates indicate that individuals in Feedback teams were significantly more cohesive than individuals in No-Feedback teams (r= 0.183,
p= 0.066). This higher cohesiveness extended to all chat communications (r= 0.260, p <0.05), and to those chat communications related to non-social messages (r= 0.330, p <0.01). Not surprising, Forum-Individual-Cohesion was negatively correlated with Feedback teams (r=−0.369,p <0.01), and Social-Chat-Individual-Cohesion was not correlated with Feedback (r= 0.014,p= 0.455). The mean comparisons between Feedback and No-Feedback teams on the Individual Cohesion measures are presented in Figure6.
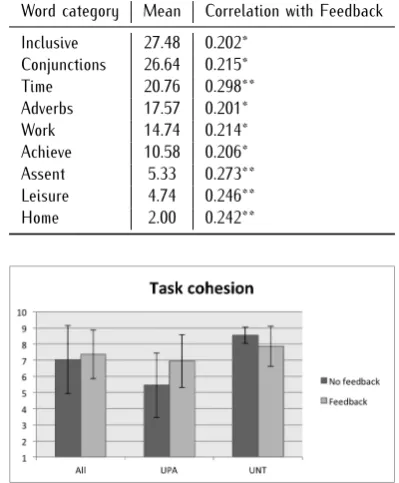
To further understand the effects of feedback on global software teams, we examined the content of the messages that were sent between team members. As
noted earlier, we used the LIWC software to deter-mine the frequency of different Linguistic categories within Feedback and No-Feedback teams. Correlations between the different word categories and Feedback teams are presented in Table 3. As the table shows, there were significant correlations between nine word categories and Feedback teams.
Interestingly, the words used most frequently in this project were related to the inclusive category. This category contains words such as add, and, we [36]. Moreover, the single word that was most frequently used in this category was the we word – 396 times in Feedback teams, and 260 times in No-Feedback teams. The heavy use of the we word suggests that groups in both Feedback and No-Feedback were starting to act (and think) as a team. Also, the use of we has been shown to have a relationship to hard work in organizations [37].
Conjunction words were also used quite frequently within the global teams. This category shares a number of words with theinclusiveword-type such asand,with, together. There was a high correlation between both categories (r= 0.945, p <0.001). This word category is related to narrative thinking, which is a trait often associated with people who have good social skills.
The Time category contains words such as today, tomorrow,now,yesterday,date. Thus, the substantial use of these types of words suggests that Feedback teams were very aware of schedules and the passing of time, which was probably related to the group’s efforts to complete the task.
TheWorkandAchievementcategories have a number of words in common such asaccomplish,work,success, team. As a result of these shared words, it is not surprising that there was a strong correlation between these two categories (r= 0.854, p <0.001).
The Assent category includes words such as agree, ok, yes, yeah,haha,cool. The high correlation between Feedback teams and the assent category suggests that members within Feedback teams had similar opinions, and they tended to agree with one another more than members in Non-Feedback teams. However, frequent agreement has also been associated with passivity, as reported in [38].
Categories of leisure and home were also strongly related to Feedback teams. Words related to these two categories generally indicate that the group is engaged in non-work related communications. The presence of words from these two categories suggests that members within Feedback teams were more likely to share social or personal information with one another than those members in No-Feedback teams.
8 EAI Endorsed Transactions
on Collaborative Computing 122015|Volume1|Issue6|e2
EAI
European AllianceTable 3. LIWC categories with significant differences. *p<0.1, **p<0.05
Word category Mean Correlation with Feedback Inclusive 27.48 0.202*
Conjunctions 26.64 0.215* Time 20.76 0.298** Adverbs 17.57 0.201* Work 14.74 0.214* Achieve 10.58 0.206* Assent 5.33 0.273** Leisure 4.74 0.246** Home 2.00 0.242**
Figure 7. Comparison of Feedback and No-Feedback teams on
Task Cohesion values.
5.2. Effects on Outcome Variables
We also analyzed the relationships between Feedback and the two outcome variables of Task cohesion and Individual grades. Results showed that Feedback had a positive correlation with Task cohesion, but it was not significant (r = 0.118, p = 0.110). Overall mean values on the Task Cohesion survey were much higher for Feedback groups than No-Feedback groups (mean difference = 0.3295). Moreover, a Levene’s Test of the data revealed that there was a significant difference between the variances of Task Cohesion values of No-Feedback teams and No-Feedback teams (p <0.05) (see Figure 7, column All). Given this high variance, we analyzed the Task Cohesion responses by university and feedback type and found that the UNT students assigned to the No-Feedback teams had much higher perceived values of task cohesion than UPA students in No-Feedback teams, while the differences between the Task cohesion scores in the two universities was much lower in Feedback teams. Therefore, this result suggests that task cohesion’s perception was shaped by the feedback display.
It was suspected that students who received feedback would also receive higher grades on their global software development projects. However, a partial correlation analysis found that Individual Gradeswere unrelated to Feedback (r= 0.026, p= 0.415), and that
Table 4. Correlations between communication- and
response-rate- measures and Individual grades. *p <0.01, **p <0.001
Individual grades
Communications Response rate
All 0.345* 0.336*
Chat 0.337* 0.350*
Forum 0.122 -0.124
Social chat 0.363* 0.464** Non-social chat 0.319* 0.003* Social forum 0.148
Non-social forum 0.107
the variance between the Feedback and No-Feedback groups was not significant.
5.3. Effects of Other Measures on Outcome Variables
Since this study found significant relationships between Feedback and the various Communication and Response rate variables (see Section II), we anticipated that there might be similar correlations between the communication and response-rate measures and our outcomes measures (i.e., Task Cohesion and Performance). Partial correlations (controlled by University, Team size, Country-team size, Individual Skill Level and Feedback) between the Communication variables and Task cohesion, and between theResponse ratemeasures andTask cohesionproduced no significant relationships. However, as indicated in Table 4, all Communication and Response rate variables (except forum communications) had a positive and significant relationship to Individual grades. While individual communication behaviors do not appear to affect how an individual "feels" about their group and the task, they do seem to affect how well an individual "performs" the task.The Individual cohesion measures used in this study capture the response rate similarity between an individual and his/her teammates. As such, it was assumed that there would be strong correlations between the Individual cohesion measures and the Task cohesion construct. Thus, we calculated partial correlations between Individual cohesion and Task cohesion, while controlling for University, Team size, Country-team size, Individual Skill Level and Feedback. Results indicate that Individual cohesion rates (except forum and social chat cohesion levels) were strongly related to a group’s perception of how well they were committed to completing the task. Evidence for this relationship is strongest among individual cohesion and chat cohesion levels, particularly as they pertain to non-social activities (see Table5).
We also related the Individual cohesion measures to individual grades while controlling for University, Team size, Country-team size, Individual Skill Level and
9 EAI Endorsed Transactions Collaborative Computingon
12 2015 | Volume 1 | Issue6 | e2
EAI
European AllianceTable 5. Correlations between Individual cohesion measures and Task cohesion. *p <0.1, **p <0.05
Task cohesion
Individual Cohesion 0.214* Chat Individual Cohesion 0.215* Forum Individual Cohesion 0.005 Social chat Individual Cohesion 0.135 Non-social chat Individual Cohesion 0.265**
Table 6. Correlations between Individual cohesion measures and
Individual grades. *p <0.001
Individual grades
Individual Cohesion 0.412* Chat Individual Cohesion 0.432* Forum Individual Cohesion -0.079 Social chat Individual Cohesion 0.468* Non-social chat Individual Cohesion 0.426*
Feedback (see Table 6). Correlations show that all of the Individual cohesion measures predict individual performance, except forum messages.
The relationships between the Individual cohesion measures and Task Cohesion supports the notion that a group’s perception of how well they are doing on a task is shaped by a person’s response activities [8]. In addition, the strong positive relation between the cohesion measures and Individual gradesdemonstrates the link between response levels within a group and individual performance.
5.4. Group Cohesion and Outcome Variables
Since the results showed that students who had more interactions with their teammates not only performed better but also had better perceptions of their team’s ability to accomplish the task, it was anticipated that a group-level analyses of these variables would achieve similar results. Prior to running the analysis, however, it was necessary to determine how to aggregate the data and, at the same time, adjust for the large variation between UNT and UPA responses on the Task Cohesion survey. Techniques suggested by [39] indicate that the variance problem can be overcome by treating each country team separately. Therefore, we aggregated Task cohesion, Individual cohesion, Chat-Individual-Cohesion, Non-social-Chat-Individual-Cohesion and Individual grades for each team at each university and labeled these new variables as Group Task Cohesion, Group Cohesion,Group Chat-Cohesion,Group Non-social-Chat-CohesionandTeam Grade, respectively.
Correlations, as shown in Table 7, were controlled by Team size, Country-team size, Feedback and average of Individual Skill Level. Results show that only Group
Table 7. Correlations between Group Cohesion, Chat Group
Cohesion, Work-Chat Group Cohesion, Group Task Cohesion and Team Grades. *p <0.1, **p <0.05, ***p <0.01
Group Task Cohesion
Team Grades Group Cohesion -0.181 0.425** Chat Group Cohesion -0.087 0.466*** Non-social Chat Group Cohesion 0.307* 0.587***
Non-social-Chat-CohesionpredictsGroup Task Cohesion. On the other hand, all group cohesion measures were significantly correlated withTeam grades.
It is important to note thatGroup Task Cohesionand Team grades were not correlated (r= 0.168, p= 0.187). A possible explanation for this result is that student responses on the Task Cohesion surveys represent an individual’s perceptions of the "global" team, whereas Team grades represent student performance at the university level. While teams may have perceived that the global team was capable of completing the task, a specific country team may not have performed as well as other teams within the same country.
6. Feedback effects on pacing
Our previous results showed that the feedback display had an effect on the number of communications gen-erated by members who received feedback information. Since the feedback system showed a number of different types of information, it was important to determine which one provoked the change of behavior in partici-pants’ communications. In addition, it is also important to determine whether there was a difference between the effects of positive versus negative feedback.
6.1. Pacing definition
The feedback effect on participants’ communications was defined as the average pacing and was computed by taking the average time between the next three messages that were sent by a user who had just received a specific type of feedback (see Figure 8). It was assumed that every time a user sent a chat message, he or she also had been exposed to the feedback information. Pacing was defined as the number of seconds between any two chat messages sent by a user. This calculation was based on [40], which assessed the effects of positive and negative feedback on the quality of future post in online news communities.
6.2. Feedback information
We identified four specific variables presented to the participants in the feedback system: 1) Group cohesion was a numerical value between 0 and 1; 2) Individual
10 EAI Endorsed Transactions on
Collaborative Computing 122015|Volume1|Issue6|e2
EAI
European AllianceFigure 8. Feedback effect on pacing.
Table 8. Descriptive statistics for feedback variables.
Feedback variable Mean Std. Dev. Min Max Group cohesion 0.3729 0.1728 0 0.8474 Individual participation 0.3100 0.1392 0 0.9999 Individual cohesion 0.2899 0.1956 0 0.9999
Position 2.98 1.39 1 5
participationwas a numerical value between 0 and 100; 3) Individual cohesion was a numerical value between 0 and 1, presented graphically to the user as the proximity of a user’s node to the center (ideal cohesion); 4) Positionwas the visual comparison of a member to the rest of the team, and defined as a value between 1 (closest to the center) and 5 (farthest to the center).
Only data from teams with 5 members was used in this analysis, so that the Position values would be comparable. In total, we obtained 1193 user’s average pacingvalues, after being exposed to a specific combination of feedback variables. The descriptive values for each feedback variable is shown in Table8.
6.3. Positive and negative feedback
Every feedback variable was converted to a binary label: positive or negative.
Group cohesionwas labeled as positive when its value was higher or equal than 0.5; otherwise, negative.
Based on their descriptive values,Individual partici-pationwas labeled as positive when its value was higher or equal to 0.4; negative, when its value was lower or equal to 0.2; otherwise, it was not used in the analysis.
Similarly,Individual cohesionwas labeled as positive when its value was higher or equal to 0.4; negative, when its value was lower or equal to 0.2; otherwise, it was not used in the analysis. We decided to separate positive and negative feedback by 0.20, since this variable measures a graphical perception that may be affected by Weber’s law [41] (i.e., very small changes may not have been perceptible).
Position was labeled as positive when its value was higher or equal to 4; negative, when its value was lower or equal to 2; otherwise, it was not used in the analysis.
Table 9. Instance distribution in feedback variables.
Feedback variable Positive Negative Group cohesion 43 195 Individual participation 96 142 Individual cohesion 128 110
Position 78 160
Table 10. Linear model for estimating average pacing by
feedback variables and their interactions, controlled by university, skill and country-team size. GC means Group cohesion; IP means Individual participation; IC means individual cohesion; P means Position. *p<0.05.
Variable Mean square F Sig.
Intercept 3.E+10 3.024 0.083
University 1.0E+9 0.094 0.759
Skill 2.E+10 2.202 0.139
Country-team size 3.2E+10 0.030 0.863 Group cohesion 5.E+10 4.573 0.034* Individual participation 3.2+9 0.296 0.587
Position 2.4E+9 0.218 0.641
Individual cohesion 6.E+10 5.350 0.022*
GC+IP . . .
GC+P . . .
GC+IC . . .
IP+P 6.5E+9 0.603 0.438
IP+IC 2.1E+9 0.194 + 0.660
P+IC 3.2E+9 0.299 0.585
GC+IP+P . . .
GC+IP+IC . . .
GC+P+IC . . .
IP+P+IC . . .
GC+IP+P+IC . . .
As a result, we kept 238 instances for this analysis. Their distribution is shown in Table9.
6.4. Effects on future pacing
An univariate linear model was developed, using the binary feedback variables and their interactions. It was also controlled byuniversity,skill levelandcontry-team size. For its construction, we used the SPSS’s General Linear Model tool.
As shown in Table10,Group cohesionandIndividual cohesionvariables have a significant pacing effect when comparing positive and negative feedback.
Table 11 shows a comparison of students’ future pacing behavior after a user receives specific feedback. Based on these results, we observed that people who received negative group-cohesion feedback had higher pacing values than people who received positive group-cohesion feedback. Similarly, people who received negative individual-cohesion feedbackhad higher pacing
11 EAI Endorsed Transactions Collaborative Computingon
122015 | Volume1 | Issue6 | e2
EAI
European AllianceTable 11. Pacing mean comparison between positive and negative feedback on Group cohesion and Individual cohesion variables
Feedback variable Type Mean Std. Dev. Time Group cohesion Negative 55042.012 10351.0 15:17 Positive 101896.06 19274.4 28:18 Individual cohesion Negative 54593.049 13681.2 15:09 Positive 79030.238 11072.6 21:57
Figure 9. Comparison of previous pacing to future average
pacing.
values than people who received positive individual-cohesion feedback.
Therefore, it seems that construct-based feedback (Group cohesion and Individual cohesion) increases communication, specifically when negative feedback is provided.
On the other hand, it seems that the information about a subject’s relationship to other members of the team (i.e.,Position) was not important enough to modify pacing behavior consistently; which is contrary to the research suggested by [24]. Possibly, the existence of other, more informative feedback information may have interfered with this particular effect.
In addition, it seems that the measure-based individual feedback (Individual participation) had no effect on communication pacing. Again, it is possible, that other feedback elements were more useful to the student then this display element.
6.5. Change in previous pacing
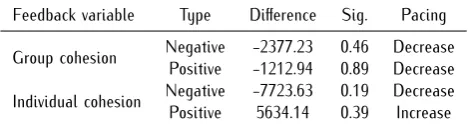
It is clear that in the previous results the pacing of people who received negative feedback was higher when they received positive feedback. However, it is possible that both positive and negative feedback can have an effect on the previous user’s pacing patterns. Thus, we decided to compare each of our dataaverage pacingvalues to its related previous pacing values (see Figure9).
As shown in Table12, none of the obtained results is significant. Probably, the effect of increasing or decreasing previous pacing is more apparent in the communication data collected immediately after the
Table 12. Differences in pacing after feedback exposure.
Feedback variable Type Difference Sig. Pacing Group cohesion Negative -2377.23 0.46 Decrease
Positive -1212.94 0.89 Decrease Individual cohesion Negative -7723.63 0.19 Decrease Positive 5634.14 0.39 Increase
Table 13. Differences in pacing after feedback exposure by
milestone. GC means Group cohesion; IC means Individual cohesion. *p<0.05.
Milestone Feedback Type Difference Sig. Pacing
I
GC Negative 6282.98 0.02* Increase Positive -45.01 0.93 Decrease IC Negative 22201.14 0.00* Increase Positive -589.77 0.89 Decrease
II
GC Negative 2466.89 0.54 Increase Positive -6418.87 0.62 Decrease IC Negative 6798.28 0.13 Increase Positive -11467.07 0.37 Decrease
III
GC Negative -8986.91 0.37 Decrease Positive 6601.05 0.54 Increase IC Negative 5119.67 0.77 Increase Positive 5746.81 0.57 Increase
IV
GC Negative 331.66 0.91 Increase Positive 2534.24 0.81 Increase IC Negative 1260.78 0.77 Increase Positive 4672.11 0.87 Increase
subject receives feedback as opposed to data collected much later in the project. Therefore, we computed the same difference by splitting the data into the project’s milestones.
Table13shows an increase in pacing when receiving negative feedback in Group cohesion and Individual cohesionduring the period of milestone I. However, this effect is not present during any of the other milestones. On the other hand, positive feedbackseems not to have affected the pacing patterns of students in any period.
7. Conclusion
Research on group dynamics has long established the relationship between a group’s cohesiveness and team performance [42]. While earlier studies focused on investigations of group cohesion within face-to-face teams, more recent research has shifted toward analyses of the cohesion construct within technology-supported teams that are distributed in different cities and even countries [4]. Due to time pressures, geographical constraints, or organizational structures, global virtual teams do not always have the opportunity to come together and establish a sense of group cohesiveness. Therefore, it seems appropriate to explore ways in
12 EAI Endorsed Transactions
on Collaborative Computing 122015 | Volume1 | Issue6 | e2
EAI
European Alliancewhich distributed technology can be used to provide feedback to global teams that will help them establish group cohesiveness.
In this study we examined the relationships between cohesion-based feedback and group behaviors and outcomes. A cohesion-based feedback module was developed and inserted into a distributed collaborative software system. This cohesion-based feedback module provided a graphic display of a group’s response rate similarities. The cohesion-based feedback display was then tested on students from the US and Mexico who were collaborating on a global software development project. Half of the teams received the feedback throughout the project, and half the teams received no feedback. Data obtained from the groups’ communication activities, Task Cohesion surveys, and individual/group grades were then analyzed and compared. Results indicate that students in the Feedback teams had significantly more overall communications, higher response rates, and more similar response behaviors (as measured by the Individual Cohesion variable) than No-Feedback teams. These Feedback effects could be seen in all types of chat messages, particularly those labeled non-social text messages.
Feedback was also found to affect the linguistic characteristics of a group. For example, Feedback teams were more likely to use words related to the work, time, and achievement categories than No-Feedback teams. At the same time, Feedback teams were more apt to use words linked to personal categories such as leisure and home as opposed to No-Feedback teams. Thus, while Feedback teams seemed more focused on the task, they also seemed more willing to engage in personal communications.
An analysis of the effects of Feedback on our outcome measures (i.e., Task Cohesion and Performance), however, was not significant. Students who viewed the feedback module, did not score higher on the Task Cohesion survey, nor did they receive higher grades on the projects. This result seems to suggest that increasing interaction among team members does not necessarily lead to better performance. Perhaps a more robust feedback system that included a link to different performance measures would result in improved group performance.
Although the study found no relationship between feedback and the outcome measures, it did find rela-tionships between some of our indirect measures and the outcome variables. While we found no signifi-cant relationship between either Communications and Task cohesion or between Response Rates and Task cohesion, both Communications and Response Rates affected Individual grades. We also looked for relation-ships between our cohesion-based measures and Task cohesion and Individual grades and found that ALL the
cohesion-based measures (except forum cohesion) were positively correlated to Task cohesion and Individual grades. The relationship was highest for cohesion-based scores that were related to non-social chat messages. This result suggests that the cohesion-based measure is an accurate predictor of both task cohesion and performance; thus reinforcing the notion that effective team collaborations will lead to more effective team performance and a more positive perception of group members.
In addition, the individual cohesion-based measures were aggregated to the group level to determine whether there were any relationships between the group-cohesion measures and the outcome variables. The large variation between UNT and UPA responses on the Task Cohesion survey indicated that the group-level measures could be combined at only the country (i.e., university) level. Analysis of the University-level variables indicated that only theGroup Non-social-Chat-Cohesionscores were significantly correlated with Task Cohesion, although all the Group-Cohesion scores were significantly related to Team Grades. Although these findings differ from the Individual cohesion results, they tend to confirm the relationship between the cohesion measure and performance. The relationship between a group’s overall response similarity and task cohesion remains an open question. There is also some question about how instructors evaluate team projects and how this might affect the results reported in studies of this type.
An analysis of the feedback variables and types (positive and negative), showed that participants had a higher pacing rate when sending chat messages after they were exposed to negative feedback; specifically, to Group cohesion feedback and Individual cohesion feedback. This suggests that Position within the team and Individual participation does not seem to have an effect on a team member’s behavior. This also indicates that construct-based feedback can be useful to modify behavior either as a numerical (Group cohesion) or graphical representation (Individual cohesion). A further analysis of pacing behavior for each milestone showed that pacing changed significantly during the project’s first time period, particularly for students who were provided negative feedback. However, the rest of the time periods showed no significant changes in pacing behavior. Possibly, negative feedback has the most effect on student’s pacing behavior when presented during the early part of the project. This pacing effect then gradually becomes a more consistent behavior (i.e., less difference) during subsequent stages of the project.
Although the results presented in this study occurred within an academic setting, we believe that many of the characteristics of the project are similar to real-world environments [43, 44]. For example, many industry-related group projects must cope with rational task
13 EAI Endorsed Transactions
on Collaborative Computing 122015 | Volume1 | Issue6 | e2
EAI
European Alliancedistributions, shared milestones, collaborative environ-ments with team-specific information, and distributed leadership. The presence of these characteristics in a team will, surely, affect the cohesiveness within a group. The cohesion measure described in this study, as well as the feedback display, could potentially help groups better understand what type of communication and feedback is most effective.
Finding a feedback display that will affect group performance has always been a concern for researchers in human-computer interactions. This study examines the effects of a cohesion-based display on group behaviors. The display was intended to provide group members with a clear vision of not only how their group was interacting, but also how they, as individuals, were contributing to the group, and how this contribution was being measured. A clear understanding among team members of how their group is interacting appears to facilitate a group’s communications, response levels, and individual cohesion scores. While our feedback module did not appear to significantly affect outcome measures, the cohesion-based measure that was used in the feedback display appears to be a good predictor of both Task Cohesion and Performance.
Acknowledgment
The first author gratefully acknowledges financial support from a CONACYT scholarship and from the Support for Graduate Studies Program of SEP. This material was also based upon work supported by the National Science Foundation under Grant No. 0705638.
References
[1] Herbsleb, J.D.andMoitra, D. (2001) Global software development.Software, IEEE18(2): 16–20.
[2] Powell, A.,Piccoli, G.andIves, B.(2004) Virtual teams: a review of current literature and directions for future research.ACM Sigmis Database35(1): 6–36.
[3] Agerfalk, P.J., Fitzgerald, B., Olsson, H.H. and ConchÞir, E.Ã. (2008) Benefits of global software development: the known and unknown. In Making Globally Distributed Software Development a Success Story (Springer), 1–9.
[4] Swigger, K., Nur Aplaslan, F., Lopez, V., Brazile, R., Dafoulas, G. and Serce, F.C. (2009) Structural factors that affect global software development learning team performance. InProceedings of the Special Interest Group on Management Information System’s 47th Annual Conference on Computer Personnel Research, SIGMIS CPR ’09 (New York, NY, USA: ACM): 187–196. doi:10.1145/1542130.1542167.
[5] Furumo, K. and Pearson, J. (2006) An empirical investigation of how trust, cohesion, and performance vary in virtual and face-to-face teams. In Proceedings of the 39th Annual Hawaii International Conference on System Sciences, 2006. HICSS ’06, 1: 26c–26c. doi:10.1109/HICSS.2006.51.
[6] McDonough, E.F.,Kahnb, K.B.andBarczaka, G.(2001) An investigation of the use of global, virtual, and colocated new product development teams. Journal of Product Innovation Management18(2): 110–120.
[7] Townsend, A.M.,DeMarie, S.M.andHendrickson, A.R. (1998) Virtual teams: Technology and the workplace of the future.The Academy of Management Executive12(3): 17–29.
[8] Carless, S.A.andPaola, C.D.(2000) The measurement of cohesion in work teams.Small Group Research31(1): 71–88. doi:10.1177/104649640003100104.
[9] Goodman, P., Ravlin, E. and Schminke, M. (1987) Understanding groups in organizations.Tepper School of Business.
[10] Kluger, A.N. and DeNisi, A. (1996) The effects of feedback interventions on performance: A historical review, a meta-analysis, and a preliminary feedback intervention theory. Psychological Bulletin 119(2): 254– 284. doi:10.1037/0033-2909.119.2.254.
[11] Gamberini, L.,Martino, F.,Spagnolli, A.,BaÃź, R.and Ferron, M.(2011) âĂIJyour team cohesion is lowâĂİ: A systematic study of the effects of social network feedback on mediated activity. In Hutchison, D., Kanade, T., Kittler, J., Kleinberg, J.M., Mattern, F., Mitchell, J.C., Naor, M. et al. [eds.] Online Communities and Social Computing (Berlin, Heidelberg: Springer Berlin Heidelberg),6778, 172–181.
[12] Carron, A.V. (1982) Cohesiveness in sport groups: Interpretations and considerations. Journal of Sport psychology.
[13] Gully, S.M., Devine, D.J.and Whitney, D.J.(1995) A meta-analysis of cohesion and performance effects of level of analysis and task interdependence.Small Group Research26(4): 497–520.
[14] Webber, S.S. and Donahue, L.M. (2001) Impact of highly and less job-related diversity on work group cohesion and performance: A meta-analysis.Journal of management27(2): 141–162.
[15] Kozlowski, S.W. and Ilgen, D.R. (2006) Enhancing the effectiveness of work groups and teams. Psy-chological Science in the Public Interest 7(3): 77–124. doi:10.1111/j.1529-1006.2006.00030.x.
[16] Schwanda, V.L., Barron, K., Lien, J., Schroeder, G., Vernon, A.andHancock, J.T.(2011) Temporal patterns of cohesiveness in virtual groups. InProceedings of the ACM 2011 Conference on Computer Supported Cooperative Work, CSCW ’11 (New York, NY, USA: ACM): 709–712. doi:10.1145/1958824.1958951.
[17] Rovio, E., Eskola, J., Kozub, S.A., Duda, J.L. and Lintunen, T. (2009) Can high group cohesion be harmful? a case study of a junior ice-hockey team. Small Group Research 40(4): 421–435. doi:10.1177/1046496409334359.
[18] Carron, A.V.,Widmeyer, W. andBrawley, L.R. (1985) The development of an instrument to assess cohesion in sport teams: The group environment questionnaire. Journal of sport psychology.
[19] Salisbury, W.D., Carte, T.A. and Chidambaram, L. (2006) Cohesion in virtual teams: Validating the perceived cohesion scale in a distributed setting. SIGMIS Database 37(2-3): 147–155.
14
EAI Endorsed Transactions on Collaborative Computing 122015 | Volume1 | Issue6 | e2
EAI
European Alliancedoi:10.1145/1161345.1161362.
[20] Gonzales, A.L., Hancock, J.T. and Pennebaker, J.W. (2010) Language style matching as a predictor of social dynamics in small groups. Communication Research
37(1): 3–19. doi:10.1177/0093650209351468.
[21] Carrington, P.J., Scott, J. and Wasserman, S. (2005) Models and methods in social network analysis, 28 (Cambridge university press).
[22] Reffay, C.andChanier, T.(2003) How social network analysis can help to measure cohesion in collaborative distance-learning. In Wasson, B., Ludvigsen, S. and Hoppe, U. [eds.] Designing for Change in Networked Learning Environments, no. 2 in Computer-Supported Collaborative Learning (Springer Netherlands), 343– 352.
[23] Munson, S.A., Kervin, K. and Robert Jr, L.P. (2014) Monitoring email to indicate project team performance and mutual attraction .
[24] Leshed, G.,Perez, D.,Hancock, J.T.,Cosley, D., Birn-holtz, J., Lee, S., McLeod, P.L. et al. (2009) Visual-izing real-time language-based feedback on teamwork behavior in computer-mediated groups. InProceedings of the SIGCHI Conference on Human Factors in Computing Systems(ACM): 537–546.
[25] Earley, P.C.,Northcraft, G.B.,Lee, C.andLituchy, T.R. (1990) Impact of process and outcome feedback on the relation of goal setting to task performance.Academy of Management Journal33(1): 87–105. doi:10.2307/256353. [26] Kulhavy, R.W. (1977) Feedback in written instruc-tion. Review of Educational Research 47(2): 211–232. doi:10.3102/00346543047002211.
[27] Shute, V.J. (2008) Focus on formative feedback. Review of Educational Research 78(1): 153–189. doi:10.3102/0034654307313795.
[28] Mason, B.J.andBruning, R.(2001) Providing feedback in computer-based instruction: What the research tells us.Retrieved February15: 2007.
[29] Scharff, C. and Verma, R. (2010) Scrum to support mobile application development projects in a just-in-time learning context. In Proceedings of the 2010 ICSE Workshop on Cooperative and Human Aspects of Software Engineering, CHASE ’10 (New York, NY, USA: ACM): 25– 31. doi:10.1145/1833310.1833315.
[30] Scharff, C. (2011) Guiding global software develop-ment projects using scrum and agile with quality assur-ance. In 2011 24th IEEE-CS Conference on Software Engineering Education and Training (CSEE T): 274–283.
doi:10.1109/CSEET.2011.5876097.
[31] Tausczik, Y.R.andPennebaker, J.W.(2013) Improving teamwork using real-time language feedback .
[32] Pennebaker, J.W.,Francis, M.E.andBooth, R.J.(2001) Linguistic inquiry and word count: LIWC 2001.Mahway: Lawrence Erlbaum Associates.
[33] Ogwang, T.(2000) A convenient method of computing the gini index and its standard error.Oxford Bulletin of Economics and Statistics62(1): 123–129.
[34] SerÃğe, F.C., Swigger, K., Alpaslan, F.N., Brazile, R., Dafoulas, G. and Lopez, V. (2011) Online collaboration: Collaborative behavior patterns and factors affecting globally distributed team performance. Computers in Human Behavior 27(1): 490–503. doi:10.1016/j.chb.2010.09.017.
[35] Tausczik, Y.R. (2012) Changing group dynamics through computerized language feedback .
[36] Pennebaker, J.W.,Chung, C.K.,Ireland, M.,Gonzales, A. and Booth, R.J. (2007) The development and psychometric properties of LIWC2007. Austin, TX, LIWC. Net.
[37] Pennebaker, J.(2013)The Secret Life of Pronouns: What Our Words Say About Us(Bloomsbury USA).
[38] Leshed, G.(2009)Automated language-based feedback for teamwork behaviors. Ph.D. thesis, Cornell University. [39] LeBreton, J.M. and Senter, J.L. (2007) Answers to
20 questions about interrater reliability and interrater agreement.Organizational Research Methods.
[40] Cheng, J.,Danescu-Niculescu-Mizil, C.andLeskovec, J. (2014) How community feedback shapes user behavior. In Eighth International AAAI Conference on Weblogs and Social Media.
[41] Weber, E.H. (1996) EH Weber on the tactile senses (Psychology Press).
[42] Mathieu, J., Maynard, M.T., Rapp, T. and Gilson, L. (2008) Team effectiveness 1997-2007: A review of recent advancements and a glimpse into the future. Journal of Management 34(3): 410–476. doi:10.1177/0149206308316061.
[43] Battin, R., Crocker, R., Kreidler, J. and Subra-manian, K. (2001) Leveraging resources in global software development. IEEE Software 18(2): 70–77. doi:10.1109/52.914750.
[44] Ebert, C. and De Neve, P. (2001) Surviving global software development. IEEE Software 18(2): 62–69. doi:10.1109/52.914748.
15 EAI Endorsed Transactions on
Collaborative Computing 12 2015 | Volume 1 | Issue6 | e2