P R O C E E D I N G S
Open Access
On combining family- and
population-based sequencing data
Yuriko Katsumata and David W. Fardo
*FromGenetic Analysis Workshop 19 Vienna, Austria. 24-26 August 2014
Abstract
Several statistical group-based approaches have been proposed to detect effects of variation within a gene for each of the population- and family-based designs. However, unified tests to combine gene-phenotype associations obtained from these 2 study designs are not yet well established. In this study, we investigated the efficient combination of population-based and family-based sequencing data to evaluate best practices using the Genetic Analysis Workshop 19 (GAW19) data set. Because one design employed whole genome sequencing and the other whole exome sequencing, we examined variants overlapping both data sets. We used the family-based sequence kernel association test (famSKAT) to analyze the family- and population-based data sets separately as well as with a combined data set. These were compared against meta-analysis. Using the combined data, we showed that famSKAT has high power to detect associations between diastolic and/or systolic blood pressures and the genes that have causal variants with large effect sizes, such asMAP4,TNN, andCGN. However, when there was a considerable difference in the powers between family- and population-based data, famSKAT with the combined data had lower power than that from the population-based data alone. The famSKAT test statistic for the combined data can be influenced by sample imbalance from the 2 designs. This underscores the importance of foresight in study design as, in this situation, the greatly lower sample size in the family-based data essentially serves to dilute signal. We observed inflated type I errors in our simulation study, largely when using population-based data, which might be a result of principal components failing to completely account for population admixture in this cohort.
Background
Whole genome and whole exome sequencing studies provide the resolution necessary to identify both mon and rare genetic variants associated with com-plex disease phenotypes. It is well known, however, that single-variant tests are underpowered for rare variants, and several group-based approaches have been proposed to address this [1–3]. In addition to combining association signals across a genetic region/ group (eg, a gene), it is often necessary to combine these signals across, sometimes disparate, data sets. This is frequently done via meta-analysis where sum-mary statistics are calculated within each data set and aggregated to conduct inference [4]. An alternative is
mega-analysis [5, 6] where raw data are shared be-tween studies. To conduct mega-analysis, the statis-tical framework for each study must be the same, which poses difficulty when some component studies are family-based and others recruit only unrelated in-dividuals. There is currently no consensus on which approach is superior, and the comparison most likely depends to a large degree on the specific setting and various unknowns such as the study-specific genetic architectures.
A popular test for conducting region-based associ-ation testing, the sequence kernel associassoci-ation test (SKAT) [7, 8], was recently extended to handle family-based studies. The family-family-based SKAT (famSKAT) [9] introduces a random effect for family that incorporates familial relatedness and can be used robustly across study designs. Because it is unknown how to best
* Correspondence:[email protected]
Department of Biostatistics, University of Kentucky College of Public Health, 111 Washington Ave, Lexington, KY 40536-0003, USA
combine across study designs in this context, we ex-plore here various approaches with the flexible famS-KAT test and meta-analysis. Using the Genetic Analysis Workshop 19 (GAW19) simulation data, we investigate the combination of population-based (ie, unrelated subjects only) and family-based studies via famSKAT and meta-analysis to evaluate best practices when both data types are available for a particular phenotype of interest.
Methods Data sets
Population-based genotype data
Exome sequencing data from part of the Type 2 Diabetes Genetic Exploration by Next-generation se-quencing in Ethnic Samples (T2D-GENES) Project 1 were provided for GAW19. The data set includes vari-ant call format (VCF) files for odd-numbered chromo-somes from 1943 Hispanic people consisting of 490 from the San Antonio Family Heart Study, San Antonio Family Diabetes/Gallbladder Study, Veterans Administra-tion Genetic Epidemiology Study, and the InvestigaAdministra-tion of Nephropathy and Diabetes Study family component, and 1453 in Starr County, Texas.
Family-based genotype data
Whole genome sequencing data were provided by T2D-GENES Project 2: San Antonio Mexican American Fam-ily Studies. As with the population-based genotype data, this data set includes VCF files for odd-numbered chro-mosomes from 464 sequenced individuals comprising 16 distinct pedigrees.
Phenotype data and covariates
We evaluated diastolic (DBP) and systolic blood pres-sure (SBP) from the first examination using the 200 family- and population-based simulation replicates. We performed principal component analysis (PCA) [10] to detect outliers for each data set, and excluded 1 subject from the population-based cohort and 4 subjects from the family-based cohort. After removing subjects with missing data (81 missing age in the population-based cohort and 69 subjects with incomplete data in the family-based cohort), we analyzed 2252 sub-jects (1861 in the population-based and 391 in the family-based data sets). We then reran the PCA for each analysis type (ie, for the population-based only, the family-based only, and the combined). We used age, gender, hyper-tension medication use, the interaction between age and gender, and the top 3 principal components (PCs) as covariates throughout.
Statistical analysis
Because the variants in each data set varied, we ex-tracted a data set of intersecting variants based on marker position. VCFtools v0.1.12 [11] was used to obtain biallelic single nucleotide variants (SNVs) from each investigated gene. P values for the famSKAT
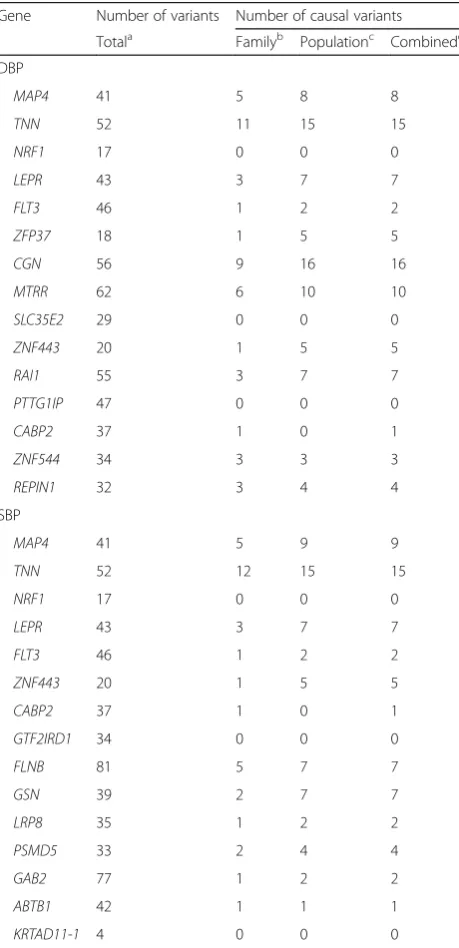
Table 1The number of variants in each gene in family-based, population-based, and combined data sets
Gene Number of variants Number of causal variants
Totala Familyb Populationc Combinedd
DBP
The number of variants that have the same position between the family- and population-based data
b
The number of causal variants of the intersected variants in the family-based data
c
The number of causal variants of the intersected variants in the population-based data
d
tests were calculated by Kuonen’s method [12] with the R package famSKAT (https://www.hsph.harvard. edu/han-chen/2014/07/31/famskat/). We performed famSKAT for analyzing the family- and population-based data sets separately, as well as for the combined data set. We further combined the famSKAT analyses from popula-tion- and family-based designs meta-analytically [13] as implemented in R’s seqMeta package [14]. We used the default weights in famSKAT such that pffiffiffiffiffiwj follows Beta
d
MAFj;1;25
with the sample minor allele frequency d
MAF
ð Þestimated using all subjects.
Results Simulated data
We focused on the top 15 causal genes influencing each of DBP and SBP in the family data set. Variants within 50 kb upstream and downstream of each gene were ex-tracted. Table 1 shows the number of variants in each gene used in the analysis for each of the data sets. We used the 200 simulated phenotype replicates to assess empirical type I error rates and powers.
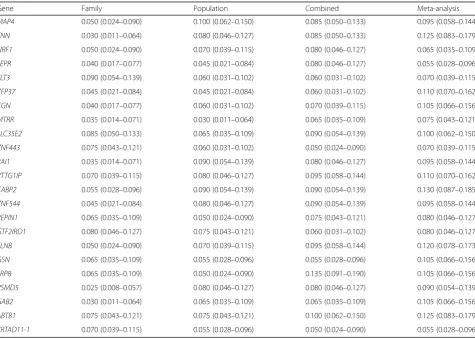
Type I error simulation
To investigate type I error (false-positive) rates, we used variable Q1, which is a heritable quantitative trait without any direct association with genotype. Table 2 shows the empirical type I error rates from the family-based, population-based, and combined data sets, as well as that from aggregating family and population results via meta-analysis. For the family- and population-based designs, the empirical type I error rates were acceptable, ranging from 0.025 to 0.090 and 0.030 to 0.100, respectively. The famS-KAT for the combined data and the meta-analytic ap-proach exhibited more inflated type I error rates: 0.050 to 0.135 and 0.055 to 0.130, respectively.
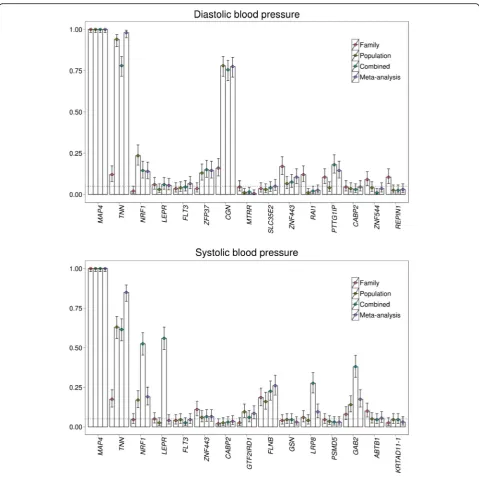
Power simulation
Figure 1 shows the simulation results for power for DBP and SBP atα= 0.05 in family- and population-based de-signs alone, the combined data approach, and the meta-analytic approach. For DBP, the famSKAT had high power to detect theMAP4,TNN,and CGNgenes in the combined data set (MAP4: 1.00; TNN: 0.780; CGN: 0.755); however, the tests in the combined data had lower power than those in the population-based data
Table 2Type I errors (95 % confidence intervals) of family-based sequence kernel association test in the family-based, population-based, and the combined data, and of meta-analytic approach
Gene Family Population Combined Meta-analysis
MAP4 0.050 (0.024–0.090) 0.100 (0.062–0.150) 0.085 (0.050–0.133) 0.095 (0.058–0.144)
TNN 0.030 (0.011–0.064) 0.080 (0.046–0.127) 0.085 (0.050–0.133) 0.125 (0.083–0.179)
NRF1 0.050 (0.024–0.090) 0.070 (0.039–0.115) 0.080 (0.046–0.127) 0.065 (0.035–0.109)
LEPR 0.040 (0.017–0.077) 0.045 (0.021–0.084) 0.080 (0.046–0.127) 0.055 (0.028–0.096)
FLT3 0.090 (0.054–0.139) 0.060 (0.031–0.102) 0.060 (0.031–0.102) 0.070 (0.039–0.115)
ZFP37 0.045 (0.021–0.084) 0.045 (0.021–0.084) 0.060 (0.031–0.102) 0.110 (0.070–0.162)
CGN 0.040 (0.017–0.077) 0.060 (0.031–0.102) 0.070 (0.039–0.115) 0.105 (0.066–0.156)
MTRR 0.035 (0.014–0.071) 0.030 (0.011–0.064) 0.065 (0.035–0.109) 0.075 (0.043–0.121)
SLC35E2 0.085 (0.050–0.133) 0.065 (0.035–0.109) 0.090 (0.054–0.139) 0.100 (0.062–0.150)
ZNF443 0.075 (0.043–0.121) 0.060 (0.031–0.102) 0.050 (0.024–0.090) 0.070 (0.039–0.115)
RAI1 0.035 (0.014–0.071) 0.090 (0.054–0.139) 0.080 (0.046–0.127) 0.095 (0.058–0.144)
PTTG1IP 0.070 (0.039–0.115) 0.080 (0.046–0.127) 0.095 (0.058–0.144) 0.110 (0.070–0.162)
CABP2 0.055 (0.028–0.096) 0.090 (0.054–0.139) 0.090 (0.054–0.139) 0.130 (0.087–0.185)
ZNF544 0.045 (0.021–0.084) 0.080 (0.046–0.127) 0.090 (0.054–0.139) 0.095 (0.058–0.144)
REPIN1 0.065 (0.035–0.109) 0.050 (0.024–0.090) 0.075 (0.043–0.121) 0.080 (0.046–0.127)
GTF2IRD1 0.080 (0.046–0.127) 0.075 (0.043–0.121) 0.060 (0.031–0.102) 0.080 (0.046–0.127)
FLNB 0.050 (0.024–0.090) 0.070 (0.039–0.115) 0.095 (0.058–0.144) 0.120 (0.078–0.173)
GSN 0.065 (0.035–0.109) 0.055 (0.028–0.096) 0.055 (0.028–0.096) 0.105 (0.066–0.156)
LRP8 0.065 (0.035–0.109) 0.050 (0.024–0.090) 0.135 (0.091–0.190) 0.105 (0.066–0.156)
PSMD5 0.025 (0.008–0.057) 0.080 (0.046–0.127) 0.080 (0.046–0.127) 0.090 (0.054–0.139)
GAB2 0.030 (0.011–0.064) 0.065 (0.035–0.109) 0.065 (0.035–0.109) 0.105 (0.066–0.156)
ABTB1 0.075 (0.043–0.121) 0.075 (0.043–0.121) 0.100 (0.062–0.150) 0.125 (0.083–0.179)
focusing on the TNN and CGN genes (TNN: 0.940;
CGN: 0.780). For SBP, the famSKAT had high to moder-ate power to detect the MAP4,TNN, NPE1, and LEPR genes (MAP4: 1.00; TNN: 0.615; NPF1: 0.525; LEPR: 0.560) and lower power to detect the FLNB, LRP8, and
GAB2genes (FLNB: 0.225;LRP8: 0.275; GAB2: 0.380) in the combined data.
Discussion
In this study, we investigated the combination of population-based and family-based data via famSKAT to evaluate best practices when both data types are
available for a particular phenotype of interest. We showed in simulation studies that famSKAT using the combined data had high power to detect association be-tween DBP and/or SBP and the genes that have causal variants with large effect sizes and had similar levels of power with the meta-analytic approach for most genes. Notably, meta-analysis substantially outperforms the combined data approach for onlyTNN, while combining data is substantially better for NRF1, LEPR, LRP8 and
GAB2. Interestingly for these 4 genes, the power gain is sizable (eg, gain of 52 % power by combining data for
LEPR). However, when there was a considerable
difference in the powers between family- and population-based data, famSKAT in the combined data had lower power than that in the population-based data alone. For example, the TNN gene for both DBP and SBP and the CGN gene for DBP in the combined data had lower power than in the population-based data. The power of famSKAT in the combined data is more affected by extremely low power in either data set (family-based in this case) compared to the meta-analytic approach. The application of famSKAT to the GAW19 data demonstrates that combining family-and population-based data did not improve the power to detect the TNN, CGN genes compared with the power from the population-based design only.
The famSKAT test statistic for the combined data can be influenced by sample imbalance from the 2 designs. This underscores the importance of foresight in study design as, in this situation, the greatly lower sample size in the family-based data essentially serves to dilute signal. As a result of difficulty in subject re-cruitment and high costs of sequencing, family-based studies tend to have smaller sample. In addition, our simulation study shows that both approaches to com-bine studies, famSKAT with comcom-bined data and meta-analysis, had inflated type I error. These inflated type I errors, which were largely when using population-based data, might be a result of unaccounted for population admixture, even when adjusting for PCs.
Conclusions
The famSKAT test, when combining population-based and family-based data, had high power to detect an asso-ciation between DBP and/or SBP and the genes that have causal variants with large effect sizes. It had similar levels of power with the meta-analytic approach for most genes. However, the power of famSKAT in the combined data was more affected by extremely low power in either data set compared to the meta-analytic approach. The famSKAT test statistic for the combined data can be in-fluenced by sample imbalance from the two designs. This underscores the importance of foresight in study de-sign as, in this situation, the greatly lower sample size in the family-based data essentially serves to dilute signal.
Acknowledgements
The Genetic Analysis Workshop is supported by National Institutes of Health (NIH) grant R01 GM031575. This work was also supported by NIH grant K25AG043546. The GAW19 whole genome sequence data were provided by the T2D-GENES Consortium, which is supported by NIH grants U01 DK085524, U01 DK085584, U01 DK085501, U01 DK085526, and U01 DK085545. The other genetic and phenotypic data for GAW19 were provided by the San Antonio Family Heart Study and San Antonio Family Diabetes/Gallbladder Study, which are supported by NIH grants P01 HL045222, R01 DK047482, and R01 DK053889. The Genetic Analysis Workshop is supported by NIH grant R01 GM031575.
Declarations
This article has been published as part ofBMC ProceedingsVolume 10 Supplement 7, 2016: Genetic Analysis Workshop 19: Sequence, Blood Pressure and Expression Data. Summary articles. The full contents of the supplement are available online at http://bmcproc.biomedcentral.com/ articles/supplements/volume-10-supplement-7. Publication of the proceedings of Genetic Analysis Workshop 19 was supported by National Institutes of Health grant R01 GM031575.
Authors’contributions
YK and DWF designed the overall study, conducted the statistical analyses, created the tables and figure, and drafted the manuscript. Both authors discussed the project throughout, and read and approved the final manuscript.
Competing interests
The authors declare they have no competing interests.
Published: 18 October 2016
References
1. Li B, Leal SM. Methods for detecting associations with rare variants for common diseases: application to analysis of sequence data. Am J Hum Genet. 2008;83(3):311–21.
2. Madsen BE, Browning SR. A groupwise association test for rare mutations using a weighted sum statistic. PLoS Genet. 2009;5(2), e1000384. 3. Fardo DW, Druen AR, Liu J, Mirea L, Infante-Rivard C, Breheny P. Exploration
and comparison of methods for combining population- and family-based genetic association using the Genetic Analysis Workshop 17 mini-exome. BMC Proc. 2011;5 Suppl 9:S28.
4. DerSimonian R, Laird N. Meta-analysis in clinical trials. Control Clin Trials. 1986;7(3):177–88.
5. Jahanshad N, Kochunov PV, Sprooten E, Mandl RC, Nichols TE, Almasy L, Blangero J, Brouwer RM, Curran JE, de Zubicaray GI, et al. Multi-site genetic analysis of diffusion images and voxelwise heritability analysis: a pilot project of the ENIGMA-DTI working group. Neuroimage. 2013;81:455–69 6. Major Depressive Disorder Working Group of the Psychiatric GWAS
Consortium, Ripke S, Wray NR, Lewis CM, Hamilton SP, Weissman MM, Breen G, Byrne EM, Blackwood DH, Boomsma DI, et al. A mega-analysis of genome-wide association studies for major depressive disorder. Mol Psychiatry. 2013;18(4):497–511.
7. Lee S, Wu MC, Lin X. Optimal tests for rare variant effects in sequencing association studies. Biostatistics. 2012;13(4):762–75.
8. Wu MC, Lee S, Cai T, Li Y, Boehnke M, Lin X. Rare-variant association testing for sequencing data with the sequence kernel association test. Am J Hum Genet. 2011;89(1):82–93.
9. Chen H, Meigs JB, Dupuis J. Sequence kernel association test for quantitative traits in family samples. Genet Epidemiol. 2013;37(2):196–204. 10. Price AL, Patterson NJ, Plenge RM, Weinblatt ME, Shadick NA, Reich D.
Principal components analysis corrects for stratification in genome-wide association studies. Nat Genet. 2006;38(8):904–9.
11. Danecek P, Auton A, Abecasis G, Albers CA, Banks E, DePristo MA, Handsaker RE, Lunter G, Marth GT, Sherry ST, et al. The variant call format and VCFtools. Bioinformatics. 2011;27(15):2156–8.
12. Kuonen D. Saddlepoint approximations for distributions of quadratic forms in normal variables. Biometrika. 1999;86:929–35.
13. Lin DY, Zeng D. On the relative efficiency of using summary statistics versus individual-level data in meta-analysis. Biometrika. 2010;97(2):321–32. 14. Voorman A, Brody J, Chen H, Lumley T. Meta-analysis of region-based tests