ISSN: 2231-5381
http://www.ijettjournal.org
Page 154
A Multi-Layer Multi-Region Well Test Model
Ashkan Jahanbani G.#1, Tom A. Jelmert#2 #1,2
Department of Petroleum Engineering and Applied Geoscience, Norwegian University of Science and Technology (NTNU) S.P. Andersens vei 15 A, 7491 Trondheim, Norway
Abstract— Pressure data of composite reservoirs are usually analyzed using two-region models separated by a vertical front. This simplification may lead to significant errors in the estimates. In this paper, a multi-region composite model with thin skin at the fronts is improved by adding n layers in the vertical direction to model the effect of gravity. The proposed model is then compared to the recently developed models for thermal well test analysis. The proposed model consists of m regions to model the smooth variation of properties from the inner to the outer region while the composite models used for the comparison assume an intermediate region characterized by power-law decline of properties. Fronts are assumed tilted due to the gravity effects by use of multi-layer reservoir concept with no cross-flow between the layers. The model can be validated against conventional models. Addition of more intermediate regions and skin at front locations are investigated to achieve a better match with the new analytical models. The model developed in this work can be used in type curve matching for improved well test analysis.
Keywords—composite reservoir, gravity, layer, multi-region, smooth property variation, well test
I. INTRODUCTION
In well test analysis, the obtained pressure data are matched to the model type curves. Selection of the model is therefore a crucial part of the analysis. A composite reservoir is formed either naturally or artificially (for example, the application of steam injection for enhanced oil recovery (EOR)). The composite reservoir model developed in [1] is traditionally used for the analysis of the pressure data. This model consists of two regions, each defined by individual properties that are different from the other region to model the condition of an impermeable boundary at the front location. Falloff data are analysed using the pseudo steady state (PSS) method for estimation of the swept volume and reservoir properties.
The two-region simplification of composite reservoirs was improved by various analytical composite reservoir models (listed in the references of [2] and [3]). In previous works ([2] and [3]), two analytical models were developed for the pressure behaviour of a three-region composite model with power-law variation of properties in the intermediate region. Gravity override was modelled in these works differently, using continuous or discrete tilted fronts. Heat loss from the inner region to the surroundings was also included in these models.
Reference [4] proposed a mathematical model for a single layer multi-region composite reservoir with thin skin at the fronts. This model is improved in this paper to include the effect of gravity in the form of tilted fronts using the concept of multi-layer reservoirs. The model is further improved by
adding more intermediate regions to match the smooth (power-law) property variation of models of [2] and [3].
II. MATHEMATICAL MODEL
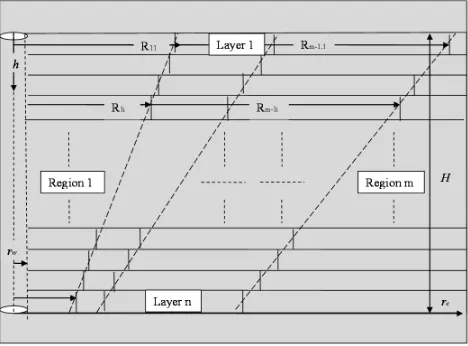
Multi-region model of [4] is extended in this section to model the effect of gravity in the form of tilted fronts. The development of the model is similar to the model of [2]. The intermediate region in the three-region model of [2] is replaced here by a number of regions to model the smooth variation of properties (Fig. 1). The following assumptions are applied in the development of the model:
1) Slightly compressible fluid (small compressibility) 2) Isotropic porous medium
3) Small pressure gradient 4) Radial flow
5) Applicability of Darcy’s law
6) Negligible gravity and capillary forces 7) Very long injection time prior to shut-in 8) Stationary fronts of infinitesimal thickness 9) No cross-flow between layers
10) Single injector located at the center of the reservoir
Fig. 1 Representation of the multi-layer multi-region composite reservoir model with tilted fronts
ISSN: 2231-5381
http://www.ijettjournal.org
Page 155
= , =
2
−
= 2
− , =
( )
=( ) ℎ
( ) , =
ℎ
=
∑ ℎ
, ( ) =∑( ) ℎ , =∑ℎ
Assuming a multi-layer multi-region composite model (as shown in Fig. 1), diffusivity equation for flow in the inner region for any layer i can be written in dimensionless form as:
+1 =
for 1 < < (1)
Indices 1 and i refer to the inner region and the layer i, respectively. Flow equation in any region j (j=2 to m) of layer
i is written as:
+1 =
for < < (2)
In Fig. 1, the inner region is composed of a number of cylinders of varying radii stacked on top of each other. The volume of the cone frustum shown by the imaginary dashed line intersecting the different layers’ fronts should be equal to the volume of the cylinders. Reference [5] shows the calculations having the values of the front angle, thickness, number of layers and a minimum front radius (corresponding to the bottom layer). Such a volume balance calculation is performed in this study.
Like the procedure followed in [2], initial and boundary conditions are introduced first in order to solve the derived flow equations. Initially, the system is at equilibrium or initial pressure. In dimensionless form:
= 0 @ = 0 (3)
Wellbore storage is not considered in the analysis at the moment, however, effect of the skin for each layer is written as:
= |( = 1)− |( = 1) (4)
Interface equation for pressure drop including a thin skin at the front location is written for any front between regions j
and j+1 at any layer i (i=1 to n-1) as:
=− − @ = (5)
The only difference with the equations of [2] for continuity of pressure at the fronts is the addition of a thin skin (sf) to
account for the changes at the front. The condition of continuity of flux across the fronts is written in dimensionless form as:
= @ = (6)
Where mobility ratio is defined as:
= (7)
The outer boundary condition is written for different types of boundaries in dimensionless form as:
1) Infinite-acting reservoir:
lim
→ = 0 (8)
2) No-flow boundary:
|( = ) = 0 (9)
3) Constant-pressure boundary:
= 0 @ = (10)
In addition to equation 4, another inner-boundary condition (including contribution from all layers) is the steam injection at constant rate (in dimensionless form):
|( = 1) =−1 (11)
The next step is to take the Laplace of the differential equations and the initial and boundary conditions in order to form a system of equations and then solve it. The solution to equation 1 in Laplace space is:
= + (12)
Taking the Laplace of equation 2, the solution for any region j (j=2 to m) in layer i is:
= + (13)
The above pressure solutions (equations 12 and 13) are then substituted in the Laplace of the boundary conditions.
ISSN: 2231-5381
http://www.ijettjournal.org
Page 156
for n layers. Another single equation (Laplace of equation 11) showing the constant rate injection is written to have contribution from all layers. A system of 2m.n+1 equations should therefore be solved to obtain the wellbore pressure response. In this system, notice that is the (2m.n+1)th unknown which is directly obtained from the solution of the system of equations.
To obtain the dimensionless wellbore pressure and pressure derivative, is inverted numerically from Laplace space to real space by Stehfest algorithm [6]. The wellbore pressure obtained does not include any wellbore storage effect. To add this effect to the solution, procedure of [7] is applied as:
= 1
+ 1
(14)
This equation is again numerically inverted into real space to obtain the dimensionless wellbore pressure and pressure derivative including wellbore storage and skin effects.
III.RESULTS AND DISCUSSION
The model presented in the previous section will reproduce many of the composite models with constant properties in different regions listed in the references of [2] and [3]. Notice that if = = 1and index i is dropped; the equations represent the single layer reservoir model. Vertical fronts are modelled either by assigning identical front radii to all layers or by using a single layer model.
Effect of gravity override is usually investigated by multi-layer models. Fig. 2 shows the pressure and derivative responses of the modified multi-layer model of [8] generated by the model presented in this work. Modification includes the no-flow boundary assumption which appears as a unit slope line on the late time pressure and derivative responses.
Fig. 2 Generation of the modified multi-layer composite model of [8] by the model of this study, CD= 31.64; S=0; Rm=440; M=213; F=18; α=60°; N=3;
re=1000000
Notice in the figures that, dpWD refers to the logarithmic
pressure derivative or dpWD/dlntD. The value of 0.5 on the
derivative plot refers to the initial radial flow in the inner region. Late time derivative stabilization refers to the radial flow in the outer region.
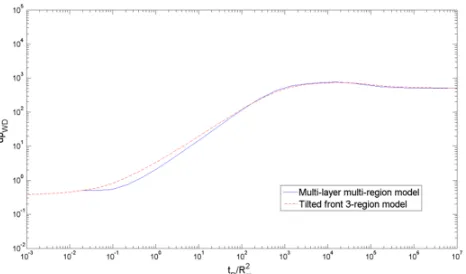
Fig. 3 compares the original two-region multi-layer model of [8] reproduced by the model of this study (which is the same as [2]) and the model of [3]. It is observed that the models do not match at early and middle times. This is because of different ways of treating the effect of the gravity in these models.
Fig. 3 Comparison of this study (multi-layer multi-region model) with tilted front model of [3] for reproducing the original model of [8]
For better understanding of the proposed models, the model of this study is further compared with the analytical three-region models presented in [2] and [3] for another set of data in Fig. 4. Theoretically, the tilted front model of [3] is the best model since it has less simplifying assumptions. There is a reasonable match between the models except at the early and middle times. The mismatch is due to different ways of treating the gravity and property variations. In the model of this study, constant properties are assumed in each region while in the other two models power-law decline of properties in the intermediate region is assumed.
Fig. 4 Comparison of this study (multi-layer multi-region model) with models of [2] and [3], CD=0; S=0; Sf=0; Rm=200; M12=10; M13=1000; F12=10;
F13=1000; α=60°; β=0; θ1=θ2=1; m=3; N=3; λ1i=0.333; ω1i=0.333; HD=0.55; ε
=117
ISSN: 2231-5381
http://www.ijettjournal.org
Page 157
continuous tilted fronts. As shown in Fig. 5, the responses of the two models are apart from each other.
Fig. 5 Comparison of this study (multi-layer multi-region model) with tilted front model of [3], CD=0; S=0; Sf=0; Rm=200; M12=10; M13=1000; F12=10;
F13=1000; α=30°; β=0; θ1=θ2=2; m=3; N=3; λ1i=0.333; ω1i=0.333; HD=0.55; ε
=117
The model of this study can be improved by adding more intermediate regions between the inner and the outer regions to match the response of [3] with gradual change of properties, as shown in Fig. 6, generated for six regions.
Fig. 6 Improvement of the match between the two models shown in Fig. 5 by adding more intermediate regions, m=6
The match observed in Fig. 6 can be further improved by adding a thin skin at the first front, as shown in Fig. 7.
Application of the model presented in this paper together with the new models of [2] and [3] in type curve matching using the parameters related to the effects included in these models such as gravity, heat loss and property changes, will replace the conventional method of composite reservoir well test analysis or the pseudo steady state method.
Fig. 7 Improvement of the match between the two models shown in Fig. 6 by adding a thin skin at the first front, m=6; Sf1=5
IV.CONCLUSIONS
In this paper, an analytical multi-region model for well test analysis of composite reservoirs was improved to include the gravity effect in the form of tilted fronts using the multi-layer reservoir concept. The modified model is considered an improvement over the traditional models. This multi-layer multi-region model can match the recently developed models within reasonable accuracy. This was achieved by adding more intermediate regions with gradual change of properties between the inner and the outer region to roughly simulate the power-law variation of properties of the new models. Therefore, any of the models discussed in this paper can be used in type curve matching to improve the results of the pseudo steady state method. The presence of the intermediate region(s) in fact dampens the assumption of sharp property variations in the pseudo steady state method.
ACKNOWLEDGMENT
Authors would like to gratefully thank the Department of Petroleum Engineering and Applied Geophysics at NTNU (Trondheim) for all the support for doing this research. Professor Jon Kleppe is appreciated for his valuable comments and review. Financial support from Statoil ASA is highly appreciated.
NOMENCLATURE
B Formation volume factor, m3/Sm3 ct Total compressibility, Pa-1
CD Dimensionless wellbore storage coefficient
F Storativity ratio at the front between different regions H Thickness of the reservoir, m
k Permeability, m2
M Mobility ratio at the front between different regions
p Pressure, Pa
pD Dimensionless pressure change
pi Initial reservoir pressure, Pa
q Injection (production) flow rate, Sm3/s
ISSN: 2231-5381
http://www.ijettjournal.org
Page 158
rD Dimensionless radial distance
re External boundary radius, m
rw Wellbore radius, m
s Laplace variable
S Skin factor, dimensionless Sf Skin at the front, dimensionless
t Time, s
tD Dimensionless time
Greek Letters
θ1 Exponent for mobility variation
θ2 Exponent for storativity variation
λ Relative mobility, dimensionless µ Viscosity, Pa.s
φ Porosity, fraction
ω Relative storativity, dimensionless
REFERENCES
[1] A. Satman, M. Eggenschwiler, R. W-K. Tang, and H. J. Ramey Jr., “An Analytical Study of Transient Flow in Systems with Radial Discontinuities,” in the 55th
Annual Meeting of SPE of AIME, Dallas,
Texas, 21-24 September, 1980, paper SPE 9399. http://dx.doi.org/10.2118/9399-MS
[2] A. Jahanbani G., and T. A. Jelmert, “A Multi-Layer Commingled Composite Reservoir Model for Thermal Well Test Analysis,” International Journal of Engineering Trends and Technology (IJETT), vol. 18 (6), pp. 283-292, 2014. 10.14445/22315381/IJETT-V18P259 [3] A. Jahanbani G., and T. A. Jelmert, “A New Composite Reservoir
Model for Thermal Well Test Analysis,” International Journal of Engineering Trends and Technology (IJETT), vol. 18 (8), pp. 357-366, 2014. 10.14445/22315381/IJETT-V18P273
[4] L.G. Acosta and A.K. Ambastha, “Thermal Well Test Analysis Using an Analytical Multi-Region Composite Reservoir Model,” in the Annual Technical Conference and Exhibition of SPE of AIME, New Orleans, Louisiana, September 25-28, 1994, paper SPE 28422 http://dx.doi.org/10.2118/28422-MS
[5] I. Kiome, “Pressure Transient Behaviour for a Well in a Multi-layered Composite Reservoir with an Inclined Front” M.Sc. Thesis, University of Alberta, Edmonton, Canada, 1991.
[6] H. Stehfest, “Algorithm 368: numerical inversion of Laplace transform,” Commun. Assoc. Comput. Math., vol. 13(1), pp. 47–49, 1970. [7] A. F. van Everdingen and W. Hurst, “The application of the Laplace
transformation to flow problems in reservoirs,” JPT, vol. 1(12), pp. 305–324, 1949. http://dx.doi.org/10.2118/949305-G
![Fig. 3 Comparison of this study (multi-layer multi-region model) with tilted front model of [3] for reproducing the original model of [8]](https://thumb-us.123doks.com/thumbv2/123dok_us/8597542.1723019/3.612.315.547.137.273/comparison-study-multi-layer-region-tilted-reproducing-original.webp)