INTERNATIONAL RESEARCH JOURNAL OF PHARMACY
www.irjponline.com
ISSN 2230 – 8407
Research Article
APPLICATION OF QBD LIFE CYCLE APPROACH FOR STABILITY INDICATING
HPLC METHOD DEVELOPMENT AND VALIDATION FOR THE ESTIMATION OF IMPURITIES IN
TENOFOVIR DISOPROXIL FUMARATE AND EMTRICITABINE COMBINATION TABLETS
Bhupatsinh Vihol *
1, Seema Kothari 2, Parth Patel
1, Nimit Vasa
1, Vrajesh Prajapati
11
Analytical Development Laboratory, Piramal Enterprises Limited, Ahmedabad, Gujarat, India
2
Department of chemistry, Pacific Academy of Higher Education and Research University, Udaipur, Rajasthan, India
*Corresponding Author Email: [email protected]
Article Received on: 19/03/19 Approved for publication: 13/04/19
DOI: 10.7897/2230-8407.1004149
ABSTRACT
Statistical experimental design was used to optimize the chromatographic separations of two potential impurities in fixed dose combination tablets. Risk assessment has been made based on knowledge gathered during development activity. The Critical Quality Attributes (CQA’s) selected were Trifluoroacetic acid (TFA) concentration, organic solvent and column temperature. A Box- Behnken Design was utilized using Minitab software to study the effects of these CQA’s on closely eluting peaks of S-Oxide and Tenofovir. The effect of these three CQA’s on resolution is depicted in the form of the p and f values between the various combination and permutations of these three CQAs. The chromatographic method employed a HPLC, Zorbax SB-Phenyl C18 column (150 x 4.6 mm i.e., 3.5µm particle size) with the mobile phase consisting of a TFA buffer and Methanol: TFA ((85:15 v/v) in a gradient program. The flow rate, injection volume and detection were 1.0 mL/min, 15 μL and 262 nm respectively. As per design space, 15 validation runs were performed and out of which Run 11 gave more resolution, i.e., of 4.4 at 45 °C column temperature with 0.11 % TFA concentration in mobile phase A and Methanol: 0.1% TFA in water (85:15 % v/v) in mobile phase B which was studied with different plots like interaction plot and overlaid contour plots. The results clearly showed that the quality by design concept could be effectively applied to optimize HPLC chromatographic method parameters with fewer trials and error-free experimentation.
Key words: HPLC, QbD, Risk Assessment, CQA’s, Box-Behnken, Resolution
INTRODUCTION
Tenofovir Disoproxil Fumarate chemically known as 9-[(R)-2-[[bis [[(isopropoxy carbonyl) oxy] methoxy] phosphinyl] methoxy] propyl] adenine fumarate (1:1)1, is anti HIV drug which is categorized as Nucleoside Reverse Transcriptase Inhibitor (NRTI), the pro-drug readily undergoes esterase hydrolysis to give Tenofovir, which is phosphorylated by nucleoside diphosphate kinase into the active diphosphate form. Unlike other nucleoside analogues, Tenofovir does not require the initial phosphorylation reaction, which is often a rate limiting step2. The molecular structure is shown in Fig.1.
Emtricitabine chemically known as 4-amino-5-fluro-1-[(2R, 5S)-[2 - hydroxy methyl]- 1,3 - oxathiolan - 5-yl] cytosine3, is anti HIV drug which is categorized as Nucleoside Reverse Transcriptase Inhibitor (NRTI), a synthetic nucleoside analog of cytidine, is phosphorylated by cellular enzymes to form Emtricitabine 5'-triphosphate. Emtricitabine 5'-triphosphate inhibits the activity of the HIV-1 reverse transcriptase by competing with the natural substrate deoxycytidine 5'-triphosphate and by being incorporated into nascent viral DNA which results in chain termination4. The molecular structure is shown in Figure-1.
The literature search revealed that there are number of analytical methods have been reported for single molecule or simultaneous estimation of TDF and FTC by HPLC5-12, by UPLC13-16, by mass spectroscopy17. Till date no stability indicating HPLC method has been reported for simultaneous estimation of related substances
of TDF and FTC by QbD life cycle approach. Lifecycle approach from US pharmacopoeia council is very new concept for improvement in analytical procedures18.
be defined as ‘the controls on input factors to a method that ensures the method meets both traditional SST criteria and wider performance related goals’. The controls can include parameters and attributes related to drug substance and drug product materials and components, facility and equipment operating conditions, in-process controls, finished product specifications, and the associated methods and frequency of monitoring and control (ICH Q10) Quality Risk Management is (ICH Q9) is “A systematic process for the assessment, control, communications and review of risks to the quality across the lifecycle”. Risk Assessment is integral part of the Analytical QbD process. Their use facilitates identification and ranking of parameters that could impact method performance and conformance to the ATP. Risk Assessment is often iterative throughout the lifecycle of a method and is typically performed at the end of method development, with product changes (e.g. route, formulation or process) and as a precursor to method transfer and from a ruggedness perspective. These Risk Assessments focus on potential differences (e.g. laboratory practices, environment, testing cycle times, reagents/materials sources). Major differences (e.g. equipment availability) should be identified and factored in at the selection and method development stages19-24.
Since TDF and FTC are sensitive to hydrolysis, oxidation and heat, it is necessary to develop a stability-indicating impurity method for the estimation of impurities in Tenofovir Disoproxil Fumarate and Emtricitabine Combination Tablets on HPLC by the QbD approach25-26.
Conventional and Traditional chromatographic method development has always involved the time-consuming process of varying one factor at a time, examining its effect on the method, and system operation. This generally requires a large number of experimental runs and in most cases the developed method requires further development27.
It will therefore be scientifically important to see if a design space for the freedom of movement of HPLC parameters can be obtained to facilitate the development of analytical methods. Therefore, the purpose of this study was to develop a robust HPLC stability-indicating method for the separation of TDF, FTC, and their impurities using a quality method by design approach.
MATERIALS AND METHODS:
The Active pharmaceutical ingredients Tenofovir disoproxil fumarate, Emtricitabine, impurities and fix dose tablet formulation were provided by Piramal Enterprises Ltd, Ahmedabad (India). HPLC gradient grade Acetonitrile and Methanol were purchased from J T baker. Analytical reagents
Potassium dihydrogen phosphate, Trimethylamine,
Trifluoroacetic acid and Orthophosphoric acid were purchased from Merck. High purity purified water was used from Millipore Milli-Q Plus purification system.
Instrument
The Waters HPLC with PDA detector equipped with Empower software was used for the method development, forced degradation and validation study.
Chromatographic conditions
The chromatographic column Zorbax SB-Phenyl C18, 4.6 mm * 150 mm, 3.5 μm particles was used. The TFA buffer was prepared by mixing 1.0 mL of Trifluoroacetic acid into 1000 mL of water.
phase B consisted of a methanol and Mobile phase A in the ratio of 85:15 (v/v). The flow rate of the mobile phase was 1.0 mL/min, the column was maintained at 40°C, and detection was at 262 nm. The injection volume was 15 μL and the data acquisition time was 70 min. Mobile phase A consisted of a TFA buffer i.e. 0.1% (v/v) was used as diluent. The gradient program was as follows: Table-1
Standard stock solution (FTC: 0.1 mg/mL and TDF: 0.15 mg/mL)
Weighed accurately about 10 mg of FTC and 15 mg of TDF and transferred into 100 mL volumetric flask, added 35 mL of diluent and sonicated to dissolve it. Diluted to volume with diluent mixed well.
Diluted Standard solution (FTC: 0.0008 mg/mL and TDF: 0.0012 mg/mL): (0.2% of target concentration)
Pipetted out 4.0 mL of standard stock solution and transferred into 100 mL volumetric flask, diluted to volume with diluent and mixed well. Further Pipetted out 4.0 mL of this solution and transferred into 20 mL volumetric flask, diluted to volume with diluent and mixed well.
Sensitivity solution preparation (FTC: 0.0002 mg/mL and TDF: 0.0003 mg/mL): (0.05 % (Unknown) of target concentration)
Pipetted 5.0 mL of diluted standard solution and transferred into 20 mL volumetric flask, diluted to volume with diluent and mixed well.
Resolution solution preparation
Tenofovir impurity stock solution: (A1)
Accurately weighed and transfer about 3.75 mg of Tenofovir impurity into 25 mL of clean, dry volumetric flask, added 15 mL of methanol and sonicated to dissolve. Made up to the mark with methanol. (Concentration: 150µg/mL)
S-Oxide impurity stock solution: (A2)
Accurately weigh and transfer about 3.75 mg of S-oxide into 25 mL of clean, dry volumetric flask, add 15 mL of methanol and sonicate to dissolve. Make up to the mark with methanol. (Concentration: 150.0µg/mL)
Resolution Stock preparation
Pipetted 1.0 mL of each Solution A1 and Solution A2 transfer in to 25 mL volumetric flask, diluted to volume with diluent. (Concentration: S-oxide: 6.0µg/mL and Tenofovir: 6.0µg/mL)
Resolution solution preparation
Pipetted 5.0 mL of Resolution Stock preparation and transferred in to 25 mL volumetric flask, diluted to volume with diluent. (Concentration: S-oxide: 1.2µg/mL and Tenofovir: 1.2µg/mL)
Placebo solution preparation
Transferred 5.0 mL clear supernatant solution into a 25 mL volumetric flask, mad up to the mark with diluent and mixed. Filtered a portion of the above sample with 0.45µm PVDF syringe filter and collect filtrate after discarding first 3 ml of sample solution and analysed.
Sample preparation TDF+FTC tablets
Transferred 5 intact tablets into 500 mL volumetric flask. Added about 100 mL of diluent and kept it on shaking for 20 minutes, further added 200 mL of diluent and shaken for additional 40 minutes, added about 10 mL of methanol to remove foam formed and made up to mark with diluent and mixed well. Centrifuged the solution at 5000 RPM for 10 minutes or until the solution is clear.
Transferred 5.0 mL clear supernatant solution into a 25 mL volumetric flask, made up to the mark with diluent and mixed. Filtered a portion of the above sample with 0.45µm PVDF syringe filter and collect filtrate after discarding first 3 ml of sample solution and analysed. (TDF: Conc. 0.6 mg/mL and FTC: 0.4mg/mL)
Experimental Design
The Critical Quality Attributes (CQA’s) selected were TFA concentration, Organic solvent and Column Temperature. A Box- Behnken Design was utilized using Minitab software to study the effects of these CQAs on closely eluting peaks of S-Oxide and Tenofovir. The effect of these three CQA’s on resolution is depicted in the form of the p and f values between the various combination and permutations of these three CQAs.
METHOD VALIDATION28-32
The method was validated for specificity, linearity, limit of detection and quantitation, precision, accuracy, robustness, and ruggedness, according to ICH guidelines.
System suitability
In order to optimize the efficiency of a chromatographic separation, the quality of the chromatography was monitored by applying the following system suitability tests: A) %RSD of area response for six replicate injections and all bracketing injection of diluted standard for FTC and TDF peaks is NMT 10.0 %. B) The tailing factor of FTC and TDF for six replicate injections of diluted standard NMT 2.0. C) Signal-to-noise ratio in sensitivity standard (0.05% solution) must be ≥ 10. D) The resolution between S-oxide and Tenofovir impurity must be ≥ 1.5
Specificity
A specificity study was conducted to demonstrate the effective separation of the placebo solution, and all related degradant peaks from the analyte peaks of TDF & FTC. The placebo solution consisted of all the excipients without the drug as per test preparation. The finished product and placebo were exposed to various stress conditions like 0.01N HCl at room temperature for 16 hours, 0.01N NaOH at room temperature for 16 hours, 1% peroxide at room temperature for 3 hours, 60°C heat for 6 hours, Humidity and Heat i.e. 4 weeks 40°C/75%RH open conditions and exposed photo study as per ICH i.e. 1.2 million lux hours (visible) and 200 W- hour/m2 (UV).
Precision
The precision (repeatability) of the test method was evaluated from accuracy test results of a minimum of 9 determinations
covering the specified range for the procedure (e.g., 3 concentrations/3 replicates each); as per ICH Q2 guideline.
Limit of Detection and Quantitation
The limit of quantitation was verified by preparing a standard at the estimated LOQ i.e. 0.05% and injected six times. Limit of detection solution was prepared by diluting 3.3 times LOQ solution and injected. Signal to noise ratio was determined for LOD and LOQ solutions as per ICH Q2 guideline.
Linearity
Linearity was established across the range of the analytical procedure. A series of standard preparations were prepared over a range of LOQ to 150 % of specification limit. Known concentration of Adenine, Tenofovir, S-oxide, FTC, Des-amino, Monoester, Isopropyl, TDF and Dimer standard stock solution were prepared at six different levels, so as to obtain final concentration LOQ, 50%, 75%, 100%, 125% and 150% of specification limit i.e. 0.3 to 1.8 (µg/mL). Linearity plot – A graph of area response v/s concentration of Tenofovir and S-oxide was plotted and the regression equation was derived.
Accuracy
A known amount of TDF and FTC and the calculated amounts of impurity solutions of Adenine, Tenofovir, S-oxide, FTC, Des-amino, Monoester, Isopropyl, TDF and Dimer were added to placebo to obtain LOQ, 50%, 100%, and 150% level of specification limit. At each level the samples were prepared in triplicate. The accuracy is calculated as % recovery. Individual recovery, mean recovery and %RSD at each level are calculated and reported.
Solution Stability
The spike impurities sample solution was prepared and analysed initially. The same solution was stored at 5°C in auto-sampler and injected after various time intervals till 24 hours. Also diluted standard was stored for 3 days at 5°C and room temperature and injected on different days.
RESULTS AND DISCUSSION
Method Development and Optimization
TABLE 1: GRADIENT PROGRAMME
Time Flow %A %B
0 1.0 99 1
10 1.0 99 1
18 1.0 78 22
27 1.0 60 40
50 1.0 30 70
60 1.0 1 99
63 1.0 1 99
63.1 1.0 99 1
70 1.0 99 1
TABLE 2: IDENTIFIED CHROMATOGRAPHIC CQA’S AND THEIR RANGES
Name of CQA Range
investigated Low level High level Optimized level (Center Point)
TFA Concentration 0.09% - 0.11% 0.09% 0.11% 0.10%
Colum Temperature 35˚C-45˚C 35˚C 45˚C 40˚C
%Composition of Methanol in Mobile Phase B
81%v/v - 89%v/v 81%v/v 89%v/v 85%v/v
Response Resolution between S-Oxide and Tenofovir Impurities
TABLE 3: BOX-BEHNKEN EXPERIMENTAL DESIGN SUGGESTED AND THEIR RESPONSES
Number of Runs
TFA Concentration
Colum Temperature
%Composition of Methanol in Mobile Phase B
USP Resolution
1 0.10% 40˚C 85% 2.0
2 0.10% 45˚C 89% 1.8
3 0.09% 35˚C 0.1% 0.0
4 0.10% 35˚C 81% 2.0
5 0.10% 40˚C 85% 2.0
6 0.09% 40˚C 81% 0.0
7 0.10% 35˚C 89% 1.8
8 0.11% 40˚C 81% 2.7
9 0.09% 40˚C 89% 0.0
10 0.10% 45˚C 81% 1.7
11 0.11% 35˚C 85% 2.7
12 0.11% 45˚C 85% 2.4
13 0.10% 40˚C 85% 2.0
14 0.09% 45˚C 85% 0.0
15 0.11% 40˚C 89% 5.4
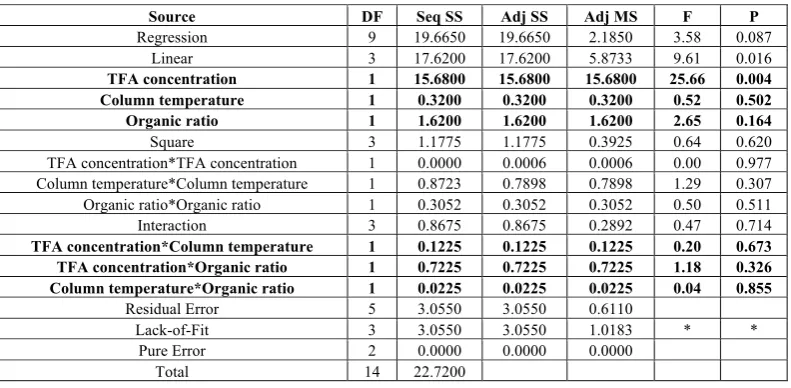
TABLE 4: OUTCOME OF THE STUDY (DOE): ANALYSIS OF VARIANCE (ANOVA) FOR RESOLUTION
Source DF Seq SS Adj SS Adj MS F P
Regression 9 19.6650 19.6650 2.1850 3.58 0.087
Linear 3 17.6200 17.6200 5.8733 9.61 0.016
TFA concentration 1 15.6800 15.6800 15.6800 25.66 0.004
Column temperature 1 0.3200 0.3200 0.3200 0.52 0.502
Organic ratio 1 1.6200 1.6200 1.6200 2.65 0.164
Square 3 1.1775 1.1775 0.3925 0.64 0.620
TFA concentration*TFA concentration 1 0.0000 0.0006 0.0006 0.00 0.977
Column temperature*Column temperature 1 0.8723 0.7898 0.7898 1.29 0.307
Organic ratio*Organic ratio 1 0.3052 0.3052 0.3052 0.50 0.511
Interaction 3 0.8675 0.8675 0.2892 0.47 0.714
TFA concentration*Column temperature 1 0.1225 0.1225 0.1225 0.20 0.673
TFA concentration*Organic ratio 1 0.7225 0.7225 0.7225 1.18 0.326
Column temperature*Organic ratio 1 0.0225 0.0225 0.0225 0.04 0.855
Residual Error 5 3.0550 3.0550 0.6110
Lack-of-Fit 3 3.0550 3.0550 1.0183 * *
Pure Error 2 0.0000 0.0000 0.0000
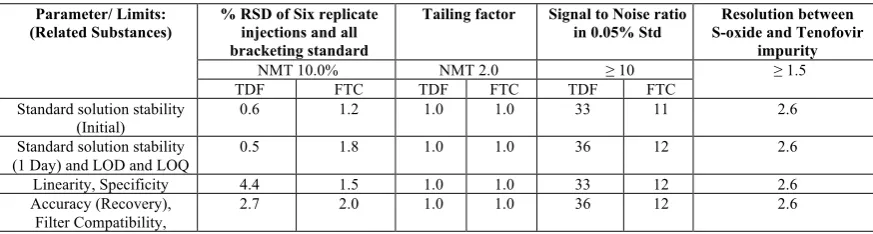
TABLE 5: SYSTEM SUITABILITY RESULTS
Parameter/ Limits: (Related Substances)
% RSD of Six replicate injections and all bracketing standard
Tailing factor Signal to Noise ratio
in 0.05% Std
Resolution between S-oxide and Tenofovir
impurity
NMT 10.0% NMT 2.0 ≥ 10 ≥ 1.5
TDF FTC TDF FTC TDF FTC
Standard solution stability
(Initial) 0.6 1.2 1.0 1.0 33 11 2.6
Standard solution stability (1 Day) and LOD and LOQ
0.5 1.8 1.0 1.0 36 12 2.6
Linearity, Specificity 4.4 1.5 1.0 1.0 33 12 2.6
Accuracy (Recovery), Filter Compatibility,
2.7 2.0 1.0 1.0 36 12 2.6
TABLE 6: FORCED DEGRADATION DATA FOR TDF, FTC AND ITS IMPURITIES
Stress conditions Name of impurity peaks Total
impurities
Peak Purity of both peaks
S-oxide Des amino Monoester Isopropyl
Control solutions 0.13 0.0 0.59 0.18 0.99 Passes
Thermal 2 week 60°C open 0.12 ND 0.63 0.18 1.00 Passes
Heat and Humidity 4 week 40°C/75%RH open
0.12 0.33 1.20 0.18 1.95 Passes
Photo (1 ICH cycle) 0.12 0.02 0.54 0.18 0.93 Passes
Acidic (0.01M HCl) 16 Hours at Room Temperature
0.13 0.04 1.81 0.18 2.22 Passes
Basic (0.01M NaOH) 16
Hours at Room Temperature 0.13 0.04 3.09 0.17 3.50 Passes
Oxidation (1%H2O2) 3 Hours at Room Temperature
7.74 0.01 0.80 0.18 8.82 Passes
Thermal (Solution)
at 600C for 6 Hours 0.13 0.13 3.39 0.18 3.88 Passes
TABLE 7: S/N RATIO OF THE LOD AND LOQ SOLUTIONS
Name Acceptance
Criteria Adenine S-oxide Tenofovir FTC Active and its impurities Desamino Monoester Isopropyl TDF Dimer
LOD ≥ 3.3 111 15 29 4 13 18 18 15 10
LOQ ≥ 10 282 38 74 12 32 48 48 39 28
TABLE 8: LINEAR REGRESSION EQUATION
Name Equation Correlation co-efficient (r)
TDF 18861.70x + 1.218.20 1.000
Adenine 88103.65x – 581.20 1.000
Tenofovir 44858.33x -965.47 1.000
Monoester 19762.25x – 301.82 1.000
Isopropyl 20776.76x -558.20 1.000
Dimer 18977.70x + 1181.59 1.000
FTC 14497.08x - -272.00 1.000
S-Oxide 19377.37x - 54.80 1.000
Desamino 28144.59x - 206.24 1.000
TABLE 9: ACCEPTANCE CRETERIA
Level Acceptance Criteria
LOQ Mean is 50.0% - 150.0%, RSD is NMT 25.0 %
Reporting level (0.1%) Mean is 80.0% - 120.0%, RSD is NMT 10.0 %
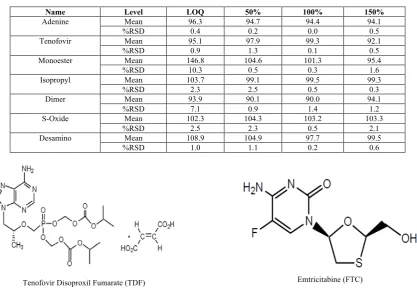
TABLE 10: ACCURACY RESULTS OF KNOWN IMPURITIES
Name Level LOQ 50% 100% 150%
Adenine Mean 96.3 94.7 94.4 94.1
%RSD 0.4 0.2 0.0 0.5
Tenofovir Mean 95.1 97.9 99.3 92.1
%RSD 0.9 1.3 0.1 0.5
Monoester Mean 146.8 104.6 101.3 95.4
%RSD 10.3 0.5 0.3 1.6
Isopropyl Mean 103.7 99.1 99.5 99.3
%RSD 2.3 2.5 0.5 0.3
Dimer Mean 93.9 90.1 90.0 94.1
%RSD 7.1 0.9 1.4 1.2
S-Oxide Mean 102.3 104.3 103.2 103.3
%RSD 2.5 2.3 0.5 2.1
Desamino Mean 108.9 104.9 97.7 99.5
%RSD 1.0 1.1 0.2 0.6
Tenofovir Disoproxil Fumarate (TDF) Emtricitabine (FTC)
Figure 1: Structure of Tenofovir Disoproxil Fumarate and Emtricitabine
Tenofovir S-Oxide
Figure 2: Structure of Tenofovir and S-Oxide impurities
Figure 3: Interaction Plot for resolution of three CQAs 4 5
4 0
3 5 8 1 8 5 8 9
4
2
0
4
2
0 T F A c o n c e n t r a t i o n
C o l u m n t e m p e r a t u r e
O r g a n i c r a t i o
0 . 0 9 0 . 1 0 0 . 1 1 c o n c e n tr a tio n T F A
3 5 4 0 4 5 te m p e r a tu r e C o lu m n
I n t e r a c t i o n P l o t f o r R e s o l u t i o n
Figure 4: Contour plot for interaction between Organic ratio and Column Temperature
Figure 5: Contour plot for interaction between Organic ratio and TFA concentration
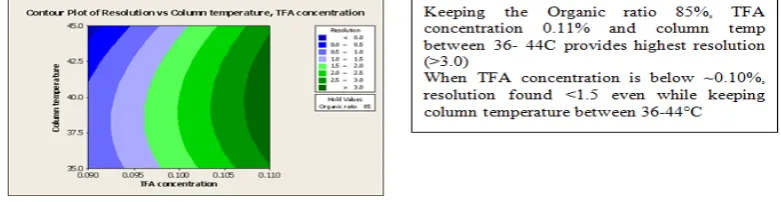
Figure 6: Contour plot for interaction between Column Temperature and TFA concentration
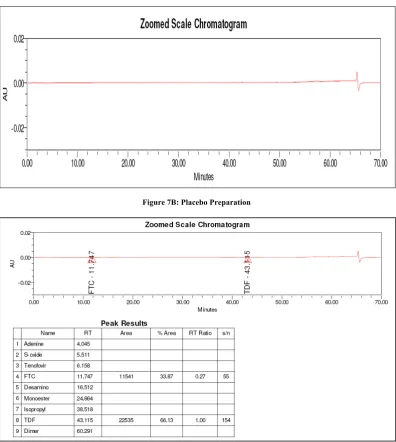
Figure 7B: Placebo Preparation
Figure 7D: Spiked impurity sample preparation
Figure 8A: Typical overlaid chromatogram of unstressed placebo and sample
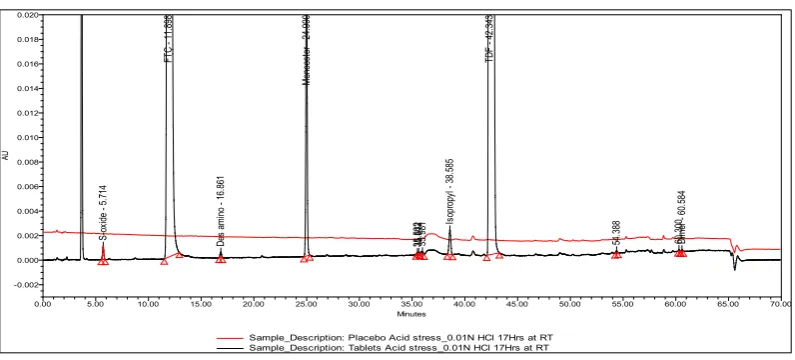
Figure 8B: Typical overlaid chromatogram of stressed acid hydrolysis placebo and sample Sample_Description: Placebo As Such
Sample_Description: Tablet_As such
S-ox id e - 5 .6 94 FT C - 11 .8 66 Mo no es te r 2 4. 96 9 35. 486 35. 600 35. 970 Is op ro py l 3 8.5 88 TD F - 4 2. 34 2 54. 388 60. 288 Di m er - 60 .5 76 AU -0.002 0.000 0.002 0.004 0.006 0.008 0.010 0.012 0.014 0.016 0.018 0.020 Minutes
0.00 5.00 10.00 15.00 20.00 25.00 30.00 35.00 40.00 45.00 50.00 55.00 60.00 65.00 70.00
Sample_Description: Placebo Acid stress_0.01N HCl 17Hrs at RT Sample_Description: Tablets Acid stress_0.01N HCl 17Hrs at RT
S-ox id e - 5 .7 14 FT C - 1 1. 89 8 De s am in o - 1 6. 86 1 Mo no es te r 2 4. 99 0 35. 502 35. 612 35. 981 Is op ro py l 3 8.5 85 TD F - 4 2. 34 3 54. 388 60. 300 Di m er - 60 .5 84 AU -0.002 0.000 0.002 0.004 0.006 0.008 0.010 0.012 0.014 0.016 0.018 0.020 Minutes
Figure 8C: Typical overlaid chromatogram of stressed alkali hydrolysis placebo and sample
Figure 8D: Typical overlaid chromatogram of stressed oxidative placebo and sample
The initial experiment started with gradient method with column Synergi MAX-RP (C12), 4.6 x 250 mm, 4 µm by using 20mM ammonium acetate buffer pH 4.6 as a Mobile phase A and acetonitrile as a Mobile phase B with the flow rate 1.2 mL/min. The column temperature was Ambient. The diluent consisted of 25mM Phosphate buffer pH 3: Acetonitrile: Methanol (40:30:30). The sample spiked with impurities was analyzed, all impurities got separated well from the main peak, but poor resolution observed between S-Oxide and Tenofovir peak. Also spilt peak shape was observed for S-oxide degradant and Tenofovir impurity and S/N observed <10 for S-oxide peak. Figure 2: Structure ofTenofovir and S-Oxide impurities
To improve resolution, peak shape and response columns with different make were tried i.e. YMC ODS AQ 4.6 x 250 mm, 5 µm and Inertsil ODS, 4.6 x 250 mm, 5 µm along with different concentration of an acidic TFA as mobile phase, different organic ratio in mobile phase B, diluent consisted of Methanol: Water in different ratio and different column temperature. The resolution between S-Oxide and Tenofovir was found to be varied in above experiments and was concluded as critical pairs of peaks for resolution. However, there was no improvement in peak shape of impurities. Further, to achieve a better peak shape, it was decided to select diluent as aqueous buffer with column having low dimension and lower particle size to achieve good peak and response.
The good peak shape, better response and separation was
C18, 4.6 mm * 150 mm, 3.5 μm particles, with mobile phase consisted of a TFA buffer i.e. 0.1% (v/v) as a Mobile phase A. Mobile phase B consisted of a methanol and mobile phase A in the ratio of 85:15 (v/v), flow rate of 1.0 mL/min, column temperature maintained at 40°C, injection volume of 15 μL, detection wavelength as 262 nm and diluent consisted of a TFA buffer i.e. 0.1% (v/v) and with following gradient program Table-1.
The typical retention times of impurities S-oxide and Tenofovir were ~5.6 min and 6.3 min, respectively. The typical retention time of active peaks TDF and FTC were ~11.6 min and 42.6 min, respectively. This method was capable of separating all impurities from its analyte peak within 70 min. After this initial optimization, the method was subjected to Box-Behnken design to study the variables which influenced the resolution, response and retention times.
EXPERIMENTAL DESIGN
A full factorial design was used to determine the main effects and all interactions between the factors selected. The number of trials necessary was 2k, where k is the number of factors. Based on the initial method development, the number of factors included methanol composition in mobile phases B, flow rate, concentration of the buffer, and column temperature. Evaluating all of these parameters with a full factorial design would involve
Sample_Description: Placebo Alkali stress_0.01N NaOH 17Hrs at RT Sample_Description: Tablets Alkali stress_0.01N NaOH 17Hrs at RT
S-ox ide - 5. 71 6 FT C - 1 1. 90 2 De s am ino - 16 .8 52 Mo no es te r 2 4. 99 4 35. 515 35. 612 35. 986 Is op ro py l 3 8.5 85 TD F - 4 2. 35 0 54. 402 60. 297 Di m er - 60 .5 83 AU -0.002 0.000 0.002 0.004 0.006 0.008 0.010 0.012 0.014 0.016 0.018 0.020 Minutes
0.00 5.00 10.00 15.00 20.00 25.00 30.00 35.00 40.00 45.00 50.00 55.00 60.00 65.00 70.00
Sample_Description: Tablet_H2O2 Stress_1% H2O2 3hrs @ RT Sample_Description: Placebo_H2O2 Stress_1% H2O2 3hrs @ RT
S-ox id e - 5. 68 0 FT C 1 1. 87 7 De s am in o - 16 .8 30 Mo no es te r - 24 .9 75 35. 631 35. 996 Is op ro py l 3 8.5 95 TD F 4 2. 34 7 54. 385 60. 281 Di m er 6 0. 58 1 AU -0.002 0.000 0.002 0.004 0.006 0.008 0.010 0.012 0.014 0.016 0.018 0.020 Minutes
25 = 32 trials. This represents a significant amount of experimental time.
In order to minimize experimental time, factors were carefully evaluated in light of what had been learned during the initial method development. For example, the impact of column with phenyl phase had found no significant change in retention time or resolution with different make range. Therefore, column was not considered as a critical factor. Also typical flow rate for HPLC has been considered 1.0 mL/min. Therefore, this parameter was considered as constant.
The three factors in a Box-Behnken design would require 15 trials. This investment in experimental time is not extensive and would be more than appropriate for the optimization of the method. The goal was to improve the existing methodology within the minimum amount of time. Therefore, a Box-Behnken design was selected to measure the main effects and some interactions, where the numbers of trials are 15.
The chromatographic conditions and ranges fixed the investigated selected factors during the experimental design and are given in Table002D1. A sum total of 15 runs were obtained for the fixed variables by selecting three center repetitions which were generally carried out in order to know the experimental error variance and to test the predictive validity of the model. Each combination of concentration of TFA, mobile phase B composition and column temperature suggested by Box-Behnken design were finally run on the system; the observed response such as resolution between S-oxide & Tenofovir was noted and represented in Table-3. All experiments were performed in randomized order to minimize the effects of uncontrolled factors that may have introduced a bias on the response. Table-2, Table-3.
The design outcome was to monitor the resolution between two co-eluting peaks of impurities. The effect of these three CQA’s on resolution is depicted in the form of the p and f values between the various combination and permutations of these three CQA’s and are given in Table-4. The same is also explained by an interaction chart represented in figure 3.
Interpretation from ANOVA results
From the above Table-2 it can be observed that the TFA concentration (Single variable) shows a p-value of 0.004 which is statistically significant suggesting that the TFA concentration as a single variable significantly affects the resolution. However, the various combinations and permutations of the variables (TFA concentration, Organic ratio and Column Temperature) show a p-value >0.05 which is statistically not significant and do not affect the resolution.
Also, the f value for TFA concentration (25.66) is greater than the f critical (f statistical) value of 3.58, which is statistically significant suggesting that the TFA concentration as a single variable significantly affects the resolution as shown in Figure-3.
Interpretation from interaction plot for resolution
The above interaction plot indicates that TFA concentration and Organic ratio play crucial role as compared to column temperature. TFA concentration 0.11 % and 89% organic ratio with column temp 40°C provides highest resolution. The Design space generated from the above studies is also represented in the form of a Contour plot for better understanding in Fig 4, 5 and 6.
Method Validation
System suitability
The values of system suitability results obtained during the study are summarized below in Table 4. The system suitability parameters of standard solution were found to be: Tailing factor < 2.0, Signal to Noise ratio > 10, %RSD <10.0 and Resolution >1.5. Table-5
The typical chromatogram of the blank, placebo and standard is shown in Fig. 7A, 7B & 7C. The spiked chromatogram of TDF and FTC along with their impurities is shown in Fig. 7D.
Specificity
All the stress samples were prepared and injected into the HPLC
system with photodiode array detector. No degradation was
observed in UV light, visible light, and humidity conditions, whereas significant degradation was observed in acid hydrolysis, base hydrolysis, heat stress, and oxidative conditions. It is interesting to note that all the peaks due to degradation were well-resolved from the peaks of TDF & FTC. The overlaid chromatograms of the unstressed placebo and unstressed sample, acid hydrolysis stressed placebo and sample, alkali hydrolysis stressed placebo and sample, as well as the oxidative stressed placebo and sample are shown in Fig. 8A, 8B, 8C and 8D. The chromatograms of the stressed samples were evaluated for peak purity of TDF and FTC using Waters Empower Networking Software. For all forced degradation samples, the purity angle (the weighted average of all spectral contrast angles calculated by comparing all spectra in the integrated peak against the peak apex spectrum) was found to be less than the threshold angle (the sum of the purity noise angle and solvent angle, the purity noise angles across the integrated peak) and there was no purity flag (the purity flag is an indication of spectral homogeneity, compares the purity angle with the purity threshold) for the TDF and FTC peaks. This indicated that there was no interference from the degradants in quantitating TDF and FTC in tablets. Thus, this method is considered to be stability-indicating. The summary of the forced degradation studies and % degradation details are given in Table 7.
Limit of Detection and Limit of Quantitation
Signal to noise ratio was found to be >3.3 for limit of detection solution and >10 for limit of quantitation solutions and results are mentioned in below table-8
Linearity
FTC and TDF active and Adenine, Tenofovir, S-oxide, Des-amino, Monoester, Isopropyl, and Dimer impurities showed a linear response between 0.3 to 1.8 (µg/mL). This linearity was represented by a linear regression equation as follows and is given in below table-9.
Accuracy
The % mean recoveries of individual impurities in spike sample preparations were found to be in the range of as per below acceptance criteria (Table-10) The summary of % recovery is mentioned in Table-11.
Solution stability
CONCLUSION
The single HPLC stability-indicating gradient method was developed for the quantitation of impurities in fix dose combination of TDF and FTC by using the quality by design application. The method was validated as per ICH guidelines and found to be specific, precise, linear, accurate, rugged, and robust. The developed method is stability-indicating and can be used for quantifying TDF and FTC impurities in the fix dose combination dosage form of TDF and FTC tablets.
Looking at the current scenario the pharmaceutical industries as well as the FDA recommends a life cycle approach for any process/ method etc. during the developmental stage itself. For this it becomes mandatory to understand and implement the elements of Quality by Design like ATP’s, CQA’s, Risk Assessment and Control Strategy. An understanding of this enables to produce a quality product with predefined acceptance criteria. Also, it helps to evaluate the uncertainties associated with the analytical procedure and the potential effects of the changes in ATP’s on the analytical procedure. Thus using QbD as an analytical tool helps in a better method development which is robust as well as rugged in terms that we can play within the design space generated and working within design space is not considered as change.
ACKNOWLEDGMENT
The authors wish to thank the management of Piramal Pharmaceutical Development, Ahmedabad group for supporting this work.
REFERENCES
1. Pubchem, Available from: https://pubchem.ncbi.nlm.nih. gov/compound/Tenofovir_Disoproxil_Fumarate#section=De positor-Supplied-Synonyms. (Date of browsing : 04 Feb 2019)
2. Robert WM, Thomas P. Goodman & Gilman's: The
Pharmacological Basis of Therapeutics. 11th ed. New York: The McGraw-Hill Companies Inc; 2006. 1313-18.
3. Pubchem, Available from: https://pubchem.ncbi.nlm.nih. gov/compound/60877#section=Names-and-Identifiers (Date of browsing : 04 Feb 2019)
4. Briz V, Poveda E, Soriano V. HIV entry inhibitors: mechanisms of action and resistance pathways. The journal of antimicrobial chemotherapy. 2006; 57(4): 619–27. 5. Sreekanth N, Jacob JT, Ishwar B, Kishoreraju V. A stability
indicating RP-HPLC method for simultaneous estimation of Emtricitabine, Tenofovir disoproxil fumarate and Efavirenz drugs in pharmaceutical dosage forms. International Journal of Research in Pharmaceutical Sciences 2013; 4(2): 391-96. 6. Manavarthi S, Chhabra GS. Stability indicating RP-HPLC
method development and validation of Tenofovir in bulk and pharmaceutical formulation. Der Pharma Chemica 2014; 6(2): 401-09.
7. Kumar P, Dwivedi SC, Kushnoor A. A validated stability indicating RP-HPLC method for the determination of Emtricitabine in bulk and capsules. Farmacia 2012; 60 (Suppl 3): 402-10.
8. Hamarapurkar PD, Parate AN. HPLC Method for the
determination of Emtricitabine and related degradation substances. Journal of Chromatographic Science 2013; 51(Suppl 5): 419–24.
9. Ashenafi D, Chintam V, Van Veghel D, Dragovic
S, Hoogmartens J, Adams E. Development of a validated liquid chromatographic method for the determination of
related substances and assay of tenofovir disoproxil fumarate. Journal of Separation Science 2010; 33(12): 1708-16. 10. Ashenafi D, Verbeek A, Hoogmartens J, Adams E.
Development and validation of an LC method for the determination of Emtricitabine and related compounds in the drug substance. Journal of Separation Science 2009; 32(11): 1823-30.
11. Lavanya B, Hariprasad P. Simultaneous estimation of Emtricitabine and Tenofovir Disoproxil Fumarate by HPLC method. Der Pharmacia Lettre 2012; 4 (Suppl 6): 1855-62. 12. Abdelhay MH, Azza G, Heba K, Rasha AS. Selective
RP-HPLC DAD method for determination of Tenofovir Fumarate and Emtricitabine in bulk powder and in tablets. Acta Chromatographica 2014; 1(14): 41-54
13. Jane J, Sreekanth N. A UPLC method for simultaneous estimation of Emtricitabine, Tenofovir disoproxil fumarate and Efavirenz in pharmaceutical dosage forms. Research Journal of Pharmacy and Technology 2017; 10 (Suppl 2): 4463-66.
14. Nadig S, Jacob JT. UPLC method for the quantitative estimation of Emtricitabine impurities in formulated drug product. Der Pharmacia Lettre 2015; 7(Suppl 2): 160-64. 15. Anna Pratima GN, Zibran S, Dileep B. A Simple, Reliable,
Rapid and Stability Indicating Ultra Performance Liquid Chromatographic Method for the Quantitation of Emtricitabine. American Journal of PharmaTech Research 2013; 3(Suppl 1): 621-32.
16. Michael ES. Ultra performance liquid chromatography (UPLC): An introduction, Separation Science Redefined. 2005; 8–14.
17. Moolchand K, Dilip Kumar S, Shristy T, Parul S, Saranjit S. Stability behaviour of antiretroviral drugs and their combinations, Characterization of interaction products of Emtricitabine and Tenofovir Disoproxil Fumarate by mass spectrometry. Journal of Pharmaceutical and Biomedical Analysis 2016; 128: 438-46.
18. Martin GP, Barnett KL et al. Lifecycle management of analytical procedures: method development, procedure performance qualification, and procedure performance verification; 2015. Available from: https://www.uspnf.com /sites/default/usp_pdf/EN/USPNF/revisions/lifecycle_pdf. Date of browsing: 02 Feb 2019.
19. ICH Harmonized Tripartite Guideline, Pharmaceutical Development Q8 (R2), International Conference on Harmonization, IFPMA, Geneva, Switzerland; 2009.
Available from : https://www.ich.org/fileadmin
/Public_Web_Site/ICH_Products/Guidelines/Quality/Q8_R1 /Step4/Q8_R2_Guideline.pdf. (Date of browsing: 02 Feb 2019)
20. ICH Harmonized Tripartite Guideline, Quality Risk
Management Q9, International Conference on
Harmonization, IFPMA, Geneva, Switzerland; 2005.
Available from: https://www.ich.org/fileadmin/
Public_Web_Site/ICH_Products/Guidelines/Quality/Q9/Ste p4/Q9_Guideline.pdf (Date of browsing: 02 Feb 2019) 21. ICH Harmonized Tripartite Guideline, Pharmaceutical
Quality System Q10, International Conference on Harmonization, IFPMA, Geneva, Switzerland, 2008.
Available from: https://www.ich.org/fileadmin/
Public_Web_Site/ICH_Products/Guidelines/Quality/Q10/St ep4/Q10_Guideline.pdf (Date of browsing: 02 Feb 2019) 22. McBrien M. Practical implications of quality by design to
chromatographic method development. Chromatography Today 2010; 3: 30–34.
24. Devesh AB, Smita IR. QbD Approach to Analytical RP HPLC Method Development and its Validation. International Journal of Pharmacy and Pharmaceutical Sciences 2011; 3(1): 0975-91.
25. Bakshi M, Singh S. Development of stability indicating assay methods-critical review. Journal of Pharmaceutical and Biomedical Analysis 2001; 28(6): 1001-40.
26. Birdar SP, Kalyankar TM. Stability indicating HPLC method development: review. Asian Journal of Medicinal and Analytical Chemistry 2014; 1(Suppl 1): 21-26.
27. Monks KE, Molnar I, Rieger HJ. Expanding the term design space in high performance liquid chromatography. Journal of Pharmaceutical and Biomedical Analysis 2011; 56: 874–79 28. ICH harmonized tripartite guideline, Stability indicating
testing of new drug Substances and products Q1A (R2), International Conference on Harmonization, IFPMA, Geneva, Switzerland. 2003. Available from:https:// www.ich.org/fileadmin/Public_Web_Site/ICH_Products/Gui delines/Quality/Q1A_R2/Step4/Q1A_R2_Guideline.pdf (Date of browsing: 02Feb 2019)
29. ICH Harmonized Tripartite Guideline, Validation of analytical procedures: text and methodology Q2 (R1). International Conference on Harmonization, IFPMA, Geneva, Switzerland. 2005. Available from:https://www. ich.org/fileadmin/Public_Web_Site/ICH_Products/Guidelin es/Quality/Q2_R1/Step4/Q2_R1__Guideline.pdf. (Date of browsing: 02 Feb 2019)
30. Ermer J, McB JH, Miller. Method Validation in Pharmaceutical Analysis, Wiley-VCH. Weinheim 2005; 131. Available from: https://onlinelibrary.wiley.com/doi/pdf/ 10.1002/3527604685. (Date of browsing: 02 Feb 2019) 31. Kleinschmidt G. Case Study: Validation of an HPLC-Method
for Identity, Assay, and Related Impurities. Method Validation in Pharmaceutical Analysis: A guide to best practice 2005; 195– 212. Available from: https://www.researchgate.net/publication
/227996997_Case_Study_Validation_of_An_HPLC-Method_for_Identity_Assay_and_Related_Impurities. (Date of browsing: 02 Feb 2019)
32. Watzig H. Acceptance Criteria and Analytical Variability. Method Validation in Pharmaceutical Analysis. Wiley online library 2005; 265–280. Available from: https://onlinelibrary. wiley.com/doi/10.1002/3527604685.ch6. (Date of browsing: 02 Feb 2019)
Cite this article as:
Bhupatsinh Vihol et al. Application of QBD life cycle approach for stability indicating HPLC method development and validation for the estimation of impurities in tenofovir disoproxil fumarate and emtricitabine combination tablets. Int. Res. J. Pharm.
2019;10(4):196-208
http://dx.doi.org/10.7897/2230-8407.1004149
Source of support: Nil, Conflict of interest: None Declared