Open Access
Proceedings
Mixture modeling of microarray gene expression data
Yang Yang*
1, Adam P Tashman
1, Jung Yeon Lee
1, Seungtai Yoon
2,
Wenyang Mao
1, Kwangmi Ahn
3, Wonkuk Kim
1, Nancy R Mendell
1,
Derek Gordon
4and Stephen J Finch
1Address: 1Department of Applied Mathematics and Statistics, Stony Brook University, Stony Brook, New York 11790, USA, 2Cold Spring Harbor
Laboratory, Cold Spring Harbor, New York 11724, USA, 3Department of Health Evaluation Sciences, A210, Penn State College of Medicine, 600
Centerview Drive, Hershey, Pennsylvania 17033, USA and 4Department of Genetics, Rutgers University, 145 Bevier Road, Room 128, Piscataway,
New Jersey 08854, USA
Email: Yang Yang* - [email protected]; Adam P Tashman - [email protected]; Jung Yeon Lee - [email protected]; Seungtai Yoon - [email protected]; Wenyang Mao - [email protected]; Kwangmi Ahn - [email protected];
Wonkuk Kim - [email protected]; Nancy R Mendell - [email protected]; Derek Gordon - [email protected]; Stephen J Finch - [email protected]
* Corresponding author
Abstract
About 28% of genes appear to have an expression pattern that follows a mixture distribution. We use first- and second-order partial correlation coefficients to identify trios and quartets of non-sex-linked genes that are highly associated and that are also mixtures. We identified 18 trio and 35 quartet mixtures and evaluated their mixture distribution concordance. Concordance was defined as the proportion of observations that simultaneously fall in the component with the higher mean or simultaneously in the component with the lower mean based on their Bayesian posterior probabilities. These trios and quartets have a concordance rate greater than 80%. There are 33 genes involved in these trios and quartets. A factor analysis with varimax rotation identifies three gene groups based on their factor loadings. One group of 18 genes has a concordance rate of 56.7%, another group of 8 genes has a concordance rate of 60.8%, and a third group of 7 genes has a concordance rate of 69.6%. Each of these rates is highly significant, suggesting that there may be strong biological underpinnings for the mixture mechanisms of these genes. Bayesian factor screening confirms this hypothesis by identifying six single-nucleotide polymorphisms that are significantly associated with the expression phenotypes of the five most concordant genes in the first group.
from Genetic Analysis Workshop 15
St. Pete Beach, Florida, USA. 11–15 November 2006
Published: 18 December 2007
BMC Proceedings 2007, 1(Suppl 1):S50
<supplement> <title> <p>Genetic Analysis Workshop 15: Gene Expression Analysis and Approaches to Detecting Multiple Functional Loci</p> </title> <editor>Heather J Cordell, Mariza de Andrade, Marie-Claude Babron, Christopher W Bartlett, Joseph Beyene, Heike Bickeböller, Robert Culverhouse, Adrienne Cupples, E Warwick Daw, Josée Dupuis, Catherine T Falk, Saurabh Ghosh, Katrina A Goddard, Ellen L Goode, Elizabeth R Hauser, Lisa J Martin, Maria Martinez, Kari E North, Nancy L Saccone, Silke Schmidt, William Tapper, Duncan Thomas, David Tritchler, Veronica J Vieland, Ellen M Wijsman, Marsha A Wilcox, John S Witte, Qiong Yang, Andreas Ziegler, Laura Almasy and Jean W MacCluer</editor> <note>Proceedings</note> <url>http://www.biomedcentral.com/content/pdf/1753-6561-1-S1-info.pdf</url> </supplement>
This article is available from: http://www.biomedcentral.com/1753-6561/1/S1/S50
© 2007 Yang et al; licensee BioMed Central Ltd.
Background
McLachlan et al. [1] introduced a mixture analysis approach to the clustering of microarray expression data, in particular, of tissue samples on a very large number of genes. Maclean et al. [2] developed the SKUMIX algo-rithm, which can test whether a mixture model fits the genetic data with skewness removed by Box-Cox transfor-mation [3], and then used a likelihood-ratio test (LRT) statistic to determine whether the two-component model appears to fit the data better than the single-component model. Given the high degree of correlation among the gene expression variables, Simon's work [4] suggests that one use first- and second-order partial correlation coeffi-cients to find trios and quartets of genes that have high degrees of "explanation." Here we focus on trios and quar-tets comprising only non-sex-linked genes that appear to follow a mixture distribution to explore the associations of these mixing mechanisms. For example, if there is one common mixture mechanism governing all of the genes in a set, then the fraction of subjects simultaneously fall-ing in the same mixfall-ing component of these genes would be high. We then use varimax factor anlaysis [5,6] to see whether we can identify more than four genes operating under a common mixing mechanism. One confirmation that the common mixture mechanism has biological importance would be to identify genetic relationships between a subject's single-nucleotide polymorphism (SNP) genotypes and expression phenotypes. Bayesian factor screening (BFS) [7] is one statistical strategy pro-posed to identify these relations. In this paper, the mixture model-based approach with extended SKUMIX algorithm, partial correlation analysis, factor analysis, and BFS are systematically combined to analyze the Problem 1 data set in Genetic Analysis Workshop 15 (GAW15) [8,9].
Methods
The expression intensities transformed here are the origi-nal observations rather than the log2 values reported in the data set. The 0.3-power transformation is the transfor-mation that maximizes the probability plot correlation coefficient (PPC, see Filliben [10]) for the greatest number of genes.
Mixture analysis using Gaussian mixture model
The SKUMIX algorithm is extended in our mixture analy-sis. First, we applied the Box-Cox family of power transfor-mations without the scale parameter (see Eq. (1)). Second, we considered a wider interval [0, 1.5] than the one recommended by Maclean et al. [2] for selecting the optimal power parameter. Third, as suggested by Ning et al. [11], we used 6.9 as the 0.05 critical value for LRT of "a single component distribution" vs. "a mixture distribu-tion of two components."
Partial correlation analysis
We calculate the Pearson product moment correlation coefficients rij = r(xi, xj), first-order partial correlations rij.k
= r(xi, xj|xk) and second-order partial correlation
coeffi-cients rij.kl = r(xi, xj|xk, xl) [12] for expression phenotype variables whose values are the 0.3-power Box-Cox trans-formed expressions. The partial correlation criteria are:
The last two inequalities in criterion Q reduce redundancy by removing quartets built on trios. We identify trios of expression phenotype variables (xi, xj, xk) that meet crite-rion T and quartets (xi, xj, xk, xl) that meet criterion Q.
Measure of common mixing mechanism
When a gene expression variable appeared to be a mix-ture, we fit a mixture of two Gaussian components with equal variance using MCLUST [13] and classified each subject into the component with the largest Bayesian pos-terior probability [14]. We called the component with estimated probability less than 0.5 the "uncommon com-ponent" and the other one the "common component." The concordance rate (C) in a gene set is the ratio of subjects that simultaneously fall into the uncommon or the com-mon components for all the genes in the set. A value of C
close to 1 suggests a common mixture mechanism. We selected genes in a trio or quartet with C ≥ 80% for the fac-tor analysis. Fleiss' statistic κ[15] was used to assess agree-ment. A value of κ> 0.75 indicated excellent agreement, while κ< 0.40 indicated poor agreement [16].
Factor analysis
Each gene expression variable that appeared to be a mix-ture and was present in one or more trios or quartets was included in a factor analysis using varimax rotation.
Bayesian factor screening
We used BFS [7,17] to identify SNPs significantly associ-ated with expressions of the genes from the factor analysis.
We only considered the regression model with second-order interactions:
where the values of x1, x2,..., xS are recoded genotypes (1 for minor homozygotes, 2 for heterozygotes, 3 for major homozygotes, and -2 for missing data) of S (2682) con-sistent and informative SNPs that may have linear main effects and/or interaction effects on the gene expression variable γ. Let γbe the indicator vector such that γj = 0 if βj = 0 and βij = 0 for all i ≠j, and γj = 1 if otherwise. Then a model (or an element) in the model space can be repre-sented by a binary vector γ= (γ1, γ2,..., γS) that ranges from γ(1) = (0, 0,..., 0) to = (1, 1,..., 1), with the model size
defined as . In our study, we set the
model size m = 6, the chain length CL = 200,000, and the magnitude of the effect relative to the experimental noise λ= 1.5. We use the Java program developed by Yoon [17] to find the optimal model from the model subspace
con-sisting of = 5.14 × 10¹⁷ elements. The output gives an estimate of each SNP's marginal posterior probability (MPP) of appearing in the 200,000 selected models. An MPP close to 1 suggests that the SNP is an important fac-tor (either as a main effect or as one of two terms in an interaction) for the gene expression variable.
Results
Of the 3554 gene expressions analyzed, 2561 appear to follow a normal distribution. After a Box-Cox transforma-tion to maximize the PPC, 659 give evidence of being a mixture with two components, and 334 appear to have three components. Figure 1 contains the histogram of the 0.3-power Box-Cox transformed expressions of TUBG1 that appears to follow a mixture of two components. The left component is the uncommon one, with estimated proportion 15.7% and estimated mean of 19.9. The right component is the common one, with estimated propor-tion 84.3% and estimated mean of 26.1.
We find 233 trios containing 54 genes that meet criterion T, and 115,840 quartets containing 3554 genes that meet criterion Q. Of the 233 trios, 88 include only mixture dis-tributions (involving a total of 29 genes). Of the 115,840 quartets, 7342 include only mixture distributions (involv-ing a total of 902 genes). A number of trios and quartets contain only linked genes. When we exclude these sex-linked gene sets, there are 18 trios and 35 quartets with a
value of C ≥ 80%. These trios and quartets contain 33 non-sex-linked genes in total.
One example is the quartet containing HNRPAB, PSMD2, TUBG1, and AHSA1. Each of these genes appears to be a mixture with very small p-value; Figure 1 is the histogram of the 0.3-power transformed expressions of TUBG1. The correlation between PSMD2 and HNRPAB (using the 0.3-power transformed expressions) is 0.825, and the partial correlation between PSMD2 and HNRPAB controlling for TUBG1 and AHSA1 is 0.094. Table 1 is the four-way con-tingency table in which each subject is classified by the Bayesian posterior probability into the common or uncommon component. The C value for this set of genes is 83.50%. Specifically, 136 of 194 subjects are simultane-ously common and 26 are simultanesimultane-ously uncommon in these four genes so that 162 of 194 subjects (that is, 83.50%) are concordant. There are, respectively, 14 (1+6+7) and 9 (6+3) additional subjects that fall into the common and uncommon components of three genes out of the four, suggesting a larger concordance rate for smaller gene sets.
A factor analysis on the 0.3-power transformed gene expression levels of the 33 non-sex-linked genes identifies three factor groups. As listed in Table 2, Factor 1 appears to consist of 18 genes, Factor 2 appears to consist of 8 genes, and Factor 3 appears to consist of 7 genes. A trio with a high value of C contains genes from Factor 2 or from Factor 3. A quartet with a high value of C contained all genes either from Factor 1 or from Factor 3.
We then examined whether the genes in each factor group follow a common mixture mechanism. In each factor group, we started with the pair of genes that have the
high-y= +α
∑
Sj=1βj jx +∑
i j< βij i jx x +ε,γ(2S)
m=
∑
Sj=1γj ∈[ , ]0SC62 682,
Histogram of the 0.3-power Box-Cox transformed TUBG1
Figure 1
est C value and added the gene from the factor group that least reduces C. For example, the first two genes A1 = {AHSA1, ELAC2} have the largest C = 94.85%, with κ= 0.8257. The gene CCT3 had the least reduction in C value of the 16 genes remaining in Factor 1. We include genes from Factor 1 sequentially until we got the final gene group A17 = A16 ∪ {SOD1} with C = 56.70% and κ = 0.6440. For this factor group, the reduction in C value with adding one gene to the set ranges from 1% to 3%. Similar results hold for Factor groups 2 and 3.
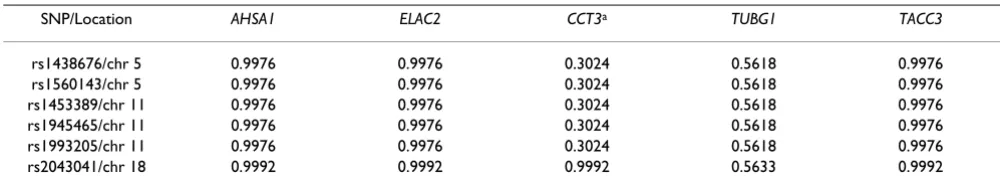
We extended the mixture analysis with BFS applied to the five most concordant genes in Group 1 (AHSA1, ELAC2,
CCT3, TUBG1, and TACC3, with C > 85% and κ> 0.75). For each of these genes, BFS identifies six SNPs that have very large MPPs, as shown in Table 3.
Conclusion
About 28% of genes from GAW15 Problem 1 appear to follow a two- or threecomponent mixture distribution. Important structural relations seem to be partially disen-tangled using first- and second-order partial correlation matrices. These partial correlation coefficients can be effec-tively used to identify trios and quartets of genes that have a more complex structure. There are 18 trios and 35 quar-tets in which the genes are all non-sex-linked but follow a common mixture distribution with C ≥ 80%. That is, the underlying mixture mechanisms of these genes appear to be highly associated. This pattern of association appears to involve a large number of genes. A computational strategy using the varimax rotation in a factor analysis finds a group of 18 genes with C = 56.7%, another group of 9 genes with
C = 60.8%, and a third group of 7 genes with C = 69.6%. The R package MIXMECH that has been developed here for
Table 1: Contingency table for TUBG1, AHSA1, PSMD2, and HNRPAB
Subjects Classified into Common or Uncommon Components
TUBG1↓ AHSA1↓ PSMD2 → Common Uncommon
HNRPAB → Common Uncommon Common Uncommon
Common Common 136 6 7 4
Uncommon 1 3 2 6
Uncommon Common 0 0 0 3
Uncommon 0 0 0 26
Table 2: Concordance rate (C) for sets of genes selected from factors
Factor 1 Factor 2 Factor 3
Seq Gene C (%) κ Gene C (%) κ Gene C (%) κ
1 AHSA1, ELAC2
94.85 0.8257 RPL32, RPS18
92.78 0.8278 PRKAR1A, ST13
93.30 0.8609
2 CCT3 90.72 0.7773 RPS15 87.63 0.8104 MATR3 86.08 0.8117 3 TUBG1 88.66 0.7663 RPS28 81.96 0.7701 PPM1B 80.93 0.7934 4 TACC3 85.57 0.7555 RPS10a 76.29 0.7081 PDCD10 77.84 0.7825 5 NDUFS6 82.99 0.7495 RPS19 72.68 0.6677 SF3B1 73.71 0.7684 6 CDC45L 80.41 0.7273 B2M 68.56 0.6340 G3BP2 69.59 0.7521
7 DHX9 77.84 0.7216 RPS10b 64.43 0.5578 NA NA NA
8 FEN1 75.26 0.7096 PABPC1 60.82 0.5510 NA NA NA
9 HNRPAB 73.71 0.7070 NA NA NA NA NA NA
10 PSMD2 72.16 0.7034 NA NA NA NA NA NA
11 CSE1L 70.10 0.6931 NA NA NA NA NA NA
12 C20orf24 67.53 0.6800 NA NA NA NA NA NA
13 JTV1 65.46 0.6755 NA NA NA NA NA NA
14 LANCL2 63.92 0.6662 NA NA NA NA NA NA
15 TSTA3 62.37 0.6572 NA NA NA NA NA NA
16 CCT7 59.79 0.6514 NA NA NA NA NA NA
17 SOD1 56.70 0.6440 NA NA NA NA NA NA
Publish with BioMed Central and every scientist can read your work free of charge "BioMed Central will be the most significant development for disseminating the results of biomedical researc h in our lifetime."
Sir Paul Nurse, Cancer Research UK
Your research papers will be:
available free of charge to the entire biomedical community
peer reviewed and published immediately upon acceptance
cited in PubMed and archived on PubMed Central
yours — you keep the copyright
Submit your manuscript here:
http://www.biomedcentral.com/info/publishing_adv.asp
BioMedcentral
the mixture analysis of microarray expression data is freely available at the websites http://www.ams.sunysb.edu/ ~yayang and http://www.sinc.sunysb.edu/Stu/atashman.
The significance of these findings is not immediately clear. For example, one possible source of a mixture mechanism that is not substantively interesting is the non-homoge-nous measurement process of the gene expressions. The data used here are from 14 pedigrees rather than from a random sample of cases or controls. Therefore, we do not know the magnitude of the effect of dependence among subjects generated by the family structure. In results not shown here, however, we obtained results parallel to these when we restricted our analysis to the 56 unrelated found-ers, suggesting that the effect of the intra-familial depend-ence is minor. As always, replication of these results on an independent data set is a crucial step to confirm the scien-tific value of this approach and our findings.
Nevertheless, the high concordance rates and high Fleiss κ coefficients suggest that there may be a common mecha-nism determining which component a subject falls into. More importantly, the BFS result showing a strong associ-ation between the five most concordant genes in Group 1 with the six SNPs strongly suggests that there is an under-lying biological mechanism.
Competing interests
The author(s) declare that they have no competing inter-ests.
Acknowledgements
The data were collected under HG002386. Our work is supported by GAW grant R01 GM31575. NRM's research is supported in part by NIMH R01 MH071523, and SJF's is supported in part by NIMH 2R01
MH04480114A1. We thank our group members (GAW15 Group 5), the reviewers, the editors, Cathy Falk and Deborah L. Levy for their thoughtful comments.
This article has been published as part of BMC Proceedings Volume 1 Sup-plement 1, 2007: Genetic Analysis Workshop 15: Gene Expression Analysis and Approaches to Detecting Multiple Functional Loci. The full contents of the supplement are available online at http://www.biomedcentral.com/ 1753-6561/1?issue=S1.
References
1. McLachlan GJ, Bean RW, Peel D: A mixture model-based approach to the clustering of microarray expression data. Bioinformatics 2002, 18:413-422.
2. Maclean CJ, Morton NE, Elston RC: Skewness in commingled dis-tributions. Biometrics 1976, 32:695-699.
3. Box GEP, Cox DR: An analysis of transformations. J R Stat Soc Ser B 1964, 26:211-246.
4. Simon HA: Spurious correlation: a causal interpretation. J Am Stat Assoc 1954, 49:467-479.
5. Gorsuch RL: Factor AnalysisHillsdale, NJ: Lawrence Erlbaum; 1983. 6. McLachlan GF, Peel D, Bean RW: Modelling high dimensional
data by mixtures of factor analyzers. Comput Stat Data Anal
2003, 41:379-388.
7. Yoon S, Suh YJ, Mendell NR, Ye KQ: A Bayesian approach for
applying Haseman-Elston methods. BMC Genetics 2005,
6(Suppl 1):S39.
8. Morley M, Molony CM, Weber TM, Devlin JL, Ewens KG, Spielman RS, Cheung VG: Genetic analysis of genome-wide variation in human gene expression. Nature 2004, 430:743-747.
9. Cheung VG, Spielman RS, Ewens KG, Weber TM, Morley M, Burdick
JT: Mapping determinants of human gene expression by
regional and genome-wide association. Nature 2005,
437:1365-1369.
10. Filliben JJ: The probability plot correlation coefficient test for normality. Technometrics 1975, 17:111-117.
11. Ning YM, Finch SJ: The null distribution of the likelihood ratio test for a mixture of two normals after a restricted Box-Cox transformation. Comm Stat Simul Comp 2000, 29:449-461. 12. Sokal RR, Rohlf FJ: BiometryNew York: Freeman; 1995.
13. Fraley C, Raftery AE: Model-based clustering, discriminant
analysis, and density estimation. J Am Stat Assoc 2002,
97:611-631.
14. Casella G, Berger RL: Statistical InferenceBelmont, CA: Wadsworth & Brooks/Cole; 1990.
15. Fleiss JL: Measuring nominal scale agreement among many raters. Psychol Bull 1971, 76:378-382.
16. Fleiss JL: Statistical Methods for Rates and ProportionsNew York: John Wiley & Sons; 1981.
17. Yoon S: Bayesian factor screening. In DissertationStony Brook Uni-versity, Department of Applied Mathematics and Statistics; 2006.
Table 3: Marginal posterior probabilities (MPPs) of six SNPs associated with AHSA1, ELAC2, CCT3, TUBG1, and TACC3
SNP/Location AHSA1 ELAC2 CCT3a TUBG1 TACC3
rs1438676/chr 5 0.9976 0.9976 0.3024 0.5618 0.9976
rs1560143/chr 5 0.9976 0.9976 0.3024 0.5618 0.9976
rs1453389/chr 11 0.9976 0.9976 0.3024 0.5618 0.9976
rs1945465/chr 11 0.9976 0.9976 0.3024 0.5618 0.9976
rs1993205/chr 11 0.9976 0.9976 0.3024 0.5618 0.9976
rs2043041/chr 18 0.9992 0.9992 0.9992 0.5633 0.9992