PREDICTING AND SIMULATING FUTURE LAND
USE PATTERN: A CASE STUDY OF SEREMBAN
DISTRICT
Shamsaini Shamsuddin, Ahris Yaakup Email: [email protected]
Department of Urban and Regional Planning, Universiti Teknologi Malaysia, Skudai, Johor, Malaysia
ABSTRACT As long as rapid urbanization which is a result of natural population growth and rural urban migration due to push and pull factors of social and economic conditions as well as the moving of urban populations from major city centres to urban fringe areas due to changing lifestyle which emphasized on spacious and more comfortable and environmentally friendly living environment continue to happen; towns and cities will continue to grow and expand to accommodate the growing and complex demand of the people. Experiences have shown that rapid and uncontrolled expansion of towns and cities has led to amongst others the deterioration in the quality of urban environment and sprawling of urban development onto prime agricultural and forest areas as well as cities starting to lose their identity. In order to avoid such phenomena continuing to happen, particularly in the Kuala Lumpur Conurbation Area, towns and cities need to be properly planned and managed so that their growth or expansion can be controlled and managed in a sustainable manner. One of the strategies adopted to curb sprawling development is through the delineation of urban growth or development limits (UGL). This means that the limit of towns and cities need to be studied and identified, so that urban development can be directed to areas that are identified and specified suitable for such development. One of the main tasks in the process of delineating UGL has been included as an important task in the preparation of development plans. With such policy a research study is now being carried out to develop a spatial modelling framework towards delineating UGL through the application and integration of spatial technologies and this will be a basis or framework for land use planners, managers and policy makers to formulate urban land use policies and monitor urban land use development. One of the main analysis involve in the process of performing this task is to understand past urban land development trend and to predict and identify future urban growth areas of the selected study area. This paper highlights the integration of statistical modeling technique via binary logistic regression analysis with GIS technology in understanding and predicting urban growth pattern and area as applied to District of Seremban, Negeri Sembilan. The result shows that urban land use pattern in the study area within the study period are significantly related to more than half of the predictors used in the analysis.
Introduction
Most major urban areas in the country are expanding and signs of sprawling development are emerging. The uncontrolled and continuous expansion of urban areas and continuing demand for urban land has not only lead to haphazard development but also problems of loss of prime agricultural land and fragmentation of forest land which in a way affect the connectivity between wildlife habitat and wetlands and also the degradation in the quality of the living environment (FDTCP, 2000). Generally, this pattern can be seen through the urban developments that include residential, commercial, industrial and other institution developments taking place on previously undeveloped land surrounding or at the fringe of major cities. This phenomenon is expected to continue especially when there is no sign that urban growth will slow down.
Urban growth being attributed to natural population growth and the rural-urban migration is expected to increase at an unprecedented rate in the coming decades and this will definitely lead to more changes in the urban environment. In the case of Malaysia, the level of urbanisation in the country as a whole has increased from 34.2% in 1980, to 51.1% in 1991, 61.8% in 2000. The level is expected to accelerate further to reach 66.9% by 2005. For Peninsular Malaysia alone, the level of urbanisation has increased from 54.3% in 1991 to 65.2% in 2000 and it is expected to reach 75% by 2020 at an average growth rate of 2.8% from 2000-2020. (FDTCP, 2003)
development so as to reduce the negative spin off effects from sprawling development, the spatial and temporal dimensions that contribute to the land use changes and pattern that shape the urban landscape need to be understood. The urban development changes that took place and the likely changes or pattern that will occur basing on past historical data and existing development trends, constraints and policies for the area concerned could be analyse by using spatial modeling techniques coupled with the use of Geographical Information System (GIS) technology.
Planners must try to anticipate and try to visualize how big the city will grow or the extent of urban area over the next 10 to 20 years, and where the growth is likely to locate and what will be the likely impact of the expected growth if certain policy direction is undertaken. As urban land use system are complex systems which involves interaction between components, factors and agents from both human and the natural systems hence a more holistic approach need to be adopted through an integrated method in modeling and predicting future urban growth. Some form of reliable prediction method need to be adopted to generate information in order to answer the questions above.
In order to understand past and predict future urban growth pattern, no single method is seen to be the most appropriate. Past studies have shown that various spatial modelling methods, such as statistical models (e.g. logistic regression, discriminated analysis, multiple regression analysis and linear programming methods), cellular automata model, rule based models with Geographical Information Systems (GIS) can be applied to understand, predict and simulate future urban spatial growth and pattern (Jianquan and Masser, 2002; Samat, 2006; Allen, and Lu, 2003, Pijanowski et al, 1997 and Landis, J. and Zhang, 1997).
Logistic Regression Model
The binomial logistic regression is used to define the relationship between an event and its driving factors. It calculates the probability of occurrence of the event, in this context urban land use (dependent variable) using independent variables as predictors. This method is used because the phenomenon under study (dependent variable) is measured at a nominal scale, a binary (0 or 1) and the independent variables are of mixed measurement level, either continuous, or categorical variables.
The general form of the logistic regression model is as follows (Chou, Y, 1997)
Pa = EXP(Ua)/1 + EXP(Ua) where, Ua = β0 + β1X1 + β2X2+….+ βnXn + e
Pais the probability for event a to occur (event here means whether the land is urban or non urban use)
Ua is utility function of event a, expressed in linear combination of explanatory variables, X1’ X2…. Xn;
βn is the estimated parameter of the variables Xn;
The linear form of the above equation can be expressed as the natural log of the probability of being urban divided by the probability of being non-urban as follows:
Ln {Pa / (1- Pa) = β0 + β1X1 + β2X2+…. + βnXn + e
For each predictor value the regression produces odd ratios which are the exponents of the logit of the coefficient and are called as the exponent B (Exp B). The odds ratio for a predictor tells the relative amount by which the probability increase (odds ratio > 1) or decrease (odds ratio < 1) when the value of the predictor value is increased by 1 unit.
Here, the interest is to look into the factors or explanations that drive urban land use development. Basing on the parameters derived from the predictors that significantly influence urban land development, areas that have high probabilities to be converted to urban land use in the future, i.e. the “hot spots” for land use changes are identified. Such information will indicate where priority for planning and further research should be focused. Apart from that, basing on the information derived, future urban land pattern of the area concerned could be predicted.
Mapping the Urban Extent
The urban transition probability map generated from the regression model is use as the basis to map the extent of urban area for the predicted year. Here, the spatial sequence of future urban development is assumed to follow the descending order of the transition probabilities values. This means that land cells with higher transition probability values will develop first. So, in predicting the urban extent for the specified period, the selected of the land cells to be converted to urban use for the predicted year will stop when the size of the demanded area is met.
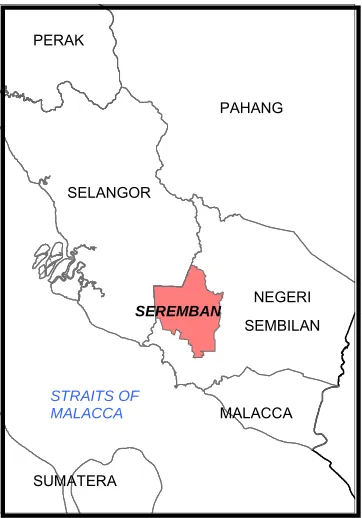
Study Area
The study area covers the District of Seremban in Negeri Sembilan which is located south of the Klang Valley region. Figure 1 shows the location of the study area. One of the main reason for selecting this district as the case study area, is because part of this district and two towns located within this district, namely Seremban (the state and district capital), and Nilai have been identified to be part of the Kuala Lumpur Conurbation, which is the fastest growing conurbation in Peninsular Malaysia (FDTCP, 2003 and DTCP, 2005).
Selangor and the Multimedia Super Corridor, this area is expected to benefit most from the Klang Valley and Multmedia Super Corridor Development.
Apart from that, within the Negeri Sembilan state itself, the study area that form the west part of the state has experienced a more rapid economic growth and high population growth as compared to other parts of the state. This is mainly attributed to its location which is border to the city of Putrajaya (the new Federal Administrative Centre), Multimedia Super Corridor, Cyberjaya and KLIA that provide the job opportunities. Besides that this area is well developed with good and complete road network. Apart from that Seremban being the state capital of Negeri Sembilan, has made the district of Seremban to attract more business and trade activites as compared to other districts within the state (DTCP, 2004 )
PAHANG
NEGERI SEMBILAN SELANGOR
MALACCA
SUMATERA PERAK
SEREMBAN
STRAITS OF MALACCA
The Urban Development Driving Factors
There are many factors that influence or drive the growth or expansion of urban areas and they can be categorized into physical, socio-economics and environmental main factors. The driving factors proposed to be included in modeling urban land development for the study area are grouped into 5 main categories (Table 1).
Table 1: Proposed driving factors of urban land development for study area –
Seremban District
Variable Name Variable Type Description/Expected influence
Dependent Variable
Urban Land Use Binary 1 : urban use (1997) 0 : non urban use
All Built-Up, Infrastructure and utilities, Mining and Open Space and Recreation use were reclassified into urban land use. Other land uses were reclassified as non urban use
Independent Variables 1.0 Physical
Characteristics 1.1 Soil class 2 (1,0)
Categorical Soil more suitable for agriculture growth
1.2 Soil class 3 (1,0)
Categorical Soil less suitable for agriculture growth
1.3 Soil class 5
(1,0) Categorical Soil most suitable for urban development 1.4 100 years
Flood prone area (1,0)
Categorical 0 : Beyond flood prone area 1 : Within flood prone area
1.5 Distance to river
Continuous Distance to river, measured in meters from every cell.
2.0 Accessibility to
Infrastructure/fa cilities and major centres 2.1 Distance to
highway (U6)
Continuous Distance to highway measured in meters from every cell in 1997. The nearer the cell to the highways the higher possibility to be developed into urban use. 2.2 Distance to
major roads - Federal roads (U5) and State roads (U4)
Continuous Distance to federal roads and state roads measured in meters from every cell in 1997. The nearer the cell to these major road the higher possibility to be developed into urban use.
2.3 Distance to rail
station Continuous Distance to rail station in meters from every cell in 1997. The nearer the cells to the train station the better the chances for the areas to be developed into urban use.
existing urban areas in 1990
each cell. Probability to change to urban use decreases as distance from center increases.
2.5 Distance to KLIA airport in 1997
Continuous Distance to Kuala Lumpur International Airport is measured in meters from each cell. This variable is assumed to influence urban land development in the study area particularly in receiving the spillover effects from the new airport development.
2.6 Distance to Putrajaya in 1997
Continuous Distance to the new Federal administrative centre, Putrajaya is measured in meters from each cell. This variable is assumed to influence urban land development in the study area particularly in receiving the spillover effects from this township development.
2.7 Distance to major node- Capital City Seremban
Continuous Distance to Seremban town centre measured in meters from each cell. Probability to change to urban use decreases as distance from center increases.
2.8 Distance to other major nodes –Bandar Nilai and Mantin
Continuous Distance to Nilai and Mantin town centre measured in meters from each cell. Probability to change to urban use decreases as distance from center increases.
3.0 Initial conditions 3.1 Agricultural
Areas in 1990 (1,0)
Categorical Land under this land use type are prone to urban development.
3.2 Forest Areas in 1990 (1,0)
Categorical Less susceptible to urban development as land under this land use type are mostly designated as forest reserves and are protected areas.
3.3 Urban areas in
1990 (1,0) Categorical Stable land use and assumed not to change to lower hierarchy land use. This land use type includes existing built up, mining and also open space and recreational areas.
3.4 Cleared land/vacant land in 1990 (1,0)
Categorical These are land that have been cleared and are most potential for urban development.
3.5 Water bodies in 1990 (1,0)
Categorical Stable land use and assumed not to change to lower hierarchy land use.
4.0 Growth pressure/market factor/socio-economic 4.1 Population
density – High density in 1997
Categorical Measured as mukim population per acre= 1 : High density areas
0 : Other areas
4.2 Population density – Medium density in 1997
Categorical Measured as mukim population per acre= 1 : Medium density areas
4.3 Population density – Low density in 1997
Categorical Measured as mukim population per acre= 1 : Low density areas
0: Other areas
5.0 Policy factors
5.1 Municipal
boundary Categorical 1: Areas within local authority boundary and inside control area – priority area for development 0: Areas outside local authority boundary and outside
control area.
Data Preparation
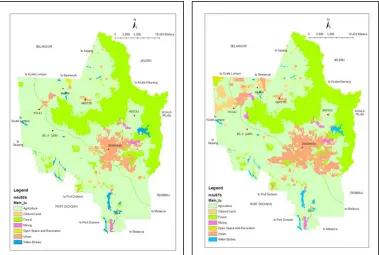
In this study, the land use data sets for years 1990, 1997 and 2000 were obtained from the Land Use/Cover maps made available digitally from the Department of Agriculture, Kuala Lumpur. The land use categories were reclassified as shown in Figure 2 and 3. All other data were obtained and digitized from hardcopy maps from the Department of Town and Country Planning Department, Negeri Sembilan and also from related Draft Structure Plan, Draft Local Plan and Technical reports as well as from Census reports 1991 and 2000, Department of Statistics, Malaysia. All data were converted into ArcInfo format for the purpose of analysis. The tools under the Grid and Spatial Analyst modules have been widely extensively to prepare the necessary spatial variables.
All data were prepared and stored in ArcGIS version9 software and the logistic regression model was calibrated for the year 1997 using the statistical package SPSS version 13. The unit of analysis used in this study grid based cells of 100 meters by 100 meters. All variables were converted into this cell format for analysis.
Figure 2 and 3 below show the Land Use maps of the study area for the year 1990 and 1997 respectively.
the year 2010 is adopted from the Draft State Structure Plan Study of Negeri Sembilan 2001-2020, October 2005.
Analysis and Result
Before executing the logistic regression analysis the variables were first checked for spatial autocorrelation (spatial dependency) using the Moran’s I index computed using the Grid module of ArcInfo 9.0 (Jianquan, 2002). It was found that the Moran’s I index for all variables exceed 0.8, indicating high autocorrelation. Hence a spatial random sampling procedure was carried out using the Grid module, ArcGIS 9 to reduce the spatial autocorrelation detected to ensure that the logistic regression analysis produces more reliable parameter estimates. In this study when a 10 percent random sampling (9631 cases) was undertaken the Moran’s I Index reduced significantly to below 0.5 for all variables.
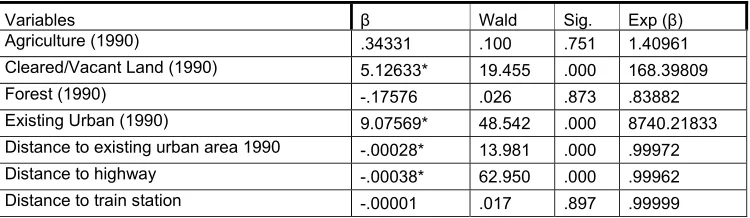
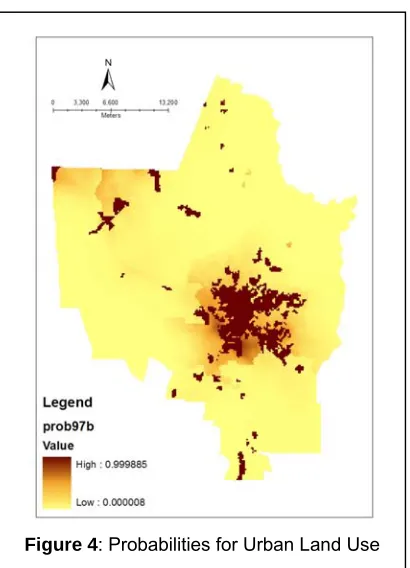
The β values resulting from the regression analysis done show in Table 2 and these values are used to generate the probability map for urban land use as shown in Figure 4.
The overall prediction success rate for the model as shown by the PCE Index was very good i.e. 95.8% with 0.5% cut off value. The success rate for non-urban use was very high i.e. 99.8%. However the prediction success rate for urban use was quite low i.e. 63.9%. This is understandable as the study area is predominantly rural in nature.
Out of all the variables entered in the modeling process, only 19 variables were selected and 13 variables are found to be statistically significant at 95 percent significant level. The major determinants with negative effects on the 1997 urban land use are distance to highway and distance to Putrajaya. This means that the occurrence of urban use is higher in areas that are nearer to these infrastructure and node. According to the Wald values, areas with medium population density, distances to highway and distance to Putrajaya, distance to KLIA and existing urban use have the greatest effects on urban development in the study area. This is not a surprising result as theoretically it is obvious that urban use always occur in areas near to highways and near existing developed areas. Apart from that the result shows that urban use are taking place in medium population density areas, implying that urban development are now moving out from highly populated areas to less populated area. The urban land development in the study area is also positively influenced by the distance to major roads, i.e. the federal and state roads.
Table 2: Spatial Logistic Regression Result
Variables β Wald Sig. Exp (β)
Agriculture (1990) .34331 .100 .751 1.40961 Cleared/Vacant Land (1990) 5.12633* 19.455 .000 168.39809
Forest (1990) -.17576 .026 .873 .83882
Distance to main roads .00038* 25.173 .000 1.00038 Distance to Seremban Town Centre -.00009* 5.620 .018 .99991 Distance to main centers, Nilai and Mantin .00016* 14.300 .000 1.00016 Distance to KLIA .00022* 48.863 .000 1.00022 Distance to Putrajaya -.00032* 61.617 .000 .99968 Distance to river -.00004 .761 .383 .99996
Flood prone area -.07663 .058 .810 .92623
Soil class 2 .16644 1.242 .265 1.18109
Soil class 3 -1.73866* 27.014 .000 .17576
Local Authority and controlled area 1997 .43080* 7.553 .006 1.53848 Low Population density area -1.15041* 5.945 .015 .31651 Medium Population density area -1.50850* 57.159 .000 .22124
Constant 3.11454* 4.729 .030 22.52298
PCE* Index for non urban (0) 99.8% PCE Index for urban (1) 63.9%
Overall PCE Index 95.8%
PCE – percentage correctly estimated * Statistically significant
The result also revealed that the local authority boundary has a weak positive influence on urban use in the study areas. This means that urban development in the study area is not strictly confined to areas within local authority boundary and controlled areas only but also can occur in areas outside these areas. This can also indicate the sprawling development that is occurring in the study area, and may be due to the development opportunities that exist in areas that are nearer to the Selangor border to accommodate the spillover effects from the KLIA airport and the multimedia super corridor developments.
performance was a very good agreement whereby the kappa statistics result is 0.828.
The figures (5 & 6) below show the simulated urban extent for year 2000 and 2010 based solely on the probability map generated. Committed and planned future projects within the period 2000 to 2010 were not incorporated in the prediction exercise.
Assuming the prediction and assumption used was realistic, the future urban growth areas by 2010 will mostly be concentrated on the north-west, expanding from Nilai town and bordering Selangor state. Apart from that urban development will occur in areas surrounding Seremban city, expanding to the fringe areas of the existing urban areas and filling in the gaps within core city area.
Conclusion
The study above has shown that the model developed has enabled the prediction of future urban areas be identified. It has also shown that areas with medium population density, areas nearer to North South Highway have strong influence on the occurrence of urban land use in the study area. It also revealed that urban development is not strictly confined to areas within local authority boundaries and controlled areas only and developments are spreading out to areas nearer to Selangor state. The spatial information based on the prediction of the urban extent can help planners and urban managers to focus on the probable areas that are highly susceptible to change to urban use and appropriate policy measures could then be formulated to direct infrastructure and financial allocation to the relevant areas.
Figure 5 : Simulated urban area of Figure 6: Simulated urban area of
Non urban Urban Non urban
Since the study did not incorporate any future planned and committed development for the area, hence further research refinement of the analysis shall be conducted as to how such factors could be incorporated to enhance the reliability of the prediction. One of the ways is to integrate this method with other modeling techniques to produce better prediction.
References
Allen, J. and Lu K., 2003. Modeling and Prediction of Future Urban Growth in the Charleston region of South Carolina: a GIS-based Integrated Approach. Conservation and Ecology 8 (2): 2
Chou, Yue Hong, 1997. Exploring Spatial Analysis in Geographic Information Systems. OnWord Press. Santa Fe, United States of America.
Jianquan C. and Masser I., 2003. Modelling Urban Growth Pattern: A Multiscale Perspective : In Environment And Planning A, 35 (2003) 4, pp 679-704.
Department of Town and County Planning (DTCP), Negeri Sembilan 2004. Laporan Pemeriksaan, Rancangan Struktur Negeri, Negeri Sembilan 2001-2020.
Department of Town and County Planning (DTCP), Negeri Sembilan. 2005. Laporan Draf Rancangan Struktur Negeri, Negeri Sembilan 2001-2020. October 2005.
Federal Department of Town and Country Planning (FDTCP), 2003. Final Technical Report, Package B: Physical Planning, Urban Centres and Hierarchy, Rancangan Fizikal Negara, October 2003.
Landis, J. D. and Zhang M., 1997. Modelling urban land use change: the next generation of the California urban future model. Paper submitted to the Land Use
Modeling Workshop, USG EROS Data Center, June 5 – 6, 1997, Sioux Falls, South Dakota, USA
Pijanowski, B.C., Long D.T., Gage S.H., and Cooper W.E. 1997. A land transformation model: conceptual elements, spatial object class hierarchies, GIS command syntax and an application for the Michigan Saginaw Bay watershed. Submitted to the Land Use Modeling Workshop, USGS EROS Data Center, June 5 – 6, 1997, Sioux Falls, South Dakota, USA
N. Samat, 2006. Integrating GIS and Cellular Automata Spatial Model in Evaluating Urban Growth: Prospects and Challenges. Paper presented at the ASIA GIS 2006