Urban Land Use Land Cover Changes and Their Effect on Urban
Thermal Pattern: Case Study of Nigeria’s Federal Capital City
Ajayi Vincent Olanrewaju
Department of Meteorology and Climate Science, Federal University of Technology PMB 704 Akure, 340001, Nigeria
Abstract
Since the official movement of the seat of government from Lagos to Abuja in 1991, the Federal Capital City being the most habitable area in the entire Federal Capital Territory has continued to experience rising urban population growth; this has resulted in a significant modification of its natural landscape. Such modifications often affect the microclimate of cities. This study investigates the effect of changing urban land use/cover on urban thermal pattern through the application of remote sensing, geographic information systems (GIS) and statistical methods. Land use land cover (LULC) and land surface temperature (LST) were extracted from Landsat 4 TM (1987) and Landsat 8 OLI/TIRS (2014). The result of LULC show that while built-up area and wasteland classes increased by 19.93% (from 23.57% in 1987 to 43.50% in 2014) and 15.87% (from 14.88% in 1987 to 30.75% in 2014) respectively, vegetation cover decreased by 35.63% (from 60.63% in 1987 to 25% in 2014). This significant vegetation cover loss to both built-up area and wasteland is an indication of man’s dominance of the landscape of the city. The study revealed that the lowest values for minimum, maximum and mean temperature occurred in 1987 (17.03, 31.16 and 24.3°C respectively) while the highest values for minimum, maximum and mean temperature occurred in 2014 (25.01, 37.38 and 32.54°C respectively). In 1987, relatively lower LST values (23-26°C) were dominant occupying about 84.38% of the total land area while, in 2014; higher LST values (31-34°C) were dominant occupying approximately 84.14% of the total land area. These results show that a significant portion of the natural landscape elements of the FCC has been removed due to rapid urbanization and this has resulted in the formation of hotspots across the city. The results of this research bring to fore the need for urban planners in the FCC to put in place temperature-mitigation strategies so as to ensure the sustainability of the city.
Keywords: LULC; LST; classification; FCC; SUHIs 1 Introduction
Land cover describes the biophysical state of the earth surface including forest, vegetation, wetland, soil and hard surfaces (Cheng et al., 2008) while land use denotes the human use of land such as farmland, settlement, etc. the concept of land use and land cover change is defined as the transformation of one land use and land cover (LULC) type on Earth’s surface to another (Petit & Lambin, 2002). Urbanization (physical growth of urban area) is one of the most significant land-use changes that were made by humans.
Cities across the world are witnessing rapid urban land use land cover changes due to rising urban population levels triggered by the migration of people from rural areas to cities. These rapid urban growths usually lead to environmental degradation because natural ecosystems such as natural green spaces and wetlands that reduce air temperatures are removed and then replaced with impervious surface materials (built-up surfaces). These materials whose surfaces are quite dark have greater thermal conductivity and higher solar radiation absorption, which make them absorb most of the insolation that falls on them. The absorbed solar energy heats up the pavements resulting in increased land surface temperatures (LST) (Yuen and Kong 2009; Obiakor et al.
2012; Ahmed et al. 2013). LST is the temperature emitted by the land surface as observed by sensor at instant viewing angles (Rajeshwari & Mani, 2014; Schmugge et al., 1998). The percentage of each LULC types which occupy an urban area is one of the major factors influencing LST.
Impervious surfaces are man-made surfaces, which do not allow the permeation of water from land surfaces into the underlying soil (Okeke 2016). The increasing domination of the urban landscape by these impervious surfaces leads to the formation of Surface Urban Heat Islands (SUHIs), where urban areas show higher LST than the surrounding rural areas (Voogt & Oke 2003). SUHIs are a direct outcome of a degraded urban environment and it is the most important problem affecting urban microclimate. The intensity and spatial pattern of SUHI is dependent on the characteristics of the landscape (albedo and thermal emissivity), urban geometry (sky-view factor and building layout), weather conditions (cloud cover and wind) and human activities generating anthropogenic heat (Hamdi & Schayes 2007; Unger 2004). Many of these factors are primarily determined by land use/cover.
Rapid technological advancement in the field of thermal infrared remote sensing has immensely boosted the assessment of the relationship between LST and land use/cover. Environmental and urban climate scientists have used LST satellite-derived data to analyze how thermal patterns are connected to landscape characteristics, urban heat island and the surface energy balance (Liu & Zang 2011; Oke et al. 1992; Friedl 2002; Renzullo et al. 2008).
106
Lu and Weng (2004) developed a spectral mixture analysis in order to assess the relationship between urban thermal features and landscape pattern types in the City of Indianapolis, Indiana. The results proposed that impervious surface and LSTs had a positive linear relationship while vegetation and LSTs had a negative linear relationship for the study area.
Since the launch of the Landsat Earth observation program in 1972 multispectral remote sensing and geospatial tools have been applied for environmental thermal pattern analysis and land use/land cover studies (Carlson et al., 1977; Bechtel & Daneke 2012; Weng 2001; Selcuk et al. 2003; Abdullah 2012; Fu & Weng 2016). Remote sensing (RS) integrated with Geographic Information Systems (GIS) provides a cost-effective technique for retrieving data on urban landscapes due to its large spatial coverage, high time resolution, and wide availability. Satellite RS collects multi-spectral, multi-resolution and multi-temporal spatial data transforming them into valuable information for monitoring and understanding urban LULC while GIS as a computer-based system, collects, stores, analyze, and displays spatially organized information. With the availability of historical remote sensing data, open and free software and data, and satellite platforms with increased resolution; remote sensing technology appears ready to make an even greater impact on monitoring the land use/cover change and its effects on the thermal environment.
Nigeria’s Federal Capital City (FCC) is an administrative centre and hosts government offices and international embassies hence, it is rich in infrastructure such as expanding road networks, pipe borne water, drainage and sewage systems, electricity, and communication networks. Due to its central location and accessibility makes people from all parts of the country crowd into the city in search of better living. With an annual growth rate of at least 35%, the city retains its position as the fastest growing city on the African continent and one of the fastest growing in the world. This increasing urban population and massive physical infrastructural development has led to profound changes in the status of its land use and land cover thereby exposing FCC to increased temperature and heat islands. Although quite a number of studies have been undertaken using satellite-derived LULC data, only a few efforts have been made to access the impact of urban LULC change on the urban thermal environment in Nigeria’s capital city. This study utilizes remote sensing techniques using Landsat images to generate land use/cover and surface temperature maps in order to evaluate the urban land use/cover changes in FCC, and to analyze the impact of land use/cover on LST. Landsat spectral bands have proven to be effective not only for identifying LULC (Koutsias & Karteris, 2003), but also for LST change assessment (Loveland & Defries, 2013). This study provides professionals such as landscape architects, environmentalists, and urban planners the much-needed information for putting in place temperature mitigation mechanisms for sustainable city development.
2 Study area, Materials and Methods
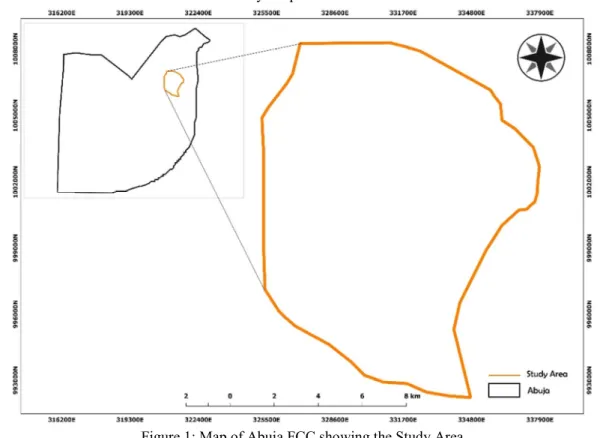
Abuja, the capital city of Nigeria has an estimated population of about 6 million people (Jaiyeola & Andrew 2016). It lies between latitude 9°4′North of the equator and longitude 7°29′East of the Greenwich Meridian. The Federal Capital City (FCC) which is the focus of this study is located at the northeastern part of the Federal Capital Territory on latitude 09.00° – 09.12°N and longitude 07.26° – 07.32°E (Figure 1). The FCC falls within the Gwagwa plains with a terrain elevation, which ranges between 305m in the western sector to 610m in the eastern sector (Ojigi 2005). It is reputed to be the most ideal and conducive location for human habitation and settlement development within the FCT (Mabogunje 1976). The area is characterized by a hilly, dissected terrain and is the highest part of the FCT (Balogun 2001). The annual rainfall is highest within the FCC and its environs, which is about 1,631.7 mm. The annual mean temperature ranges between 25.8 and 30.2°C (Balogun 2001). The city being the seat of government houses the administrative headquarters of Nigeria government ministries, departments and agencies, and it is therefore rich in infrastructural facilities.
For the study, Landsat satellite images of Abuja were acquired under clear condition for two Epochs (1987 and 2014) from United States Geological Survey (USGS). The details of the datasets: satellites, sensors, spatial resolutions and source are mentioned in Table 1. The selection of images was done such that the period of assessment was the same (dry season between December and January) so as to ensure consistency in vegetation and land use change comparison. The acquired Landsat dataset’s datum was projected to WGS 84 and referenced to the Universal Transverse Mercator (UTM) Zone 32 North. To facilitate effective mapping of vegetation and environmental changes, radiometric correction (which involves the conversion of digital numbers to surface reflectance) was carried out on the image bands for the four Epochs. The calibrated image scenes were then clipped against the administrative boundaries of the study area for subsequent analysis. The images were classified using the maximum likelihood discriminant analysis classifier of the supervised classification scheme into the land use/land cover classes as given in Table 2. An error matrix and a kappa analysis approaches were used to assess the accuracy of classification. Kappa analysis is a discrete technique that is suitable for accuracy assessments (Congalton & Green 1998; Jensen 1996). This study relied on information closest to the historical date such as topographic maps, Google Earth images, sample points and familiarity with the study area to assess the accuracy.
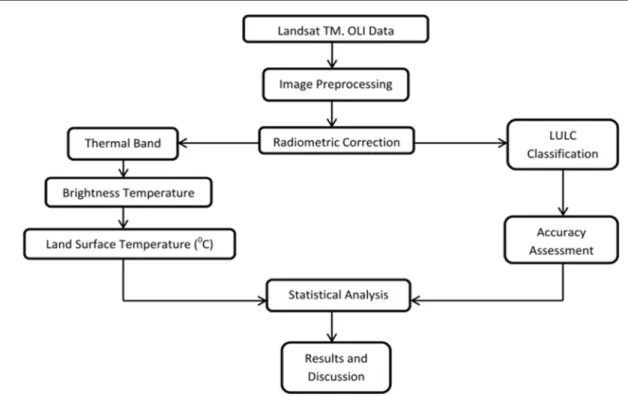
The urban landscape thermal pattern of the FCC was mapped using the thermal band images of Landsat TM and OLI images. In this study, the LST was retrieved using the Land Surface Temperature Estimation Plugin in QGIS developed by Isaya Ndossi & Avdan 2016. This method is of three major steps namely: (1) Conversion of digital number to spectral radiance using the gain and bias values specific to the individual scene (Chandler et al. 2009); (2) Conversion of spectral radiance to brightness temperature value by applying the inverse of Planck’s function (NASA 2011) and (3) Computation of emissivity-corrected LST from brightness temperature (Sobrino
et al. 2008). The methodology flow implemented for this study is represented schematically as a flow chart (Figure 2).
3 Results and discussion
Land use land cover distribution and change and land surface temperature distribution and change are the two main subsections in which the results of this study are presented:
108
Figure 2: Methodology Flow Chart Table 1: Data type and source.
S/ N Date of acquisition Path-row, scanner Spatial resolution (m) Source
1 2
1987-12-21
2014-01-05 189-54, LANDSAT-8 OLI 189-54, LANDSAT-TM 30/120 30/100 USGS USGS Table 2: Description of the land use land cover classes.
LULC classes Description
Waterbody Areas permanently covered with standing or moving water e.g. wetland, lake, rivers, water ponds, etc.
Built-up Area Areas on which buildings and/or non-building structures are present e.g. cities, towns, roads, etc.
Vegetation Areas covered with plants and trees e.g. forests, farms, flowers, etc.
Wasteland Areas without scrub, sandy areas, dry grasses, rocky areas and other man-induced barren lands.
3.1 Land use land cover distribution and change
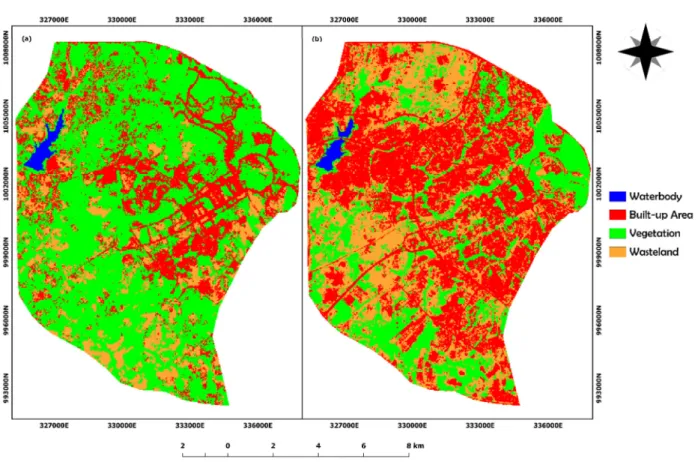
Figure 3 shows the LULC maps in 1987 and 2014 as generated from the maximum likelihood algorithm of the supervised classification scheme. The LULC maps were delineated into four classes (waterbody, built-up area, vegetation and wasteland) with very high accuracy as shown in Table 3. In 1987, an overall accuracy of 99.94% and overall kappa hat classification of 0.99 were obtained with built-up area, vegetation and wasteland having the highest producer accuracies. In 2014, an overall accuracy of 99.89% and overall kappa hat classification of 0.99 were obtained with built-up area and vegetation having the highest producer accuracies.
From the classification, the study area covers a total area of 14,375,0381m2. The land use land cover distribution and change captured in Tables 4 reveals the following: the waterbody class represented in blue colour that occupied 0.92% in 1987 reduced slightly to 0.75% in 2014; built-up area represented in red colour increased from 23.57% to 43.50% between the years 1987 and 2014; vegetation (represented in green colour) recorded a significant reduction from 60.63% in 1987 to 25% in 2014; and the wasteland LULC class represented in brown colour also recorded an increase in its status from 14.88% in 1987 to 30
Figure 3: Land use Land cover classifications for (a) 1987 (b) 2014. Table 3: Land use Land cover classification accuracy assessment.
LULC classes 1987 2014
Producer accuracy - User accuracy Producer accuracy - User accuracy
Kappa hat Kappa hat
Waterbody 99.89% 100% 1.0 99.68% 100% 1.0 Built-up Area 100% 100% 1.0 99.95% 99.95% 0.99 Vegetation 100% 99.85% 0.99 99.95% 99.87% 0.99 Wasteland 100% 100% 1.0 99.94% 99.74% 0.99 Overall Kappa hat classification 0.99 0.99
110
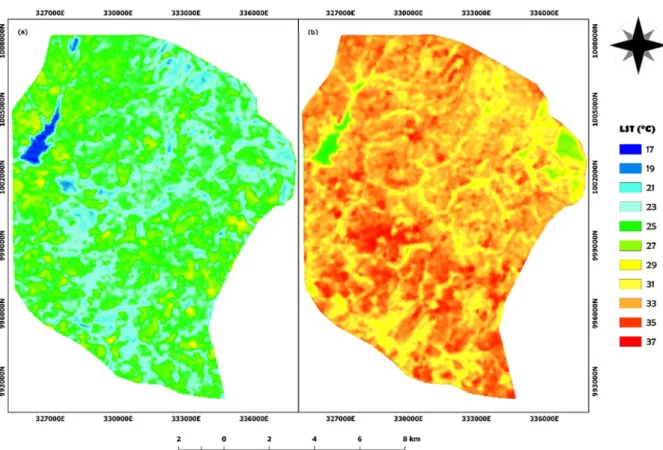
Figure 4: LST maps for (a) 1987 (b) 2014.
Table 4: Land use Land cover distribution and change pattern (1987 and 2014).
LULC classes Land area Change in land area 1987 2014 1987 - 2014 (m2) (%) (m2) (%) (m2) (%) Waterbody 1,320,719 0.92 1,081,720 0.75 -238,998 -0.17 Built-up Area 33,877,323 23.57 62,524,720 43.50 28,647,397 19.93 Vegetation 87,160,111 60.63 35,938,945 25.00 -51,221,166 -35.63 Wasteland 21,392,228 14.88 44,204,995 30.75 22,812,767 15.87 Total 143,750,381 100 143,750,381 100
This study reveals that the city has grown into a compact urban agglomeration especially in the north-western sector where built-up area has become bigger and more aggregated. There has been an extensive urban expansion from both the north-eastern and south-eastern sectors of the city towards the north-western sector. The south-western sector of the city also witnessed the development of new residential areas and modern infrastructural facilities such as roads, airport and stadium. The observed change in urban LULC pattern was quite significant especially in the built-up area, vegetation and wasteland classes. The increase by 19.93% in built-up area, reduction in vegetation by 35.63%, and the subsequent increase in wasteland by 15.87% all suggest the domination of man in the landscape under review. This significant temporal change is attributable to increasing urban population growth, which is traceable to Nigeria’s much improved socio-economic and political climate. The loss of vegetation cover to both built-up area and wasteland due to much encroachment because more residential and official buildings, infrastructural facilities and industries have to be put in place in order to cater for the needs of the increasing population, while the slight reduction in waterbody by 0.17% is an indication of the increasing demand for water and encroachment due to rising population (Fanan et al. 2011; Ige
et al. 2017).
3.2 Land surface temperature distribution and change
Within this section, the computed LST maps of the study area are shown in Figure 4 while Table 5 shows the analysis of LST statistics in FCC for 1987-2014. In year 1987, LST values show ranges between 17°C-31°C, while in year 2014, LST values show ranges between 25°C-37°C. The lowest values for minimum, maximum
and mean temperature occurred in 1987 (17.03, 31.16 and 24.3°C respectively) while the highest values for minimum, maximum and mean temperature occurred in 2014 (25.01, 37.38 and 32.54°C respectively). The range of LST was less in 2014 (12.37°C) compared to 1987 (14.13°C).
Generally, hotspots in the FCC were easily identifiable with wasteland and built-up area classes and in contrast, due to evapotranspiration and shading, considerably lower temperatures were consistently found in areas where waterbody and vegetation classes were dominant. Also noteworthy in the landscape under review is the rate at which reduced vegetation triggered by the combination of rising built-up area and wasteland classes has resulted in increased urban temperatures (heat pockets) between years 1987 and 2014. Increasing urbanization often engender the replacement of natural landscape elements (vegetation cover, waterbody, etc.) with artificial elements (built-up area and other non-vegetative features); because vegetation is usually cleared before the erection of structures, and in response to this, surface energy balance energy balance is usually altered resulting in rising temperature (Xiao et al. 2018; Santamouris et al. 2011; Alavipanah et al. 2015; Adeyeri et al.
2017). This explains the substantial expansion of the observed smattering and scattered hotspot features in year 1987 all across the fledging city in 2014.
Table 5: Land surface temperature statistics (1987-2014). Year Land surface temperature (°C) Minimum Maximum Range Mean 1987 17.03 31.16 14.13 24.42 2014 25.01 37.38 12.37 32.54
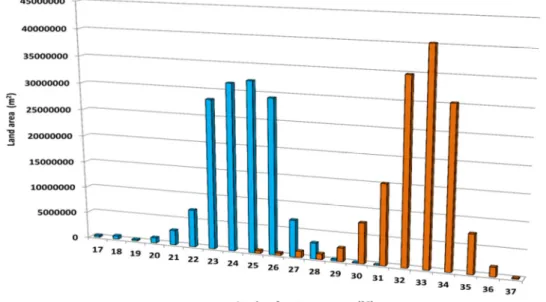
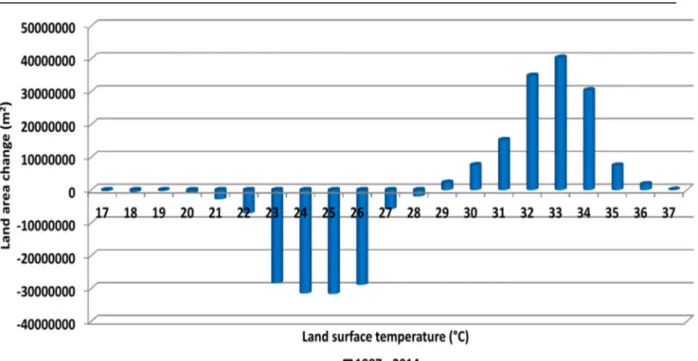
In order to quantify the noticeable increased urban temperature, the spatial pattern of LST distribution and change from 1987 to 2014 was computed and analysed. From Figure 5, it can be seen that in 1987, areas with LST values between 23 and 26°C were dominant totaling 121,320,900 m2, this represents 84.38% of the total land area while, in 2014, areas with higher LST values between 31 and 34°C totaling 120,771,900 m2 which represents 84.14% of the total land area became the major LST areas. These findings indicate that areas with higher LST were more dominant in 2014 compared to 1987. The fluctuation of the LST areas between 1987 and 2014 indicates that relatively lower LST values below 27°C persistently decreased while major increases in LST values above 29°C were observed (Figure 6). This LST distribution pattern clearly attests to the impact land use land cover change has had on the microclimate of the FCC.
112
Figure 6: LST change between 1997 and 2014. 4 Conclusion
This paper-utilized remote sensing data to monitor how changes in land use land cover has impacted on the thermal pattern of Nigeria’s Federal Capital City. Landsat 4 TM (1987) and Landsat 8 OLI/TIRS (2014) data were used to extract LST and LULC, which were then statistically analyzed in order to establish any logical relationship between them. The Maximum Likelihood Classification algorithm proved to be a very efficient method in classifying the LULC over the FCC. Four LULC classes (waterbody, built-up area, vegetation and wasteland) were identified, and an overall accuracy and overall Kappa of 99% were achieved. The results indicate that the city has grown to become a relatively compact urban agglomeration. Although urban growth seems to be occurring in almost every part of the city, the concentration of built-up area in the north-western, south-eastern and north-eastern sectors of the city has become bigger and more aggregated. For the period under review (1987-2014), very significant changes were observed in the dominant urban land use/cover classes, which are built-up area, vegetation cover and wasteland. While built-up area and wasteland increased by 19.93% and 15.87% respectively, vegetation cover decreased by 35.63% (from 60.63% in 1987 to 25% in 2014). This vegetation cover loss to both built-up area and wasteland is indicative of the rising urban population growth in the FCC. Also noteworthy is the slight reduction in waterbody by 0.17% (from 0.92% in 1987 to 0.75% in 2014). This is attributable to increasing water demand and wetland encroachment by the populace.
The LST distribution pattern clearly attests to the impact urban land use/cover change has had on the urban thermal pattern of the city. The significant increases recorded in the built-up area and wasteland classes, which substantially decreased vegetation cover, have led to an increase in surface temperature. The mean surface temperature has increased by 8.12°C, from 24.42°C in 1987 to 32.54°C in 2014. There was a slight drop in the range of LST in 2014 (12.37°C) compared to 1987 (14.13°C). In 1987, the dominant LST values (23-26°C) occupied about 84.38% of the total land area while in 2014; the dominant LST values (31-34°C) occupied 84.14% of the total land area. These increases in LST values through time are very consistent with the observed urban expansion within the period under review. The LST maps also reveal the pattern of the urban thermal environment where higher surface temperature values were recorded in wasteland and built-up area classes while waterbody and vegetation classes recorded considerably lower surface temperature values. The result show that much of the natural landscape elements of the FCC have been removed due to rapid urbanization and this has resulted in decrease in cool LST areas and increase in hotspot formation across the city.
Thus, this study recommends that further studies on the urban morphology of the FCC should adopt the local climate zone classification concept, which will allow for a more detailed urban typology information extraction and also intra-urban temperature comparison. Lastly, in order to ensure the sustainability of the city, policy makers should put in place an aggressive temperature mitigation strategy for land surface management coupled with stricter enforcement of the city’s master plan in order to forestall any further degradation of the land.
Acknowledgement
The author express his gratitude to NASA project for Landsat data used in this study. The author also acknowledges the contribution of Mr. Samuel Ige in the data processing and analysis.
References
Abdullah, H.J. (2012), “The Use of Landsat-5 TM Imagery to Detect Urban Expansion and Its Impact on Land Surface Temperatures in The City of Erbil. Iraqi Kurdistan”, Master’s Thesis, Leicester University, Leicester, UK.
Adeyeri, O. E., Akinsanola, A. A., & Ishola, K. A. (2017), “Investigating urban heat island characteristics over Abuja, Nigeria: Relationship between land surface temperature and multiple vegetation indices”, Remote Sensing Applications:Society and Environment. [In press].
Ahmed, B.; Kamruzzaman, M.; Zhu, X.; Rahman, M.S.; Choi, K., (2013), “Simulating land cover changes and their impacts on land surface temperature in Dhaka, Bangladesh”, Remote Sens., 5(11): 5969-5998 (30 pages).
Alavipanah, S.; Wegmann, M.; Qureshi, S.; Weng, Q.; Koellner, T., (2015), “The role of vegetation in mitigating urban land surface temperatures: a case study of Munich, Germany during the warm season”, Sustainability, 7(4): 4689-4706, 18PP
Balogun, O. (2001), “The Federal Capital Territory of Nigeria: A Geography of its Development”. University Press, Ibadan.
Bechtel, B.; Daneke, C. (2012), “Classification of local climate zones based on multiple earth observation data”,
IEEE J. Sel. Top. Appl. Earth Obs. Remote Sens., 5, 1191 –1202.
Carlson, T.N., Augustine J.A., and Boland F.E. (1977). "Potential application of satellite temperature measurements in the analysis of land use over urban areas." Bulletin of the American Meteorological Society no. 58 (12):1301-1303.
Chandler, G., Markham, B. L., & Helder, D. L. (2009), “Summary of current radiometric calibration coefficients for Landsat MSS, TM, ETM+, and EO-1 ALI sensors”, Remote Sensing of Environment, 113(5), 893-903. Cheng, Y., Nie, J., Li, G., Zhang, C. & Wang, W. (2008). Study on land use and land cover change with the
integration of RS, GIS and GPS technologies-the case of Baotou City in the ecotone of agriculture-animal husbandry, China. Geoscience and Remote Sensing Symposium Presented in IGARSS 2008 International IEEE, pp. IV.
Congalton, G. R., & Green, K. (1998), “Assessing the accuracy of remotely sensed data: Principles and practices”, Boca Raton: Lewis Publishers.
Fanan, U., Kwabe, I. D., Ifatimehin, O. O. (2011), “Urban expansion and vegetal cover loss in and around Nigeria’s Federal Capital City”, Journal of Ecology and the Natural Environment Vol. 3(1), pp. 1-10. Friedl, M. A. (2002), "Forward and inverse modeling of land surface energy balance using surface temperature
measurements", Remote Sensing of Environment 79(2-3): 344-354.
Fu, P.; Weng, Q. A (2016), “Time series analysis of urbanization induced Land Use and Land Cover change and its impact on Land Surface Temperature with Landsat imagery”, Remote Sens. Environ., 175, 205–214. Hamdi, R., and G. Schayes. 2007. "Sensitivity study of the urban heat island intensity to urban characteristics."
International Journal of Climatology no. 28 (7):973-982.
Ige, S. O., Ajayi, V. O., Adeyeri, O. E., Oyekan, K. S. A., (2017), “Assessing Remotely Sensed Temperature Humidity Index as Human Comfort Indicator Relative to Landuse Landcover Change in Abuja, Nigeria”,
Spatial Information Research. DOI: 10.1007/s41324-017-0118-2.
Isaya Ndossi, M., & Avdan, U. (2016), “Application of open source coding technologies in the production of land surface temperature (LST) maps from Landsat: a PyQGIS plugin”, Remote Sensing, 8(5), 413.
Jaiyeola I., & Andrews O. (2016), “FCT minister harps on development of satellite towns”, Archived from this day live. Accessed 16th April 2018.
Jensen, J. R. (1996), “Introductory digital image processing: A remote sensing perspective”’ (2nd ed.), Upper Saddle River: Prentice Hall.
Koutsias, N., and Karteris, M. (2003). Classification analyses of vegetation for delineating forest fire fuel complexes in a Mediterranean test site using satellite remote sensing and GIS. International Journal of Remote Sensing, 24(15), 3093-3104. doi: 10.1080/0143116021000021152
Liu, L.; Zhang, Y. (2011), “Urban heat island analysis using the Landsat TM data and ASTER data: A case study in Hong Kong”, Remote Sens. 3, 1535–1552.
Loveland, T.R. and DeFries, R. (2004). Observing and Monitoring Land Use and Land Cover Change, In DeFries, R., Asner, G., & Houghton, R., (eds.), Ecosystems and Land Use Change, Geophysical Monograph Series, Volume 153, American Geophysical Union, Washington, DC, 231-246.
Lu, D. S. and Weng, Q. (2004). "Spectral mixture analysis of the urban landscape in Indianapolis with landsat ETM plus imagery." Photogrammetric Engineering and Remote Sensing 70(9): 1053-1062.
114
Mabogunje, A. L. (1976), “Report of the Survey of the Federal Capital Territory”. Vol. 1. FCDA, Abuja.
NASA. (2011), “Landsat 7 science data user’s handbook” Accessed 22nd April 2012 from http://landsathandbook.gsfc.nasa.gov/pdfs/Landsat7_Handbook.pdf.
Obiakor, M. O.; Ezeonyejiaku, C. D.; Mogbo, T. C., (2012), “Effects of Vegetated and Synthetic (Impervious) Surfaces on the Microclimate of Urban Area”, J. Appl. Sci. Environ. Manag., 16(1): 85-94 (10 pages). Ojigi, M. L, (2005), “Digital Terrain Modeling & Drainage Analysis of the Northern part of Abuja Phase II Dev.
Area, Using Geospatial Techniques”, An Unpublished Ph.D. Thesis in Remote Sensing Applications.
Federal University of Technology, Minna Nigeria pp.178.
Oke, T. R., Zeuner, G. & Jauregui, E. (1992). "The Surface-Energy Balance in Mexico-City", Atmospheric Environment Part B-Urban Atmosphere 26(4): 433-444.
Okeke, F. I. (2006) “Mapping impervious surface changes in watersheds in part of south eastern region of Nigeria using Landsat data”, Proceeding of 5th FIG Regional Conference on Promoting Land Administration and Good Governance.
Petit, C. C., & Lambin, E. F. (2002). Impact of data integration technique on historical land-use/land-cover change: Comparing historical maps with remote sensing data in the Belgian Ardennes. Landscape Ecology, 17(2), 117-132.
Rajeshwari, A., and Mani, N. D. (2014). Estimation of land surface temperature of Dindigul Woreda using Landsat 8 data. International Journal of Research in Engineering and Technology, 3(5), 122–126.
Renzullo, L. J., Barrett, D. J., Marks, A. S., Hill, M. J., Guerschman, J. P., Mu, Q. Z. & Running, S. W. (2008), "Multi-sensor model-data fusion for estimation of hydrologic and energy flux parameters", Remote Sensing of Environment 112(4): 1306-1319.
Santamouris, M., Synnefa, A., & Karlessi, T. (2011), “Using advanced cool materials in the urban built environment to mitigate heat islands and improve thermal comfort conditions”, Solar Energy. doi:10.1016/j.solener.2020.12.023.
Schmugge, T., Hook, S. J., and Coll, C. (1998). Recovering surface temperature and emissivity from thermal infrared multispectral data. Remote Sensing of Environment, 65(2), 121–131.
Selcuk, R., Nisanci, R., Uzun, B., Yalcin, A., Inan, H., & Yomralioglu, T., (2003), “Monitoring land-use changes by GIS and remote sensing techniques: case study of Trabzon”, Accessed 23 April 2018 from http://www.fig.net/pub/morocco/proceedings/TS18/TS18_6_reis_el_al.pdf 5.
Sobrino, J.A., Jimenez-Munoz, J.C., Soria, G., Romaguera, M., Guanter, L., Moreno, J., Plaza, A., & Martincz, P., (2008), “Land surface emissivity retrieval from different VNIR and TIR sensors”, IEEE Transactions on Geoscience and Remote Sensing, 46, pp. 316-327.
Unger, J. 2004. "Intra-urban relationship between surface geometry and urban heat island: review and new approach." Climate research no. 27 (3):253-264.
Voogt. J. A, Oke. T. R, (2003), “Thermal remote sensing of urban climates”, Remote Sensing of Environment, 86, 370 – 384.
Weng Q, (2001), “A remote sensing-GIS evaluation of urban expansion and its impact of surface temperature in Zhujiang Delta, China”, Int J Remote Sens, 22(10), 1999-2014.
Xiao, R.; Weng Q., Ouyang Z., Schienke E.W. & Zhang Z. (2008), “Land surface temperature variation and major factors in Beijing China”, Photogrammetric engineering and RS 74(4), 451-461.
Yuen, B. & Kong L. (2009), “Climate change and urban planning in Southeast Asia”, S.A.P.I.E.N.S. 2(3), Accessed 23 April 2018 from sapiens.revues.org/pdf/881.